6034 Fores Hill Blvd #101 · Greenacres, FL
Flood risk 4/10 · Minor
- FEMA flood zone
- X (unshaded)
- Chance of flooding over 30 yrs
- 0.22%
- Est. flood insurance / yr
- $507 – $1,088
Fire risk 1/10 · Minimal
- Est. fire insurance / yr
- $947 – $1,759
Heat risk 9/10 · Severe
- Hot days now (above 105°F)
- 6 days/yr
- Hot days in 30 yrs
- 22 days/yr
Wind risk 10/10 · Severe
- Chance of severe wind over 30 yrs
- 99.0%
Air-quality risk 2/10 · Minimal
- Unhealthy air days now
- 1 days/yr
- Unhealthy air days in 30 yrs
- 1 days/yr
Risk factors via First Street. Map © Google.
Why this score? — see what drove the C grade
The composite is a weighted blend of 9 inputs, each scored 0–100. Each bar is that input's sub-score; the figure is the points it added to the 100-point composite (weight × sub-score).
- Cash flow +22.3/30.0
- 1% rule +10.0/10.0
- ARV discount +7.5/15.0
- DSCR +7.1/10.0
- Schools +4.3/10.0
- Livability +3.5/5.0
- Condition / age +2.5/5.0
- Rent growth +2.1/5.0
- Appreciation +0.0/10.0
$120,000
🖨 Deal sheet 📄 Offer letter ✓ Due diligence
Listing remarks MLS
NO AGE RESTRICTIONS. CONVIENTIENT LOCATIONS. COME SEE AND BUY
Key facts
- Parking spot
- Comfortable patio
- $416 HOA
Tags
Neighborhood map
What this means for you Summary
Snapshot
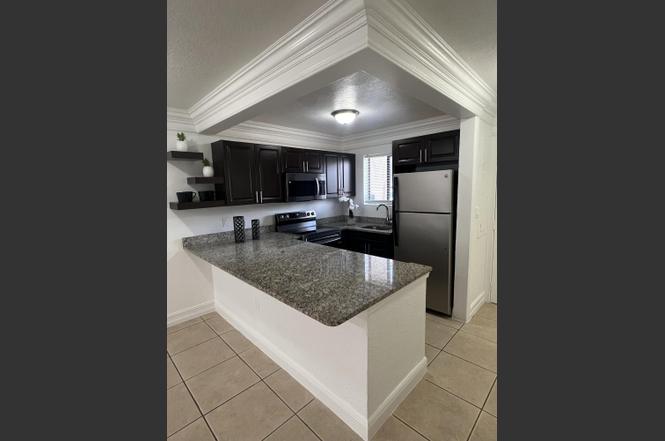
- This is a 1-bed/1.0-bath condo listed at $120k.
Deal economics
- At list price, monthly cash flow is $197 ($2k/yr) — positive.
- The deal already cash-flows at list — no discount required.
- Meets the 1% rule at list price ($2k rent vs $120k).
Location & tenants
- Location reads 69/100 on livability (#490 in FL) — a middle-class / working-renter tenant base. Strengths: cost of living A+, housing A+, health & safety A; Watch: schools D+, employment D, amenities F.
- Palm Beach (suburban): math 46% / reading 53% proficiency, ranked #34 of 73 in FL (top 47%) — families likely to look elsewhere, expect single-tenant / working-renter base with shorter leases.
- Market conditions: Rents soft (-1.6%/yr); 314 active listings in the ZIP; 15 comparable units currently listed for rent nearby; rentals at typical pace (median 25d on market — plan ~3-4 weeks tenant-placement turnaround); 3,974 units permitted in Palm Beach County in 2024 (1,012 in 5+ unit buildings).
- This rent runs 35% of the median local income ($61k/yr) — at the standard rent-burdened threshold; future hikes will face affordability resistance.
Forward outlook
- Local home prices are declining (-3.0%/yr); year-one equity from $830 of loan paydown is wiped out by about $4k of value loss. Plan a longer hold.
- Palm Beach County population projected at +30% by 2050 — long-run rental-demand tailwind backs the buy-and-hold thesis.
Negotiation context
- Only 9 days on market — expect competitive offers; lowballing is unlikely to land.
- 5 sale attempts since 26y ago with the ask held roughly flat each time — persistent listings suggest the price (not the market) is what's stuck; bring a comps-based counter.
Risks & watch-outs
- Watch-outs: HOA is 23% of rent.
- Climate carrying-cost: severe wind risk, 99% chance of damaging wind over 30y; extreme-heat days projected 6→22/yr by 2055 (HVAC capex compounding) — expect insurance premiums to compound above CPI over the hold.
Questions for the listing agent
- What does the HOA fee cover, when was the last increase, and are there any pending special assessments or reserve-fund shortfalls?
- Any open or pending special assessments — roof, HVAC, plumbing, elevator, façade? What's the per-unit balance and payoff schedule, and is the seller paying it off at close or rolling it to the buyer?
- Is there a deadline driving the sale (1031 exchange, divorce, estate, relocation)? That informs how much negotiation room exists.
- Schools are D-rated, which usually means shorter tenancies and higher turnover. Who's the typical renter profile here, and what's been the actual vacancy rate?
- What's the average days-on-market for RENTAL listings here right now (not sales)? A rising rental-DOM trend means longer vacancies and softer asking-rent achievability than the comps imply.
- What's the recent tenant-quality profile in this submarket — average credit score on applications, eviction rate, late-payment / NSF rate, and stable-employment percentage? A property-management company in the area should have these aggregated.
- How much new apartment / multifamily construction is in the pipeline within 1–3 miles? Heavy new supply (>2% of stock underway) typically softens rents 12–24 months out; light construction supports rent growth.
Investment metrics
- 1% rule
- 1.51% ✓
- Cap rate
- 8.27%
- Cash-on-cash
- 7.05%
- DSCR
- 1.31
- GRM
- 5.5
CMA / ARV
No comps found within radius.
Projected returns pro-forma
-3.0% appreciation · 0.0% rent growth · sell at horizon
- IRR
- -10.1%
- Equity multiple
- 0.65×
- Total profit
- $-11,910
- Equity at exit
- $17,892
- IRR
- -7.9%
- Equity multiple
- 0.60×
- Total profit
- $-13,582
- Equity at exit
- $10,375
Cash invested: $33,600 (down + closing). Projections, not guarantees.
Landlord ↔ Tenant lean methodology
- Overall (STATE)
- 87 Strongly Landlord-Friendly
- State Florida
- 87 Strongly Landlord-Friendly · R+3
- County
- — inherits STATE
- City
- — inherits STATE
ZIP-level market 33415
- Rents YoY
- -1.6%
- Active inventory
- 314
- Price-to-rent
- 5.5×
Monthly cashflow live
- Estimated rent
- $1,811 high interval (Pro) →
- Mortgage (P&I)
- −$629
- Tax from tax record
- −$138 /mo · $1,660/yr
- Insurance
- −$50
- HOA
- −$416
- Vacancy / Maint / Mgmt
- −$380
- Net cashflow
- $197
Break-even live
UW: 25.0% down · 7.5% · 30yr · 1.5% tax · 5.0% vac · 8.0% maint · 8.0% mgmt
Financing live
Cash to close
- Down payment
- $30,000
- Closing costs
- $3,600
- Reserves months
- —
- Total cash needed
- —
Loan-product check · same deal, 3 products live
Conventional
25% down · 7.5% · 30yr
- Down + closing
- —
- Monthly P&I
- —
- Monthly cashflow
- —
- DSCR
- —
- Eligible?
- —
Personal DTI + credit; lowest rate.
DSCR
20% down · 8.5% · 30yr
- Down + closing
- —
- Monthly P&I
- —
- Monthly cashflow
- —
- DSCR
- —
- Eligible?
- —
No personal income docs; deal must DSCR.
Hard money
10% down · 12.0% · 12mo
- Down + closing
- —
- Monthly P&I
- —
- Monthly cashflow
- —
- DSCR
- —
- Eligible?
- —
Short-term bridge; refi at stabilization.
Rent comps 15 comps
| Address | Beds | Baths | Sqft | Rent | $/sqft | DOM | Units | Dist |
|---|---|---|---|---|---|---|---|---|
| 6106 Forest Hill Blvd West Palm Beach, FL | 2.0 | 1.0 | 728 | $1,900 | $2.61 | 24d | 2 | 0.01mi |
| 6054 Forest Hill Blvd #102 West Palm Beach, FL | 2.0 | 1.0 | 728 | $1,800 | $2.47 | 24d | 1 | 0.01mi |
| 6100 Forest Hill Blvd #105 West Palm Beach, FL | 2.0 | 1.0 | 728 | $2,100 | $2.88 | 24d | 1 | 0.16mi |
| 6106 Forest Hill Blvd #201 West Palm Beach, FL | 2.0 | 1.0 | 728 | $2,000 | $2.75 | 21d | 1 | 0.19mi |
| 6106 Forest Hill Blvd #201 West Palm Beach, FL | 2.0 | 1.0 | 728 | $2,000 | $2.75 | 7d | 1 | 0.19mi |
| 2206 Laurel Way West Palm Beach, FL | 1.0–3.0 | 1.0–2.0 | 850 | $1,700 | $2.00 | 24d | 3 | 0.43mi |
| 2551 Emory Dr W Unit A West Palm Beach, FL | 1.0 | 1.5 | 661 | $1,600 | $2.42 | 24d | 1 | 0.86mi |
| 2647 Emory Dr W Unit C West Palm Beach, FL | 1.0 | 1.0 | 612 | $1,250 | $2.04 | 24d | 1 | 0.94mi |
| 2607 Dudley Dr W Unit L West Palm Beach, FL | 1.0 | 1.0 | 611 | $1,300 | $2.13 | 7d | 1 | 1.02mi |
| 2715 Emory Dr W Unit C West Palm Beach, FL | 1.0 | 1.5 | 661 | $1,425 | $2.16 | 17d | 1 | 1.04mi |
| 2723 Dudley Dr W Unit G West Palm Beach, FL | 1.0 | 1.0 | 611 | $1,300 | $2.13 | 24d | 1 | 1.17mi |
| 1600 Island Shores Dr Greenacres, FL | 1.0–2.0 | 1.0–2.0 | 889 | $1,660 | $1.87 | 24d | 2 | 1.22mi |
| 2805 Crosley Dr E Unit E West Palm Beach, FL | 1.0 | 1.5 | 662 | $1,250 | $1.89 | 24d | 1 | 1.32mi |
| 2854 Crosley Dr E Unit J West Palm Beach, FL | 1.0 | 1.0 | 612 | $1,300 | $2.12 | 24d | 1 | 1.36mi |
| 2550 Lakehaven Rd West Palm Beach, FL | 1.0 | 1.0 | 400 | $1,500 | $3.75 | 24d | 1 | 1.45mi |
HOA detail condo
- Monthly dues
- $416 · $4,992/yr
- Assessments
- None detected in remarks — confirm with the listing agent.
Listing history 19 events
-
2026-03-11status Pending
-
2025-09-16soldstatus $118,000
-
2025-09-06historical $1,800
-
2025-08-12status Pending
-
2025-08-03$120,000 Active
-
2025-07-04$1,800
-
2022-03-01historical
-
2022-01-03$124,900 Active
-
2016-07-19soldstatus $42,000
-
2002-10-17soldstatus $41,000
-
2002-10-07soldstatus $41,000 61-char remark
Show marketing remark (61 chars)
NO AGE RESTRICTIONS. CONVIENTIENT LOCATIONS. COME SEE AND BUY
-
2002-09-04historical 61-char remark
Show marketing remark (61 chars)
NO AGE RESTRICTIONS. CONVIENTIENT LOCATIONS. COME SEE AND BUY
-
2002-08-21$41,500 61-char remark
Show marketing remark (61 chars)
NO AGE RESTRICTIONS. CONVIENTIENT LOCATIONS. COME SEE AND BUY
-
2000-03-14soldstatus $27,500
-
2000-02-01soldstatus $26,500
-
2000-01-31historical
-
2000-01-09$29,900
-
1992-04-03soldstatus $26,000
-
1989-05-02soldstatus $25,000
ⓘ Source: listings_history table (triggers on properties + properties_extension) + one-shot
backfill from property_details.listing_events for pre-trigger history.
Tax reassessment forecast FL · Resets to sale price
- Current annual tax
- $1,660 · $138/mo
- Projected year-2 tax
- $1,660 · $138/mo
- Expected delta
- $0/yr ($0/mo · 0.0%)
ⓘ Screening estimate from a state-policy table — verify with the county assessor before closing.
Climate risk First Street
- Flood 4/10 Moderate FEMA zone X (unshaded) · 22% chance over 30 yrs
- Wildfire 1/10 Low
- Heat 9/10 Extreme 6 d/yr ≥105°F today · 22 d/yr by 30 yrs out
- Wind 10/10 Extreme 99% chance of damaging wind over 30 yrs
- Air quality 2/10 Low 1 unhealthy d/yr today · 1 by 30 yrs out
Nearby sold comps map
Loading sold comps map…
Walkable amenities ~0.75 mi
Loading nearby amenities…
Taxation est. · year 1
- Rental income
- $21,736
- − Mortgage interest
- −$6,722
- − Property taxes
- −$1,660
- − Insurance
- −$600
- − Repairs & maintenance
- −$1,739
- − Management
- −$1,739
- − HOA
- −$4,992
- − Depreciation
- −$3,491
- Taxable income
- $793
- Est. tax owed @ 24.0%
- −$190
- After-tax cash flow
- $2,177/yr
For passive investors: Depreciation is non-cash, so a rental often shows a tax loss while cash-flowing — sheltering income. Rental losses are passive: they offset passive income freely, and up to $25,000/yr can offset ordinary (W-2) income if you actively participate and your MAGI is under $100k (phasing out to $0 by $150k); unused losses carry forward. On sale, claimed depreciation is recaptured at up to 25%, and gains may owe capital-gains tax (a 1031 exchange can defer both). Figures are a year-1 estimate at your 24.0% rate — not tax advice; consult a CPA.
Schools (NCES district)
- District
- Palm Beach
- NCES district ID
- 1201500
- Math proficiency
- 46% ▼ -16.00%
- Reading proficiency
- 53% ▼ -4.00%
- Median HH income
- $53,943
- Composite
- 42.72/100
- National rank
- #3160
- State rank
- #34 of 73 in FL
Livability — Greenacres
- Score
- 69/100
- State rank
- #490
- US rank
- #9008
Category grades
Schools grade is shown separately in the Schools card above.
Census & demographics
- County
- Palm Beach County · 1,438,312 people
- City population
- 65,478
- Metro
- Miami-Fort Lauderdale-Pompano Beach, FL
- Population (ZIP)
- 54,581
- Household income
- $61,274
- Rent vs Own
- Severe rent burden
- 2254.0
Population outlook (Palm Beach County) Hauer SSP2
- Today (2025)
- 1,637,487 people
- By 2030
- 1,743,255 · +6.5%
- By 2040
- 1,948,712 · +19.0%
- By 2050
- 2,132,979 · +30.3%
- By 2075
- 2,530,027 · +54.5%
- By 2100
- 2,706,979 · +65.3%
Race, ethnicity, and origin ACS 2023
- Neighborhood character
- Diverse neighborhood (Simpson 0.63)
- Race & ethnicity
- Hispanic / Latino 53% Two or more races 26% White 21% Black 21% Asian 2%
- Hispanic origin (detail)
- Mexican 7% Puerto Rican 6% Cuban 14% Dominican 2% Salvadoran 1%
- Common ancestry
- Hispanic 9% Romanian 1% Lithuanian 1%
- Foreign-born
- 44% · Canada, Jamaica, Dominican Republic
- Languages at home
- 40% English-only · Spanish 49% French/Haitian/Cajun 8% Other Indo-European 1%
Political lean MEDSL · Palm Beach
- 2024 margin
- Toss-up / Even · D 50.0% · R 49.2%
- 2008→2024 swing
- -22.1pp toward R · 2008: 22.9pp · 2024: 0.8pp
- All cycles
- 2024: D+0.8 2020: D+12.8 2016: D+15.3 2012: D+17.0 2008: D+22.9
Not yet ingested
- Civics
- —
Market trends
- HPI YoY
- ▼ -400.29%
- Current HPI
- 413.9695
- Rent YoY
- ▼ -1.64%
- Metro
- Miami-Fort Lauderdale-Pompano Beach, FL
- State GDP YoY
- ▲ 3.28%
- F500 in state
- 36
Industry mix (Fortune 500 HQ in FL)
| Industry | F500 HQs | Revenue |
|---|---|---|
| Industrial Technology | 2 | $29B |
|
||
| Insurance | 2 | $17B |
|
||
| Retail | 1 | $60B |
|
||
| Technology Distribution | 1 | $58B |
|
||
| Homebuilding | 1 | $35B |
|
||
| Technology Manufacturing | 1 | $35B |
|
||
Price history
+372.0% since first listed19 events — show timeline
- 2026-03-11 Pending — Beaches MLS
- 2025-09-16 Sold (Public Records) $118,000 Public Records
- 2025-09-06 Rental Removed $1,800 RMLSFL
- 2025-08-12 Pending — Beaches MLS
- 2025-08-03 Listed $120,000 Beaches MLS
- 2025-07-04 Listed for Rent $1,800 RMLSFL
- 2022-03-01 Listing Removed — Beaches MLS
- 2022-01-03 Listed $124,900 Beaches MLS
- 2016-07-19 Sold (Public Records) $42,000 Public Records
- 2002-10-17 Sold (Public Records) $41,000 Public Records
- 2002-10-07 Sold (MLS) $41,000 Beaches MLS
- 2002-09-04 Listing Removed — Beaches MLS
- 2002-08-21 Listed $41,500 Beaches MLS
- 2000-03-14 Sold (Public Records) $27,500 Public Records
- 2000-02-01 Sold (MLS) $26,500 Beaches MLS
- 2000-01-31 Listing Removed — Beaches MLS
- 2000-01-09 Listed $29,900 Beaches MLS
- 1992-04-03 Sold (Public Records) $26,000 Public Records
- 1989-05-02 Sold (Public Records) $25,000 Public Records
Property tax history
+9.3%/yrLatest (2025): $1,660 · +4.6% YoY. Source: county tax records.
Cash-flow waterfall
monthlySold comps — $/sqft
last 12 mo · ≤1 miLoading sold comps…