 🏷️ Likely Rental
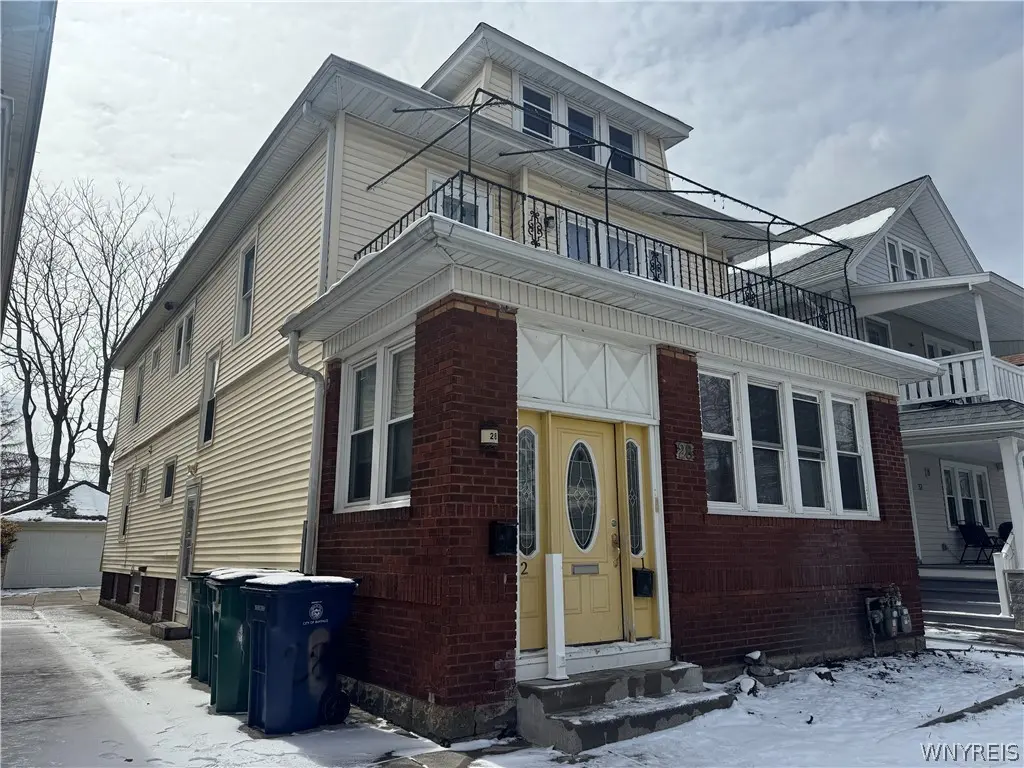
28 Shoreham Pkwy · Buffalo, NY
Flood risk 1/10 · Minimal
- FEMA flood zone
- X (unshaded)
- Chance of flooding over 30 yrs
- 0.0%
- Est. flood insurance / yr
- $473 – $860
Fire risk 1/10 · Minimal
- Est. fire insurance / yr
- $691 – $1,283
Heat risk 3/10 · Minor
- Hot days now (above 92°F)
- 7 days/yr
- Hot days in 30 yrs
- 15 days/yr
Wind risk 1/10 · Minimal
- Chance of severe wind over 30 yrs
- —
Air-quality risk 4/10 · Minor
- Unhealthy air days now
- 4 days/yr
- Unhealthy air days in 30 yrs
- 9 days/yr
Risk factors via First Street. Map © Google.
Why this score? — see what drove the C- grade
The composite is a weighted blend of 9 inputs, each scored 0–100. Each bar is that input's sub-score; the figure is the points it added to the 100-point composite (weight × sub-score).
- Cash flow +16.1/30.0
- ARV discount +15.0/15.0
- DSCR +5.0/10.0
- Livability +3.9/5.0
- Rent growth +3.4/5.0
- Schools +3.3/10.0
- 1% rule +3.1/10.0
- Condition / age +2.5/5.0
- Appreciation +0.0/10.0
$400,000
🖨 Deal sheet 📄 Offer letter ✓ Due diligence
Multi-family units
County records classify this as Multi-Family (2-4 Unit). Listing-text estimate: 1 unit. estimate disagrees with records
Listing remarks MLS
Wonderful, traditional North Buffalo double on a great, fenced yard. The exterior is low-maintenance vinyl. This 3/3 double is a money maker at closing. Both units are tenant-occupied, and tenants would like to stay!. Updates include: The garage overhead door system includes a screen door on the track for your convenience and outdoor enjoyment. Lower has an updated kitchen with a Stainless farm sink, no step ceramic tile shower a Culligan water system, Generac generator, gutter guards, modern mechanics, furnaces 2016 and 2018, hot water tanks 2015, Maintenance free siding, replacement windows, insulation, newer front entry door with sidelights, storm door, vented glass block basement windows, concrete driveway, enclosed lower back porch. The upstairs unit offers the same beautiful details plus a front and rear porch, charming original kitchen and moderately updated Bathfitter bath. 24 hours notice for all showings, showings start immediately.
Key facts
- Fenced yard
- Updated kitchen
- Stainless farm sink
Tags
Neighborhood map
What this means for you Summary
Snapshot
- This is a 6-bed/2.0-bath multifamily listed at $400k.
Deal economics
- At list price, monthly cash flow is $208 ($2k/yr) — positive.
- The deal already cash-flows at list — no discount required.
- To meet the 1% rule (rent ≥ 1% of price), the offer needs to be $323k (19.3% below list).
- Recommended offer: $323k (19.3% below list) — sets the bar for 1% rule.
Location & tenants
- Location reads 77/100 on livability (#195 in NY, #3,011 nationally) — a middle-class / working-renter tenant base. Strengths: commute A+, housing A+, health & safety A+; Watch: crime F, employment D-.
- Buffalo City School District (urban): math 41% / reading 40% proficiency, ranked #535 of 590 in NY (top 91%) — families likely to look elsewhere, expect single-tenant / working-renter base with shorter leases; 75% free/reduced lunch — lower-income household profile, screen leases tightly.
- Market conditions: Rents rising (+3.6%/yr); 88 active listings in the ZIP; 1,244 units permitted in Erie County in 2024 (563 in 5+ unit buildings).
- At $3,229/mo this rent would consume 56% of the median local household income ($70k/yr) (locally 1831% of renters already pay >50% of income on rent) — very limited rent-growth headroom before tenants either downsize or default.
Forward outlook
- Local home prices are declining (-3.0%/yr); year-one equity from $3k of loan paydown is wiped out by about $12k of value loss. Plan a longer hold.
Negotiation context
- It's been on market 71 days — a 6% lower offer ($376k) is reasonable based on typical stale-listing flexibility.
- 3 sale attempts since 5y ago with the ask held roughly flat each time — persistent listings suggest the price (not the market) is what's stuck; bring a comps-based counter.
- Current owner paid $300k; 33% above their basis — modest negotiation headroom, anchor on the comps not their cost.
Risks & watch-outs
- Watch-outs: built in 1925 — expect roof / HVAC / electrical / plumbing capex.
Questions for the listing agent
- It's been on market 71 days. Have you received any prior offers? Is the seller open to a 19% concession, seller financing, or rate buy-down credit?
- Built in 1925 — when were the roof, HVAC, electrical panel, plumbing, and water heater last replaced?
- Why hasn't it sold? Are there any deal-killer items the seller is aware of (foundation, flood, title, zoning, code violations)?
- Is there a deadline driving the sale (1031 exchange, divorce, estate, relocation)? That informs how much negotiation room exists.
- Crime grade is F in this area — have there been break-ins, vandalism, or insurance claims at this property in the last 3 years? What carrier currently insures it and at what premium?
- What's the average days-on-market for RENTAL listings here right now (not sales)? A rising rental-DOM trend means longer vacancies and softer asking-rent achievability than the comps imply.
- What's the recent tenant-quality profile in this submarket — average credit score on applications, eviction rate, late-payment / NSF rate, and stable-employment percentage? A property-management company in the area should have these aggregated.
- How much new apartment / multifamily construction is in the pipeline within 1–3 miles? Heavy new supply (>2% of stock underway) typically softens rents 12–24 months out; light construction supports rent growth.
Investment metrics
- 1% rule
- 0.81% ✗
- Cap rate
- 6.92%
- Cash-on-cash
- 2.23%
- DSCR
- 1.10
- GRM
- 10.3
CMA / ARV
- ARV (median comp)
- $662,283
- List price
- $400,000
- Delta
- -39.60%
- Verdict
- UNDERPRICED
- Comps
- 20 within 1.0 mi
Show comp detail 12 sales within ~0.75 mi
| Address | Dist | Beds/Ba | Sqft | Sold | Price | $/sf | Match |
|---|---|---|---|---|---|---|---|
| 131 Tacoma Ave | 0.16mi | 6/2.0 | 2,808 (+8%) | 3mo | $330,000 | $118 | 77 |
| 24 Lovering Ave | 0.32mi | 6/2.0 | 2,716 (+4%) | 4mo | $340,000 | $125 | 74 |
| 190 Commonwealth Ave | 0.40mi | 6/2.0 | 2,672 (+2%) | 4mo | $310,000 | $116 | 74 |
| 1164 Hertel Ave | 0.25mi | 5/3.0 (-1) | 2,702 (+4%) | 2mo | $420,000 | $155 | 72 |
| 292 Hartwell Rd | 0.34mi | 6/2.0 | 2,446 (-6%) | 7mo | $355,000 | $145 | 68 |
| 246 Crestwood Ave | 0.49mi | 6/3.0 | 2,665 (+2%) | 7mo | $430,000 | $161 | 64 |
| 12 Lovering Ave | 0.33mi | 6/2.0 | 2,876 (+10%) | 5mo | $294,000 | $102 | 64 |
| 310 Colvin Ave | 0.53mi | 6/2.0 | 2,829 (+9%) | 0mo | $367,000 | $130 | 61 |
| 84 W Hazeltine Ave | 0.70mi | 6/2.0 | 2,736 (+5%) | 6mo | $245,522 | $90 | 54 |
| 43 Sunset St | 0.72mi | 6/2.0 | 2,271 (-13%) | 1mo | $165,000 | $73 | 44 |
| 903 Amherst St | 0.63mi | 5/3.0 (-1) | 2,851 (+9%) | 5mo | $300,000 | $105 | 42 |
| 263 Chandler St | 0.75mi | 5/2.0 (-1) | 2,254 (-14%) | 2mo | $195,000 | $87 | 36 |
Match score weights: distance 35% · size 25% · config 20% · recency 20%. Top-matched comps best support the ARV.
Projected returns pro-forma
-3.0% appreciation · 3.65% rent growth · sell at horizon
- IRR
- -12.2%
- Equity multiple
- 0.56×
- Total profit
- $-49,675
- Equity at exit
- $59,641
- IRR
- -2.4%
- Equity multiple
- 0.84×
- Total profit
- $-18,241
- Equity at exit
- $34,585
Cash invested: $112,000 (down + closing). Projections, not guarantees.
Landlord ↔ Tenant lean methodology
- Overall (STATE)
- 15 Strongly Tenant-Friendly
- State New York
- 15 Strongly Tenant-Friendly · D+10
- County
- — inherits STATE
- City
- — inherits STATE
ZIP-level market 14216
- Rents YoY
- 3.6%
- Active inventory
- 88
- Price-to-rent
- 20.6×
Monthly cashflow live
- Estimated rent
- $3,229 high interval (Pro) →
- Mortgage (P&I)
- −$2,098
- Tax from tax record
- −$79 /mo · $947/yr
- Insurance
- −$167
- HOA
- −$0
- Vacancy / Maint / Mgmt
- −$678
- Net cashflow
- $208
Break-even live
2-unit breakdown (identical units grouped — click to expand)
| Units | Beds | Baths | Est. rent |
|---|---|---|---|
| 2× units | 3 | 1.5 | $3,230 |
| #1 | 3 | 1.5 | $1,615 |
| #2 | 3 | 1.5 | $1,615 |
| Total (2 units) | $3,229 | ||
UW: 25.0% down · 7.5% · 30yr · 1.5% tax · 5.0% vac · 8.0% maint · 8.0% mgmt
Financing live
Cash to close
- Down payment
- $100,000
- Closing costs
- $12,000
- Reserves months
- —
- Total cash needed
- —
Loan-product check · same deal, 3 products live
Conventional
25% down · 7.5% · 30yr
- Down + closing
- —
- Monthly P&I
- —
- Monthly cashflow
- —
- DSCR
- —
- Eligible?
- —
Personal DTI + credit; lowest rate.
DSCR
20% down · 8.5% · 30yr
- Down + closing
- —
- Monthly P&I
- —
- Monthly cashflow
- —
- DSCR
- —
- Eligible?
- —
No personal income docs; deal must DSCR.
Hard money
10% down · 12.0% · 12mo
- Down + closing
- —
- Monthly P&I
- —
- Monthly cashflow
- —
- DSCR
- —
- Eligible?
- —
Short-term bridge; refi at stabilization.
Listing history 8 events
-
2026-03-19$400,000 Active 956-char remark
Show marketing remark (956 chars)
Wonderful, traditional North Buffalo double on a great, fenced yard. The exterior is low-maintenance vinyl. This 3/3 double is a money maker at closing. Both units are tenant-occupied, and tenants would like to stay!. Updates include: The garage overhead door system includes a screen door on the track for your convenience and outdoor enjoyment. Lower has an updated kitchen with a Stainless farm sink, no step ceramic tile shower a Culligan water system, Generac generator, gutter guards, modern mechanics, furnaces 2016 and 2018, hot water tanks 2015, Maintenance free siding, replacement windows, insulation, newer front entry door with sidelights, storm door, vented glass block basement windows, concrete driveway, enclosed lower back porch. The upstairs unit offers the same beautiful details plus a front and rear porch, charming original kitchen and moderately updated Bathfitter bath. 24 hours notice for all showings, showings start immediately.
-
2023-02-24historical
-
2023-02-01$350,000 Active
-
2021-10-05soldstatus $300,000
-
2021-09-20soldstatus $300,000 Closed Sale or Rented
-
2021-07-27status Pending Sale
-
2021-07-16status Under Contract- Do Not Show
-
2021-07-09$279,900 Active
ⓘ Source: listings_history table (triggers on properties + properties_extension) + one-shot
backfill from property_details.listing_events for pre-trigger history.
Tax reassessment forecast NY · Partial reset (capped growth)
- Current annual tax
- $947 · $79/mo
- Projected year-2 tax
- $3,854 · $321/mo
- Expected delta
- +$2,906/yr (+$242/mo · 306.9%)
ⓘ Screening estimate from a state-policy table — verify with the county assessor before closing.
Climate risk First Street
- Flood 1/10 Low FEMA zone X (unshaded) · 0% chance over 30 yrs
- Wildfire 1/10 Low
- Heat 3/10 Moderate 7 d/yr ≥92°F today · 15 d/yr by 30 yrs out
- Wind 1/10 Low
- Air quality 4/10 Moderate 4 unhealthy d/yr today · 9 by 30 yrs out
Nearby sold comps map
Loading sold comps map…
Walkable amenities ~0.75 mi
Loading nearby amenities…
Taxation est. · year 1
- Rental income
- $38,748
- − Mortgage interest
- −$22,406
- − Property taxes
- −$947
- − Insurance
- −$2,000
- − Repairs & maintenance
- −$3,100
- − Management
- −$3,100
- − Depreciation
- −$11,636
- Taxable loss
- −$4,441
- Est. tax savings @ 24.0%
- +$1,066
- After-tax cash flow
- $3,558/yr
For passive investors: Depreciation is non-cash, so a rental often shows a tax loss while cash-flowing — sheltering income. Rental losses are passive: they offset passive income freely, and up to $25,000/yr can offset ordinary (W-2) income if you actively participate and your MAGI is under $100k (phasing out to $0 by $150k); unused losses carry forward. On sale, claimed depreciation is recaptured at up to 25%, and gains may owe capital-gains tax (a 1031 exchange can defer both). Figures are a year-1 estimate at your 24.0% rate — not tax advice; consult a CPA.
Schools (NCES district)
- District
- Buffalo City School District
- NCES district ID
- 3605850
- Math proficiency
- 41% ▲ 11.00%
- Reading proficiency
- 40% ▲ 7.00%
- Median HH income
- $31,665
- Composite
- 33.17/100
- National rank
- #5544
- State rank
- #535 of 590 in NY
Livability — Buffalo
- Score
- 77/100
- State rank
- #195
- US rank
- #3011
Category grades
Schools grade is shown separately in the Schools card above.
Census & demographics
- Census place
- Buffalo, NY
- County
- Erie County · 714,559 people
- City population
- 440,021
- Metro
- Buffalo-Cheektowaga, NY
- Population (ZIP)
- 22,849
- Household income
- $69,629
- Rent vs Own
- Severe rent burden
- 1831.0
Population outlook (Erie County) Hauer SSP2
- Today (2025)
- 933,037 people
- By 2030
- 935,181 · +0.2%
- By 2040
- 928,531 · -0.5%
- By 2050
- 905,725 · -2.9%
- By 2075
- 834,037 · -10.6%
- By 2100
- 708,033 · -24.1%
Race, ethnicity, and origin ACS 2023
- Neighborhood character
- Predominantly White (72%)
- Race & ethnicity
- White 72% Black 16% Hispanic / Latino 7% Two or more races 5% Asian 1%
- Hispanic origin (detail)
- Puerto Rican 5%
- Common ancestry
- Romanian 10% Iranian 2% Lithuanian 1%
- Foreign-born
- 5% · Canada, China
- Languages at home
- 90% English-only · Spanish 5% French/Haitian/Cajun 1% Other Indo-European 1%
Political lean MEDSL · Erie
- 2024 margin
- Lean D (+9.7) · D 54.8% · R 45.2%
- 2008→2024 swing
- -7.9pp toward R · 2008: 17.5pp · 2024: 9.7pp
- All cycles
- 2024: D+9.7 2020: D+14.7 2016: D+4.8 2012: D+15.6 2008: D+17.5
Not yet ingested
- Civics
- —
Market trends
- HPI YoY
- ▼ -264.53%
- Current HPI
- 421.1138
- Rent YoY
- ▲ 3.65%
- Metro
- Buffalo-Cheektowaga, NY
- State GDP YoY
- ▲ 2.60%
- F500 in state
- 92
Industry mix (Fortune 500 HQ in NY)
| Industry | F500 HQs | Revenue |
|---|---|---|
| Financial Services | 10 | $950B |
|
||
| Consumer Goods | 9 | $162B |
|
||
| Insurance | 4 | $225B |
|
||
| Telecommunications | 2 | $144B |
|
||
| Pharmaceuticals | 2 | $112B |
|
||
| Media / Entertainment | 2 | $69B |
|
||
Price history
+42.9% since first listed8 events — show timeline
- 2026-03-19 Listed $400,000 WNYREIS
- 2023-02-24 Listing Removed — WNYREIS
- 2023-02-01 Listed $350,000 WNYREIS
- 2021-10-05 Sold (Public Records) $300,000 Public Records
- 2021-09-20 Sold (MLS) $300,000 WNYREIS
- 2021-07-27 Pending — WNYREIS
- 2021-07-16 Pending — WNYREIS
- 2021-07-09 Listed $279,900 WNYREIS
Property tax history
+4.6%/yrLatest (2025): $947 · +0.0% YoY. Source: county tax records.
Cash-flow waterfall
monthlySold comps — $/sqft
last 12 mo · ≤1 miLoading sold comps…