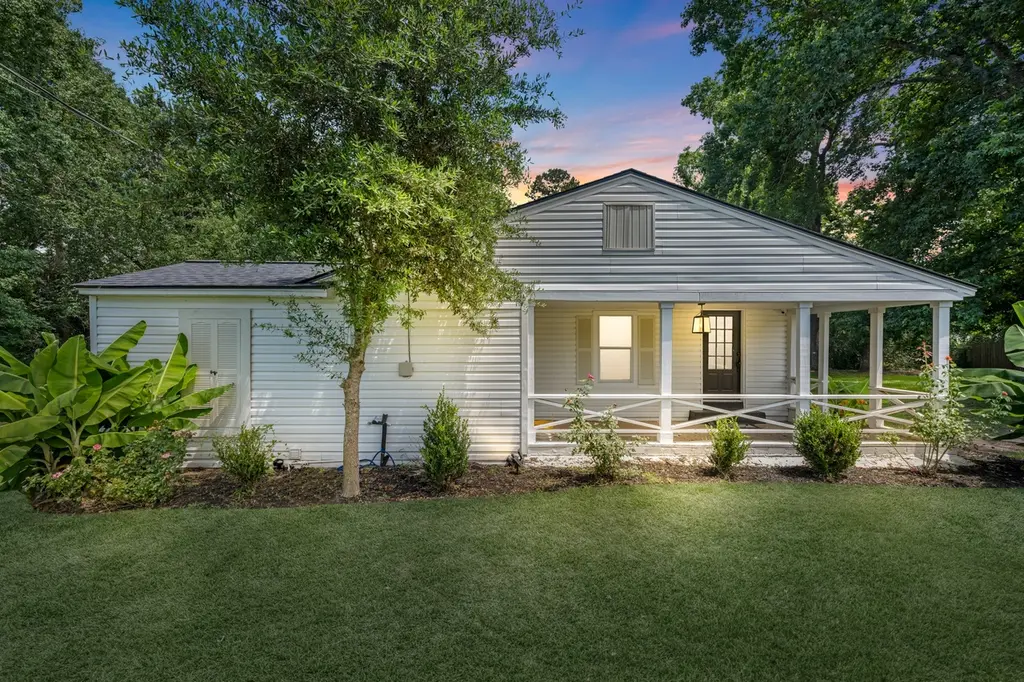
215 Bar Park Loop · Coldspring, TX
Flood risk 1/10 · Minimal
- FEMA flood zone
- X (unshaded)
- Chance of flooding over 30 yrs
- 0.0%
- Est. flood insurance / yr
- $507 – $1,088
Fire risk 4/10 · Minor
- Est. fire insurance / yr
- $1,222 – $2,270
Heat risk 8/10 · Major
- Hot days now (above 111°F)
- 7 days/yr
- Hot days in 30 yrs
- 24 days/yr
Wind risk 8/10 · Major
- Chance of severe wind over 30 yrs
- 99.0%
Air-quality risk 1/10 · Minimal
- Unhealthy air days now
- 0 days/yr
- Unhealthy air days in 30 yrs
- 0 days/yr
Risk factors via First Street. Map © Google.
Why this score? — see what drove the B grade
The composite is a weighted blend of 9 inputs, each scored 0–100. Each bar is that input's sub-score; the figure is the points it added to the 100-point composite (weight × sub-score).
- Cash flow +30.0/30.0
- ARV discount +15.0/15.0
- DSCR +10.0/10.0
- 1% rule +8.9/10.0
- Livability +2.8/5.0
- Rent growth +2.5/5.0
- Condition / age +2.5/5.0
- Schools +2.0/10.0
- Appreciation +0.0/10.0
$169,000
🖨 Deal sheet 📄 Offer letter ✓ Due diligence
Listing remarks MLS
This charming, fully renovated home is located in the heart of Coldspring. Prepare family dinners in the updated kitchen with quartz countertops, breakfast bar, new backsplash and stainless steel appliances. The dining area adjoins the kitchen and flows through to the spacious living area with refinished wood floors. With three bedrooms plus a home office and laundry area/storage room, there is plenty of room for the whole family. Lots of upgrades such as windows replaced, new air conditioner, bathroom remodeled etc. Enjoy your morning coffee on the covered front porch or the additional covered porch off the living area. Situated on four lots, the home sits on almost an acre giving you plenty of outdoor space and some privacy from neighbors. Located close to the County Fairgrounds, you are a short convenient drive to Downtown Coldspring for restaurants, shopping, schools etc.
Key facts
- Quartz countertops
- Updated kitchen
- Open kitchen
Tags
Property features AI
Finance
- Financial info: Lease not considered
Exterior
- Parking: Driveway
- Security: Smoke detectors
- Utilities: Public water; Aerobic septic system; Electric service available
- Home design: Residential property; One-story entry; Vinyl siding; Faces unspecified
- Construction: Built in 1990; Vinyl siding construction; Composition roof; Pillar/post/pier and slab foundation
- Exterior features: Covered patio; Patio; Porch; Deck; Private yard; Cleared and wooded lot; Asphalt road access
Interior
- Kitchen: Dishwasher; Gas oven; Gas range
- Bedrooms: Three bedrooms on the first floor; Office on the first floor; Living spaces on the first floor (living room, dining room)
- Flooring: Tile; Wood
- Bathrooms: 1 full bathroom
- Heating & cooling: Propane heating; Central electric air conditioning
- Interior features: Breakfast bar; Quartz counters; Tub with shower; Ceiling fans; Kitchen/dining combo
- Laundry & utility: Washer hookup; Electric dryer hookup
Neighborhood map
What this means for you Summary
Snapshot
- This is a 3-bed/2.0-bath single-family listed at $169k.
Deal economics
- At list price, monthly cash flow is $670 ($8k/yr) — positive.
- The deal already cash-flows at list — no discount required.
- Meets the 1% rule at list price ($2k rent vs $169k).
- Cap rate 11.0% vs local median 4.3% in Coldspring — top-decile yield for the area; either an underpriced asset or a hidden risk that comps aren't pricing in. Stress-test before assuming the spread holds.
Location & tenants
- Location reads 55/100 on livability (#1,357 in TX) — a working-class tenant base; expect higher turnover. Strengths: cost of living A+, housing A+; Watch: crime D, amenities F, commute F.
- Coldspring-Oakhurst CISD (rural): math 18% / reading 28% proficiency, ranked #732 of 826 in TX (top 89%) — low school quality limits family demand, transient renter base, plan for 1-2y turnover; 60% free/reduced lunch — lower-income household profile, screen leases tightly.
- Zoned schools: Coldspring-Oakhurst H S (math 27% / reading 37%, grade F, #1,044 of 1,632 statewide, top 66%, 496 students, 55% FRL).
- Market conditions: 362 active listings in the ZIP; 1 comparable units currently listed for rent nearby; 575 units permitted in San Jacinto County in 2024 (0 in 5+ unit buildings).
Forward outlook
- Local home prices are declining (-3.0%/yr); year-one equity from $1k of loan paydown is wiped out by about $5k of value loss. Plan a longer hold.
- San Jacinto County population projected at +7% by 2050 — modest demand growth; plan on rents tracking national, not racing it.
- At projected returns (-3.0% appreciation + 3.0% rent growth), your $47k cash investment doubles in ~8 years — after that, you're playing with house money.
Negotiation context
- Only 11 days on market — expect competitive offers; lowballing is unlikely to land.
- 2 sale attempts since 4y ago with the ask held roughly flat each time — persistent listings suggest the price (not the market) is what's stuck; bring a comps-based counter.
Risks & watch-outs
- Climate carrying-cost: severe wind risk, 99% chance of damaging wind over 30y; extreme-heat days projected 7→24/yr by 2055 (HVAC capex compounding) — expect insurance premiums to compound above CPI over the hold.
Questions for the listing agent
- Is there a deadline driving the sale (1031 exchange, divorce, estate, relocation)? That informs how much negotiation room exists.
- Schools are F-rated, which usually means shorter tenancies and higher turnover. Who's the typical renter profile here, and what's been the actual vacancy rate?
- Crime grade is D in this area — have there been break-ins, vandalism, or insurance claims at this property in the last 3 years? What carrier currently insures it and at what premium?
- What's the average days-on-market for RENTAL listings here right now (not sales)? A rising rental-DOM trend means longer vacancies and softer asking-rent achievability than the comps imply.
- What's the recent tenant-quality profile in this submarket — average credit score on applications, eviction rate, late-payment / NSF rate, and stable-employment percentage? A property-management company in the area should have these aggregated.
- How much new for-sale + rental construction is in the pipeline within 1–3 miles? Heavy new supply typically softens prices + rents 12–24 months out; constrained supply supports both.
Investment metrics
- 1% rule
- 1.39% ✓
- Cap rate
- 11.05%
- Cash-on-cash
- 16.98%
- DSCR
- 1.76
- GRM
- 6.0
CMA / ARV
- ARV (on-the-fly)
- $272,160
- Comps found
- 5
Show comp detail 5 sales within ~0.75 mi
| Address | Dist | Beds/Ba | Sqft | Sold | Price | $/sf | Match |
|---|---|---|---|---|---|---|---|
| 190 Faulkner Ave | 0.30mi | 3/2.0 | 1,521 (-10%) | 1mo | $299,000 | $197 | 69 |
| 340 Slade St | 0.40mi | 3/2.0 | 1,604 (-4%) | 13mo | $255,000 | $159 | 63 |
| 40 Faulkner Ave | 0.40mi | 3/2.0 | 1,582 (-6%) | 11mo | $325,000 | $205 | 63 |
| 240 Bar Park Loop | 0.05mi | 4/2.0 (+1) | 1,456 (-13%) | 14mo | $149,000 | $102 | 59 |
| 445 Faulkner Ave | 0.38mi | 3/2.0 | 1,449 (-14%) | 11mo | $235,000 | $162 | 50 |
Match score weights: distance 35% · size 25% · config 20% · recency 20%. Top-matched comps best support the ARV.
Projected returns pro-forma
-3.0% appreciation · 3.0% rent growth · sell at horizon
- IRR
- 8.2%
- Equity multiple
- 1.32×
- Total profit
- $15,304
- Equity at exit
- $25,198
- IRR
- 17.5%
- Equity multiple
- 2.45×
- Total profit
- $68,427
- Equity at exit
- $14,612
Cash invested: $47,320 (down + closing). Projections, not guarantees.
Landlord ↔ Tenant lean methodology
- Overall (STATE)
- 87 Strongly Landlord-Friendly
- State Texas
- 87 Strongly Landlord-Friendly · R+5
- County
- — inherits STATE
- City
- — inherits STATE
ZIP-level market 77331
- Active inventory
- 362
- Price-to-rent
- 6.0×
Monthly cashflow live
- Estimated rent
- $2,350 medium interval (Pro) →
- Mortgage (P&I)
- −$886
- Tax from tax record
- −$230 /mo · $2,764/yr
- Insurance
- −$70
- HOA
- −$0
- Vacancy / Maint / Mgmt
- −$494
- Net cashflow
- $670
Break-even live
UW: 25.0% down · 7.5% · 30yr · 1.5% tax · 5.0% vac · 8.0% maint · 8.0% mgmt
Financing live
Cash to close
- Down payment
- $42,250
- Closing costs
- $5,070
- Reserves months
- —
- Total cash needed
- —
Loan-product check · same deal, 3 products live
Conventional
25% down · 7.5% · 30yr
- Down + closing
- —
- Monthly P&I
- —
- Monthly cashflow
- —
- DSCR
- —
- Eligible?
- —
Personal DTI + credit; lowest rate.
DSCR
20% down · 8.5% · 30yr
- Down + closing
- —
- Monthly P&I
- —
- Monthly cashflow
- —
- DSCR
- —
- Eligible?
- —
No personal income docs; deal must DSCR.
Hard money
10% down · 12.0% · 12mo
- Down + closing
- —
- Monthly P&I
- —
- Monthly cashflow
- —
- DSCR
- —
- Eligible?
- —
Short-term bridge; refi at stabilization.
Rent comps 1 comps
| Address | Beds | Baths | Sqft | Rent | $/sqft | DOM | Units | Dist |
|---|---|---|---|---|---|---|---|---|
| 160 Vida Ln Coldspring, TX | 3.0 | 2.0 | 1538 | $2,350 | $1.53 | 19d | 1 | 1.38mi |
Listing history 10 events
-
2026-06-19days on market $169,000 Active 11 DOM
-
2026-06-18days on market $169,000 Active 10 DOM
-
2026-06-17days on market $169,000 Active 9 DOM
-
2026-06-16days on market $169,000 Active 8 DOM
-
2026-06-15days on market $169,000 Active 7 DOM
-
2026-06-14days on market $169,000 Active 5 DOM
-
2026-06-13days on market $169,000 Active 4 DOM
-
2026-06-10days on market $169,000 Active 2 DOM
-
2026-06-09remarks 593-char remark
-
2026-06-09$169,000 Active 1 DOM
ⓘ Source: listings_history table (triggers on properties + properties_extension) + one-shot
backfill from property_details.listing_events for pre-trigger history.
Tax reassessment forecast TX · Resets to sale price
- Current annual tax
- $2,764 · $230/mo
- Projected year-2 tax
- $3,093 · $258/mo
- Expected delta
- +$329/yr (+$27/mo · 11.9%)
ⓘ Screening estimate from a state-policy table — verify with the county assessor before closing.
Climate risk First Street
- Flood 1/10 Low FEMA zone X (unshaded) · 0% chance over 30 yrs
- Wildfire 4/10 Moderate
- Heat 8/10 Severe 7 d/yr ≥111°F today · 24 d/yr by 30 yrs out
- Wind 8/10 Severe 99% chance of damaging wind over 30 yrs
- Air quality 1/10 Low 0 unhealthy d/yr today · 0 by 30 yrs out
Nearby sold comps map
Loading sold comps map…
Walkable amenities ~0.75 mi
Loading nearby amenities…
Taxation est. · year 1
- Rental income
- $28,200
- − Mortgage interest
- −$9,467
- − Property taxes
- −$2,764
- − Insurance
- −$845
- − Repairs & maintenance
- −$2,256
- − Management
- −$2,256
- − Depreciation
- −$4,916
- Taxable income
- $5,696
- Est. tax owed @ 24.0%
- −$1,367
- After-tax cash flow
- $6,667/yr
For passive investors: Depreciation is non-cash, so a rental often shows a tax loss while cash-flowing — sheltering income. Rental losses are passive: they offset passive income freely, and up to $25,000/yr can offset ordinary (W-2) income if you actively participate and your MAGI is under $100k (phasing out to $0 by $150k); unused losses carry forward. On sale, claimed depreciation is recaptured at up to 25%, and gains may owe capital-gains tax (a 1031 exchange can defer both). Figures are a year-1 estimate at your 24.0% rate — not tax advice; consult a CPA.
Schools (NCES district)
- District
- Coldspring-Oakhurst CISD
- NCES district ID
- 4814520
- Math proficiency
- 18% ▼ -9.00%
- Reading proficiency
- 28% ▼ -2.00%
- Median HH income
- $46,916
- Composite
- 20.07/100
- National rank
- #8653
- State rank
- #732 of 826 in TX
Livability — Coldspring
- Score
- 55/100
- State rank
- #1357
- US rank
- #23364
Category grades
Schools grade is shown separately in the Schools card above.
Census & demographics
- Census place
- Coldspring, TX
- Population (ZIP)
- 7,348
Population outlook (San Jacinto County) Hauer SSP2
- Today (2025)
- 29,069 people
- By 2030
- 29,750 · +2.3%
- By 2040
- 30,714 · +5.7%
- By 2050
- 31,010 · +6.7%
- By 2075
- 31,616 · +8.8%
- By 2100
- 29,874 · +2.8%
Race, ethnicity, and origin ACS 2023
- Neighborhood character
- Predominantly White (78%)
- Race & ethnicity
- White 78% Black 13% Two or more races 8% Hispanic / Latino 4%
- Common ancestry
- Slovak 3% Italian 2% Romanian 2%
- Foreign-born
- 3% · Canada
- Languages at home
- 94% English-only · Spanish 5% Arabic 1%
Political lean MEDSL · San Jacinto
- 2024 margin
- Solid R (+65.3) · D 17.0% · R 82.3%
- 2008→2024 swing
- -27.0pp toward R · 2008: -38.3pp · 2024: -65.3pp
- All cycles
- 2024: R+65.3 2020: R+61.9 2016: R+58.4 2012: R+48.9 2008: R+38.3
Not yet ingested
- Civics
- —
Market trends
- HPI YoY
- ▼ -146.98%
- Current HPI
- 199.0493
- Rent YoY
- —
- Metro
- —
- State GDP YoY
- ▲ 3.95%
- F500 in state
- 110
Industry mix (Fortune 500 HQ in TX)
| Industry | F500 HQs | Revenue |
|---|---|---|
| Energy | 16 | $1,198B |
|
||
| Technology | 5 | $198B |
|
||
| Engineering / Construction | 4 | $72B |
|
||
| Energy Services | 3 | $60B |
|
||
| Utilities | 3 | $41B |
|
||
| Healthcare | 2 | $330B |
|
||
Price history
-19.5% since first listed9 events — show timeline
- 2026-06-08 Listed $169,000 HARMLS
- 2022-08-30 Sold (Public Records) — Public Records
- 2022-08-29 Sold (MLS) — HARMLS
- 2022-08-22 Pending — HARMLS
- 2022-08-21 Pending — HARMLS
- 2022-08-13 Pending — HARMLS
- 2022-07-29 Listed $210,000 HARMLS
- 2022-01-21 Sold (Public Records) — Public Records
- 2004-10-29 Sold (Public Records) — Public Records
Property tax history
+6.7%/yrLatest (2025): $2,764 · +0.5% YoY. Source: county tax records.
Cash-flow waterfall
monthlySold comps — $/sqft
last 12 mo · ≤1 miLoading sold comps…