 🏗️ New Construction
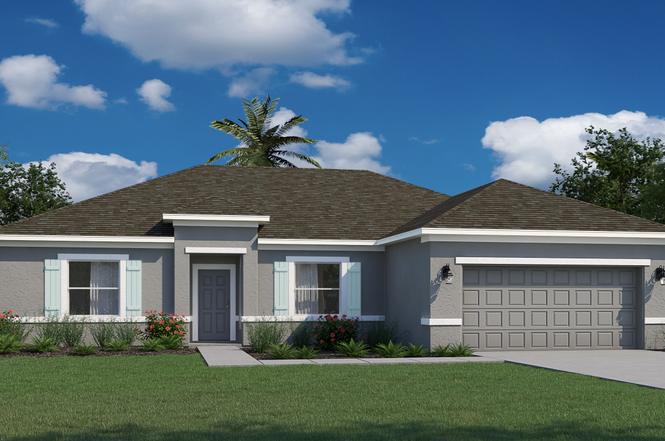
Siesta Plan · Sebastian, FL
Flood risk 1/10 · Minimal
- FEMA flood zone
- X (unshaded)
- Chance of flooding over 30 yrs
- 0.0%
- Est. flood insurance / yr
- $507 – $1,088
Fire risk 1/10 · Minimal
- Est. fire insurance / yr
- $947 – $1,759
Heat risk 10/10 · Severe
- Hot days now (above 106°F)
- 7 days/yr
- Hot days in 30 yrs
- 23 days/yr
Wind risk 10/10 · Severe
- Chance of severe wind over 30 yrs
- 99.0%
Air-quality risk 1/10 · Minimal
- Unhealthy air days now
- 0 days/yr
- Unhealthy air days in 30 yrs
- 0 days/yr
Risk factors via First Street. Map © Google.
Why this score? — see what drove the F grade
The composite is a weighted blend of 9 inputs, each scored 0–100. Each bar is that input's sub-score; the figure is the points it added to the 100-point composite (weight × sub-score).
- ARV discount +7.5/15.0
- Cash flow +7.3/30.0
- Schools +4.2/10.0
- Rent growth +4.1/5.0
- Livability +4.0/5.0
- Condition / age +2.5/5.0
- 1% rule +2.1/10.0
- DSCR +1.5/10.0
- Appreciation +0.0/10.0
$320,990
🖨 Deal sheet 📄 Offer letter ✓ Due diligence
Key facts
- Private dining room
- Versatile den
- Kitchen pantry
Tags
Property features AI
Finance
- Financial info: List price $320,990
Exterior
- Parking: 2 total parking spaces; 2-car garage
- Home design: Plan named Siesta; New construction plan
- Exterior features: Living area of 1,864
Interior
- Bedrooms: 4 bedrooms
- Bathrooms: 2 full bathrooms
Neighborhood map
What this means for you Summary
Snapshot
- This is a 4-bed/2.0-bath single-family listed at $321k.
Deal economics
- At list price, monthly cash flow is $-514 ($-6k/yr) — negative.
- To cash-flow at today's rent, offer at most $311k (3.0% below list).
- To meet the 1% rule (rent ≥ 1% of price), the offer needs to be $272k (15.1% below list).
- Recommended offer: $272k (15.1% below list) — sets the bar for 1% rule.
Location & tenants
- Location reads 81/100 on livability (#89 in FL, #1,421 nationally) — a professional / high-income tenant draw. Strengths: housing A+, crime A, health & safety A; Watch: schools D+, amenities D-.
- Indian River (other): math 48% / reading 52% proficiency, ranked #35 of 73 in FL (top 48%) — acceptable for families but not a draw, mixed tenant base, ~2y average lease.
- Market conditions: Rents rising fast (+6.2%/yr); 412 active listings in the ZIP; 16 comparable units currently listed for rent nearby; rentals leasing fast (median 13d on market — plan ~1-2 weeks tenant-placement turnaround); 564 units permitted in Indian River County in 2024 (281 in 5+ unit buildings).
- At $2,725/mo this rent would consume 49% of the median local household income ($67k/yr) (locally 646% of renters already pay >50% of income on rent) — very limited rent-growth headroom before tenants either downsize or default.
Forward outlook
- Local home prices are declining (-3.0%/yr); year-one equity from $3k of loan paydown is wiped out by about $12k of value loss. Plan a longer hold.
- Indian River County population projected at +18% by 2050 — long-run rental-demand tailwind backs the buy-and-hold thesis.
Negotiation context
- It's been on market 310 days — a 12% lower offer ($282k) is reasonable based on typical stale-listing flexibility.
Risks & watch-outs
- Climate carrying-cost: severe wind risk, 99% chance of damaging wind over 30y; extreme-heat days projected 7→23/yr by 2055 (HVAC capex compounding) — expect insurance premiums to compound above CPI over the hold.
Questions for the listing agent
- What do current leases actually rent for vs. the listed asking? Can we see a recent rent roll and the last 12 months of T-12 income?
- It's been on market 310 days. Have you received any prior offers? Is the seller open to a 15% concession, seller financing, or rate buy-down credit?
- Why hasn't it sold? Are there any deal-killer items the seller is aware of (foundation, flood, title, zoning, code violations)?
- Is there a deadline driving the sale (1031 exchange, divorce, estate, relocation)? That informs how much negotiation room exists.
- Schools are D-rated, which usually means shorter tenancies and higher turnover. Who's the typical renter profile here, and what's been the actual vacancy rate?
- The area grade is low — what's the realistic commute time and amenity access for the typical tenant pool here? Any planned neighborhood developments (good or bad) we should know about?
- What's the average days-on-market for RENTAL listings here right now (not sales)? A rising rental-DOM trend means longer vacancies and softer asking-rent achievability than the comps imply.
- What's the recent tenant-quality profile in this submarket — average credit score on applications, eviction rate, late-payment / NSF rate, and stable-employment percentage? A property-management company in the area should have these aggregated.
- How much new for-sale + rental construction is in the pipeline within 1–3 miles? Heavy new supply typically softens prices + rents 12–24 months out; constrained supply supports both.
Investment metrics
- 1% rule
- 0.71% ✗
- Cap rate
- 4.69%
- Cash-on-cash
- -5.71%
- DSCR
- 0.75
- GRM
- 11.8
CMA / ARV
- ARV (on-the-fly)
- $385,848
- Comps found
- 12
Show comp detail 12 sales within ~0.75 mi
| Address | Dist | Beds/Ba | Sqft | Sold | Price | $/sf | Match |
|---|---|---|---|---|---|---|---|
| 1043 Landsdowne Dr | 0.27mi | 4/2.0 | 1,821 (-2%) | 1mo | $366,000 | $201 | 83 |
| 457 Candle Ave | 0.31mi | 4/2.0 | 1,828 (-2%) | 3mo | $370,000 | $202 | 80 |
| 422 Del Monte Rd Unit A&B | 0.56mi | 4/2.0 | 1,858 (-0%) | 0mo | $318,000 | $171 | 73 |
| 830 Cain St | 0.54mi | 3/2.0 (-1) | 1,800 (-3%) | 2mo | $320,000 | $178 | 63 |
| 432 Biscayne Ln | 0.54mi | 3/2.0 (-1) | 1,793 (-4%) | 2mo | $379,000 | $211 | 62 |
| 311 Seaside Ter | 0.63mi | 3/2.0 (-1) | 1,851 (-1%) | 4mo | $466,500 | $252 | 61 |
| 802 Lorca Ave | 0.74mi | 4/2.0 | 1,828 (-2%) | 3mo | $379,000 | $207 | 60 |
| 117 Harbor Point Dr | 0.41mi | 3/3.0 (-1) | 1,989 (+7%) | 2mo | $535,000 | $269 | 59 |
| 493 Quarry Ln | 0.40mi | 3/2.0 (-1) | 1,658 (-11%) | 0mo | $305,000 | $184 | 58 |
| 626 Braddock St | 0.63mi | 3/2.0 (-1) | 1,936 (+4%) | 3mo | $250,910 | $130 | 57 |
| 402 Watercrest St | 0.67mi | 3/2.0 (-1) | 1,711 (-8%) | 2mo | $410,000 | $240 | 48 |
| 352 Quarry Ln | 0.73mi | 3/2.0 (-1) | 1,659 (-11%) | 1mo | $350,000 | $211 | 42 |
Match score weights: distance 35% · size 25% · config 20% · recency 20%. Top-matched comps best support the ARV.
Projected returns pro-forma
-3.0% appreciation · 6.22% rent growth · sell at horizon
- IRR
- -22.6%
- Equity multiple
- 0.20×
- Total profit
- $-86,094
- Equity at exit
- $57,531
- IRR
- -10.3%
- Equity multiple
- 0.29×
- Total profit
- $-76,986
- Equity at exit
- $33,361
Cash invested: $108,037 (down + closing). Projections, not guarantees.
Landlord ↔ Tenant lean methodology
- Overall (STATE)
- 87 Strongly Landlord-Friendly
- State Florida
- 87 Strongly Landlord-Friendly · R+3
- County
- — inherits STATE
- City
- — inherits STATE
ZIP-level market 32958
- Home prices YoY
- -13.1%
- Rents YoY
- 6.2%
- Active inventory
- 412
- Price-to-rent
- 9.8×
Monthly cashflow live
- Estimated rent
- $2,725 high interval (Pro) →
- Mortgage (P&I)
- −$2,023
- Tax est. 1.5%
- −$482 /mo · $5,788/yr
- Insurance
- −$161
- HOA
- −$0
- Vacancy / Maint / Mgmt
- −$572
- Net cashflow
- $-514
Break-even live
UW: 25.0% down · 7.5% · 30yr · 1.5% tax · 5.0% vac · 8.0% maint · 8.0% mgmt
Financing live
Cash to close
- Down payment
- $96,462
- Closing costs
- $11,575
- Reserves months
- —
- Total cash needed
- —
Loan-product check · same deal, 3 products live
Conventional
25% down · 7.5% · 30yr
- Down + closing
- —
- Monthly P&I
- —
- Monthly cashflow
- —
- DSCR
- —
- Eligible?
- —
Personal DTI + credit; lowest rate.
DSCR
20% down · 8.5% · 30yr
- Down + closing
- —
- Monthly P&I
- —
- Monthly cashflow
- —
- DSCR
- —
- Eligible?
- —
No personal income docs; deal must DSCR.
Hard money
10% down · 12.0% · 12mo
- Down + closing
- —
- Monthly P&I
- —
- Monthly cashflow
- —
- DSCR
- —
- Eligible?
- —
Short-term bridge; refi at stabilization.
Rent comps 16 comps
| Address | Beds | Baths | Sqft | Rent | $/sqft | DOM | Units | Dist |
|---|---|---|---|---|---|---|---|---|
| 832 Carnation Dr Sebastian, FL | 3.0 | 2.0 | 1400 | $2,800 | $2.00 | 13d | 1 | 0.26mi |
| 486 Biscayne Ln Sebastian, FL | 4.0 | 2.0 | 1769 | $2,250 | $1.27 | 13d | 1 | 0.47mi |
| 324 Seaside Ter Sebastian, FL | 3.0 | 2.0 | 2322 | $2,200 | $0.95 | 13d | 1 | 0.61mi |
| 246 S Wimbrow Dr Sebastian, FL | 3.0 | 2.0 | 1364 | $3,000 | $2.20 | 13d | 1 | 0.63mi |
| 351 Del Monte Rd Unit B Sebastian, FL | 3.0 | 2.0 | 1416 | $1,900 | $1.34 | 13d | 1 | 0.63mi |
| 351 Del Monte Rd Unit B Sebastian, FL | 3.0 | 2.0 | 1416 | $1,900 | $1.34 | 20d | 1 | 0.63mi |
| 810 Jamaica Ave Sebastian, FL | 4.0 | 2.0 | 1851 | $3,000 | $1.62 | 13d | 1 | 0.77mi |
| 865 Beard Ave Sebastian, FL | 4.0 | 2.0 | 1934 | $3,600 | $1.86 | 20d | 1 | 0.80mi |
| 1110 Barber St Sebastian, FL | 3.0 | 2.0 | 1324 | $2,200 | $1.66 | 13d | 1 | 0.81mi |
| 462 Lloyd St Sebastian, FL | 3.0 | 2.0 | 1564 | $2,400 | $1.53 | 20d | 1 | 0.92mi |
| 406 Easy St Sebastian, FL | 4.0 | 2.0 | 1874 | $2,100 | $1.12 | 20d | 1 | 1.06mi |
| 1192 Croquet Ln Sebastian, FL | 4.0 | 2.0 | 2012 | $2,640 | $1.31 | 13d | 1 | 1.15mi |
| 1343 Shoreline Cir Sebastian, FL | 3.0 | 2.0 | 2222 | $4,000 | $1.80 | 20d | 1 | 1.20mi |
| 632 Bayfront Ter Sebastian, FL | 3.0 | 2.0 | 1885 | $2,350 | $1.25 | 13d | 1 | 1.22mi |
| 834 Dolores St Sebastian, FL | 3.0 | 1.0 | 1253 | $1,600 | $1.28 | 13d | 1 | 1.44mi |
| 422 Avocado Ave Sebastian, FL | 3.0 | 2.0 | 1698 | $3,900 | $2.30 | 20d | 1 | 1.45mi |
Listing history 12 events
-
2026-06-19days on market $320,990 Active 310 DOM
-
2026-06-18days on market $320,990 Active 309 DOM
-
2026-06-17days on market $320,990 Active 308 DOM
-
2026-06-16days on market $320,990 Active 307 DOM
-
2026-06-15days on market $320,990 Active 306 DOM
-
2026-06-14days on market $320,990 Active 304 DOM
-
2026-06-13days on market $320,990 Active 303 DOM
-
2026-06-10days on market $320,990 Active 301 DOM
-
2026-06-09days on market $320,990 Active 300 DOM
-
2026-06-08days on market $320,990 Active 299 DOM
-
2026-06-07days on market $320,990 Active 298 DOM
-
2026-06-05$320,990 Active 295 DOM
ⓘ Source: listings_history table (triggers on properties + properties_extension) + one-shot
backfill from property_details.listing_events for pre-trigger history.
Climate risk First Street
- Flood 1/10 Low FEMA zone X (unshaded) · 0% chance over 30 yrs
- Wildfire 1/10 Low
- Heat 10/10 Extreme 7 d/yr ≥106°F today · 23 d/yr by 30 yrs out
- Wind 10/10 Extreme 99% chance of damaging wind over 30 yrs
- Air quality 1/10 Low 0 unhealthy d/yr today · 0 by 30 yrs out
Nearby sold comps map
Loading sold comps map…
Walkable amenities ~0.75 mi
Loading nearby amenities…
Taxation est. · year 1
- Rental income
- $32,699
- − Mortgage interest
- −$21,613
- − Property taxes
- −$5,788
- − Insurance
- −$1,929
- − Repairs & maintenance
- −$2,616
- − Management
- −$2,616
- − Depreciation
- −$11,225
- Taxable loss
- −$13,088
- Est. tax savings @ 24.0%
- +$3,141
- After-tax cash flow
- $-3,025/yr
For passive investors: Depreciation is non-cash, so a rental often shows a tax loss while cash-flowing — sheltering income. Rental losses are passive: they offset passive income freely, and up to $25,000/yr can offset ordinary (W-2) income if you actively participate and your MAGI is under $100k (phasing out to $0 by $150k); unused losses carry forward. On sale, claimed depreciation is recaptured at up to 25%, and gains may owe capital-gains tax (a 1031 exchange can defer both). Figures are a year-1 estimate at your 24.0% rate — not tax advice; consult a CPA.
Schools (NCES district)
- District
- Indian River
- NCES district ID
- 1200930
- Math proficiency
- 48% ▼ -9.00%
- Reading proficiency
- 52% ▼ -3.00%
- Median HH income
- $46,597
- Composite
- 42.45/100
- National rank
- #3218
- State rank
- #35 of 73 in FL
Livability — Sebastian
- Score
- 81/100
- State rank
- #89
- US rank
- #1421
Category grades
Schools grade is shown separately in the Schools card above.
Census & demographics
- Census place
- Sebastian, FL
- County
- Indian River County · 143,738 people
- City population
- 30,023
- Metro
- Sebastian-Vero Beach, FL
- Population (ZIP)
- 30,023
- Household income
- $66,840
- Rent vs Own
- Severe rent burden
- 646.0
Population outlook (Indian River County) Hauer SSP2
- Today (2025)
- 165,104 people
- By 2030
- 172,869 · +4.7%
- By 2040
- 185,640 · +12.4%
- By 2050
- 194,465 · +17.8%
- By 2075
- 211,115 · +27.9%
- By 2100
- 211,781 · +28.3%
Race, ethnicity, and origin ACS 2023
- Neighborhood character
- Predominantly White (86%)
- Race & ethnicity
- White 86% Hispanic / Latino 9% Two or more races 7% Black 2% Asian 1%
- Hispanic origin (detail)
- Mexican 1% Puerto Rican 2% Cuban 3%
- Common ancestry
- Lithuanian 4% Slovak 4% Romanian 3%
- Foreign-born
- 7% · Canada, Jamaica
- Languages at home
- 91% English-only · Spanish 6% Other Indo-European 1% Russian/Polish/Slavic 1%
Political lean MEDSL · Indian River
- 2024 margin
- Strong R (+27.4) · D 36.0% · R 63.4%
- 2008→2024 swing
- -12.5pp toward R · 2008: -14.8pp · 2024: -27.4pp
- All cycles
- 2024: R+27.4 2020: R+21.6 2016: R+24.5 2012: R+22.3 2008: R+14.8
Not yet ingested
- Civics
- —
Market trends
- HPI YoY
- ▼ -49.85%
- Current HPI
- 330.1691
- Rent YoY
- ▲ 6.22%
- Metro
- Sebastian-Vero Beach, FL
- State GDP YoY
- ▲ 3.28%
- F500 in state
- 36
Industry mix (Fortune 500 HQ in FL)
| Industry | F500 HQs | Revenue |
|---|---|---|
| Industrial Technology | 2 | $29B |
|
||
| Insurance | 2 | $17B |
|
||
| Retail | 1 | $60B |
|
||
| Technology Distribution | 1 | $58B |
|
||
| Homebuilding | 1 | $35B |
|
||
| Technology Manufacturing | 1 | $35B |
|
||
Cash-flow waterfall
monthlySold comps — $/sqft
last 12 mo · ≤1 miLoading sold comps…