465 Big Limestone Rd · Telford, TN
Flood risk 9/10 · Severe
- FEMA flood zone
- X (unshaded)
- Chance of flooding over 30 yrs
- 0.99%
- Est. flood insurance / yr
- $507 – $1,088
Fire risk 4/10 · Minor
- Est. fire insurance / yr
- $949 – $1,763
Heat risk 5/10 · Moderate
- Hot days now (above 100°F)
- 7 days/yr
- Hot days in 30 yrs
- 21 days/yr
Wind risk 2/10 · Minimal
- Chance of severe wind over 30 yrs
- —
Air-quality risk 2/10 · Minimal
- Unhealthy air days now
- 1 days/yr
- Unhealthy air days in 30 yrs
- 1 days/yr
Risk factors via First Street. Map © Google.
Why this score? — see what drove the C+ grade
The composite is a weighted blend of 9 inputs, each scored 0–100. Each bar is that input's sub-score; the figure is the points it added to the 100-point composite (weight × sub-score).
- Cash flow +23.2/30.0
- Appreciation +10.0/10.0
- DSCR +7.5/10.0
- ARV discount +7.5/15.0
- 1% rule +4.8/10.0
- Schools +2.6/10.0
- Rent growth +2.5/5.0
- Condition / age +2.5/5.0
- Livability +2.4/5.0
$160,000
🖨 Deal sheet 📄 Offer letter ✓ Due diligence
Listing remarks
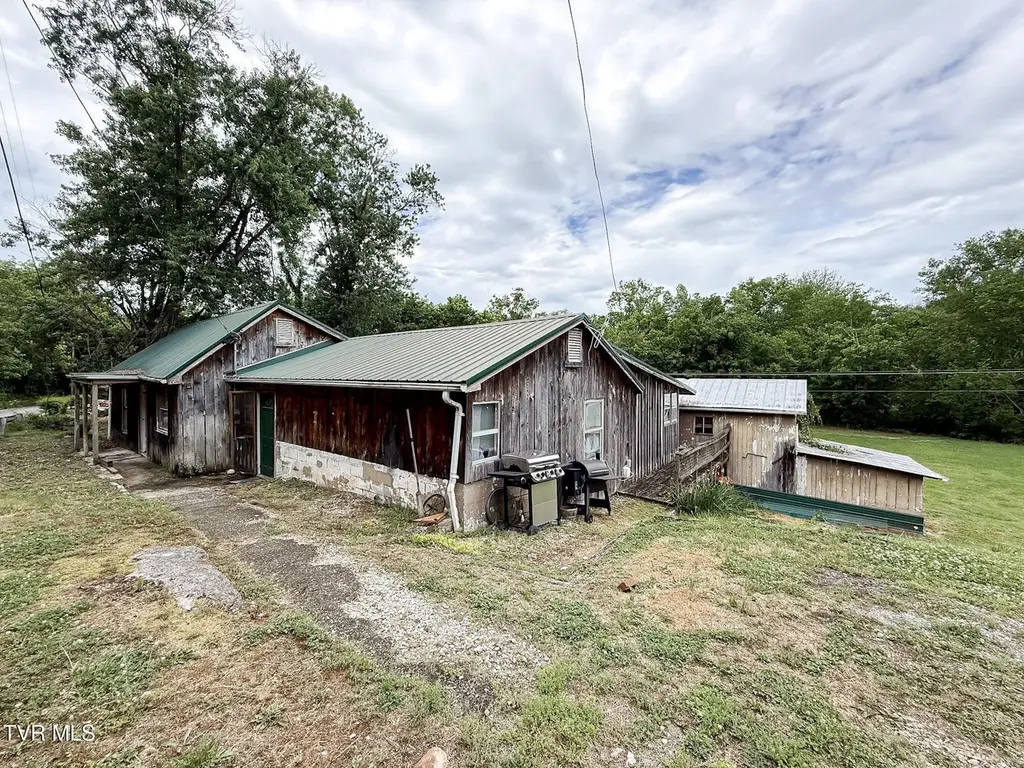
Whether you're an investor looking for your next rental or a homeowner dreaming of a creekside retreat to call your own, this one deserves a look. This 3bed/2bath, 1,518 sq ft farmhouse is being sold as-is and will need some TLC, but the reward is well worth the effort. Sitting right on a creek with two storage buildings and an aggressive price point, this is your chance to build sweat equity while creating the home or cash flow you've always wanted. Opportunities like this in the heart of East Tennessee don't come around often.
Key facts
- Creekside retreat
- Built 1900
- Listed 22 days
Tags
Property features AI
Exterior
- Utilities: Public water; Septic sewer
- Home design: Single-family house; One level; Property condition: Fixer
- Construction: Masonite and wood siding; Metal roof
- Exterior features: Deck; Outbuilding/shed/storage; Property has a view; Cleared, level topography
Interior
- Kitchen: Tile countertops
- Bedrooms: Total rooms: 6
- Flooring: Hardwood floors
- Bathrooms: 2 full bathrooms
- Heating & cooling: Central heating; Central air conditioning
- Interior features: Tile countertops; Two fireplaces
Neighborhood map
What this means for you Summary
Snapshot
- This is a 3-bed/1.0-bath single-family listed at $160k.
Deal economics
- At list price, monthly cash flow is $223 ($3k/yr) — positive.
- The deal already cash-flows at list — no discount required.
- To meet the 1% rule (rent ≥ 1% of price), the offer needs to be $157k (2.1% below list).
- Recommended offer: $157k (2.1% below list) — sets the bar for 1% rule.
- Cap rate 8.5% vs local median 2.7% in Telford — top-decile yield for the area; either an underpriced asset or a hidden risk that comps aren't pricing in. Stress-test before assuming the spread holds.
Location & tenants
- Location reads 47/100 on livability (#422 in TN) — a working-class tenant base; expect higher turnover. Strengths: cost of living A+, crime A; Watch: amenities F, commute F, employment F.
- Washington County (suburban): math 26% / reading 34% proficiency, ranked #54 of 139 in TN (top 39%) — families likely to look elsewhere, expect single-tenant / working-renter base with shorter leases.
- Zoned schools: West View School (math 11% / reading 23%, grade F, #709 of 952 statewide, top 77%, 311 students, 0% FRL); David Crockett High School (math 25% / reading 39%, grade F, #56 of 332 statewide, top 20%, 1,181 students, 0% FRL) — zoned schools average 0% FRL vs 41% district-wide (41 pts lower); this property's tenant base skews higher-income than the district average.
- Market conditions: 56 active listings in the ZIP; 3 comparable units currently listed for rent nearby; rentals at typical pace (median 21d on market — plan ~3-4 weeks tenant-placement turnaround); 1,155 units permitted in Washington County in 2024 (437 in 5+ unit buildings).
Forward outlook
- In year one you build about $17k of equity ($1k loan paydown + $16k appreciation (10.0% local appreciation)).
- Washington County population projected at +9% by 2050 — modest demand growth; plan on rents tracking national, not racing it.
- At projected returns (10.0% appreciation + 3.0% rent growth), your $45k cash investment doubles in ~3 years — after that, you're playing with house money.
- By year 3, paydown + projected appreciation supports a ~$43k cash-out refi (75% LTV) — recoverable capital for the next deal without selling this one.
Negotiation context
- It's been on market 23 days — a 2% lower offer ($158k) is reasonable based on typical stale-listing flexibility.
- Current owner paid $40k; list at $160k implies a 300% gain — meaningful room to come down on a strong offer.
Risks & watch-outs
- Watch-outs: flood insurance adds $66/mo; built in 1900 — expect roof / HVAC / electrical / plumbing capex.
- Climate carrying-cost: severe flood risk; extreme-heat days projected 7→21/yr by 2055 (HVAC capex compounding) — expect insurance premiums to compound above CPI over the hold.
Questions for the listing agent
- Built in 1900 — when were the roof, HVAC, electrical panel, plumbing, and water heater last replaced?
- What's the actual annual flood-insurance premium (NFIP or private), and is the property in a SFHA with mandatory coverage?
- Is there a deadline driving the sale (1031 exchange, divorce, estate, relocation)? That informs how much negotiation room exists.
- Schools are F-rated, which usually means shorter tenancies and higher turnover. Who's the typical renter profile here, and what's been the actual vacancy rate?
- What's the average days-on-market for RENTAL listings here right now (not sales)? A rising rental-DOM trend means longer vacancies and softer asking-rent achievability than the comps imply.
- What's the recent tenant-quality profile in this submarket — average credit score on applications, eviction rate, late-payment / NSF rate, and stable-employment percentage? A property-management company in the area should have these aggregated.
- How much new for-sale + rental construction is in the pipeline within 1–3 miles? Heavy new supply typically softens prices + rents 12–24 months out; constrained supply supports both.
Investment metrics
- 1% rule
- 0.98% ✗
- Cap rate
- 8.47%
- Cash-on-cash
- 7.76%
- DSCR
- 1.35
- GRM
- 8.5
CMA / ARV
No comps found within radius.
Projected returns pro-forma
10.0% appreciation · 3.0% rent growth · sell at horizon
- IRR
- 28.6%
- Equity multiple
- 3.26×
- Total profit
- $101,322
- Equity at exit
- $144,141
- IRR
- 24.9%
- Equity multiple
- 7.41×
- Total profit
- $287,135
- Equity at exit
- $310,845
Cash invested: $44,800 (down + closing). Projections, not guarantees.
Landlord ↔ Tenant lean methodology
- Overall (STATE)
- 87 Strongly Landlord-Friendly
- State Tennessee
- 87 Strongly Landlord-Friendly · R+13
- County
- — inherits STATE
- City
- — inherits STATE
ZIP-level market 37681
- Home prices YoY
- 4.7%
- Active inventory
- 56
- Price-to-rent
- 8.5×
Monthly cashflow live
- Estimated rent
- $1,567 medium interval (Pro) →
- Mortgage (P&I)
- −$839
- Tax from tax record
- −$42 /mo · $507/yr
- Insurance
- −$67
- Flood insurance flood zone
- −$66 /mo · $798/yr
- HOA
- −$0
- Vacancy / Maint / Mgmt
- −$329
- Net cashflow
- $223
Break-even live
UW: 25.0% down · 7.5% · 30yr · 1.5% tax · 5.0% vac · 8.0% maint · 8.0% mgmt
Financing live
Cash to close
- Down payment
- $40,000
- Closing costs
- $4,800
- Reserves months
- —
- Total cash needed
- —
Loan-product check · same deal, 3 products live
Conventional
25% down · 7.5% · 30yr
- Down + closing
- —
- Monthly P&I
- —
- Monthly cashflow
- —
- DSCR
- —
- Eligible?
- —
Personal DTI + credit; lowest rate.
DSCR
20% down · 8.5% · 30yr
- Down + closing
- —
- Monthly P&I
- —
- Monthly cashflow
- —
- DSCR
- —
- Eligible?
- —
No personal income docs; deal must DSCR.
Hard money
10% down · 12.0% · 12mo
- Down + closing
- —
- Monthly P&I
- —
- Monthly cashflow
- —
- DSCR
- —
- Eligible?
- —
Short-term bridge; refi at stabilization.
Rent comps 3 comps
| Address | Beds | Baths | Sqft | Rent | $/sqft | DOM | Units | Dist |
|---|---|---|---|---|---|---|---|---|
| 127 Adams and Corby Rd Unit 34 Limestone, TN | 2.0 | 1.5 | 1200 | $1,400 | $1.17 | 13d | 1 | 1.32mi |
| 127 Adams and Corby Rd Unit 24 Limestone, TN | 2.0 | 1.5 | 1077 | $1,450 | $1.35 | 21d | 1 | 1.40mi |
| 147 Price Rd Limestone, TN | 3.0 | 2.0 | 1472 | $1,800 | $1.22 | 21d | 1 | 1.43mi |
Listing history 21 events
-
2026-06-19days on market $160,000 Active 23 DOM
-
2026-06-18days on market $160,000 Active 22 DOM
-
2026-06-17days on market $160,000 Active 21 DOM
-
2026-06-16days on market $160,000 Active 20 DOM
-
2026-06-15days on market $160,000 Active 19 DOM
-
2026-06-14days on market $160,000 Active 17 DOM
-
2026-06-13pricedays on market $160,000 Active 16 DOM
-
2026-06-10days on market $165,000 Active 14 DOM
-
2026-06-09days on market $165,000 Active 13 DOM
-
2026-06-08days on market $165,000 Active 12 DOM
-
2026-06-07days on market $165,000 Active 11 DOM
-
2026-06-05days on market $165,000 Active 8 DOM
-
2026-06-02days on market $165,000 Active 6 DOM
-
2026-06-01days on market $165,000 Active 5 DOM
-
2026-05-31days on market $165,000 Active 4 DOM
-
2026-05-30days on market $165,000 Active 3 DOM
-
2026-05-27$165,000 Active
-
2010-09-07soldstatus $40,000
-
2005-11-21soldstatus $45,000
-
2004-11-03soldstatus $51,000
-
1997-06-16soldstatus $27,000
ⓘ Source: listings_history table (triggers on properties + properties_extension) + one-shot
backfill from property_details.listing_events for pre-trigger history.
Tax reassessment forecast TN · Resets to sale price
- Current annual tax
- $507 · $42/mo
- Projected year-2 tax
- $1,136 · $95/mo
- Expected delta
- +$629/yr (+$52/mo · 124.1%)
ⓘ Screening estimate from a state-policy table — verify with the county assessor before closing.
Climate risk First Street
- Flood 9/10 Extreme FEMA zone X (unshaded) · 99% chance over 30 yrs
- Wildfire 4/10 Moderate
- Heat 5/10 Major 7 d/yr ≥100°F today · 21 d/yr by 30 yrs out
- Wind 2/10 Low
- Air quality 2/10 Low 1 unhealthy d/yr today · 1 by 30 yrs out
Nearby sold comps map
Loading sold comps map…
Walkable amenities ~0.75 mi
Loading nearby amenities…
Taxation est. · year 1
- Rental income
- $18,799
- − Mortgage interest
- −$8,962
- − Property taxes
- −$507
- − Insurance
- −$1,598
- − Repairs & maintenance
- −$1,504
- − Management
- −$1,504
- − Depreciation
- −$4,655
- Taxable income
- $70
- Est. tax owed @ 24.0%
- −$17
- After-tax cash flow
- $2,661/yr
For passive investors: Depreciation is non-cash, so a rental often shows a tax loss while cash-flowing — sheltering income. Rental losses are passive: they offset passive income freely, and up to $25,000/yr can offset ordinary (W-2) income if you actively participate and your MAGI is under $100k (phasing out to $0 by $150k); unused losses carry forward. On sale, claimed depreciation is recaptured at up to 25%, and gains may owe capital-gains tax (a 1031 exchange can defer both). Figures are a year-1 estimate at your 24.0% rate — not tax advice; consult a CPA.
Schools (NCES district)
- District
- Washington County
- NCES district ID
- 4704380
- Math proficiency
- 26% ▼ -21.00%
- Reading proficiency
- 34% ▼ -11.00%
- Median HH income
- $46,542
- Composite
- 25.85/100
- National rank
- #7350
- State rank
- #54 of 139 in TN
Livability — Telford
- Score
- 47/100
- State rank
- #422
- US rank
- #26284
Category grades
Schools grade is shown separately in the Schools card above.
Census & demographics
- City population
- 4,720
- Population (ZIP)
- 6,031
Population outlook (Washington County) Hauer SSP2
- Today (2025)
- 132,816 people
- By 2030
- 135,823 · +2.3%
- By 2040
- 140,897 · +6.1%
- By 2050
- 145,073 · +9.2%
- By 2075
- 156,386 · +17.7%
- By 2100
- 159,893 · +20.4%
Race, ethnicity, and origin ACS 2023
- Neighborhood character
- Predominantly White (98%)
- Race & ethnicity
- White 98% Two or more races 2%
- Common ancestry
- Serbian 3% Slovak 2% Italian 2%
- Foreign-born
- 0%
- Languages at home
- 99% English-only · German/W. Germanic 1%
Political lean MEDSL · Washington
- 2024 margin
- Solid R (+39.5) · D 29.6% · R 69.1% · Other 1.3%
- 2008→2024 swing
- -6.0pp toward R · 2008: -33.5pp · 2024: -39.5pp
- All cycles
- 2024: R+39.5 2020: R+36.2 2016: R+42.9 2012: R+38.5 2008: R+33.5
Not yet ingested
- Civics
- —
Market trends
- HPI YoY
- ▲ 13.43%
- Current HPI
- 296.7409
- Rent YoY
- —
- Metro
- —
- State GDP YoY
- ▲ 2.78%
- F500 in state
- 22
Industry mix (Fortune 500 HQ in TN)
| Industry | F500 HQs | Revenue |
|---|---|---|
| Healthcare | 3 | $91B |
|
||
| Retail | 3 | $72B |
|
||
| Transportation / Logistics | 1 | $88B |
|
||
| Paper / Packaging | 1 | $19B |
|
||
| Insurance | 1 | $13B |
|
||
| Energy | 1 | $12B |
|
||
Price history
+511.1% since first listed5 events — show timeline
- 2026-05-27 Listed $165,000 TVRMLS
- 2010-09-07 Sold (Public Records) $40,000 Public Records
- 2005-11-21 Sold (Public Records) $45,000 Public Records
- 2004-11-03 Sold (Public Records) $51,000 Public Records
- 1997-06-16 Sold (Public Records) $27,000 Public Records
Property tax history
+5.1%/yrLatest (2025): $507 · +0.0% YoY. Source: county tax records.
Cash-flow waterfall
monthlySold comps — $/sqft
last 12 mo · ≤1 miLoading sold comps…