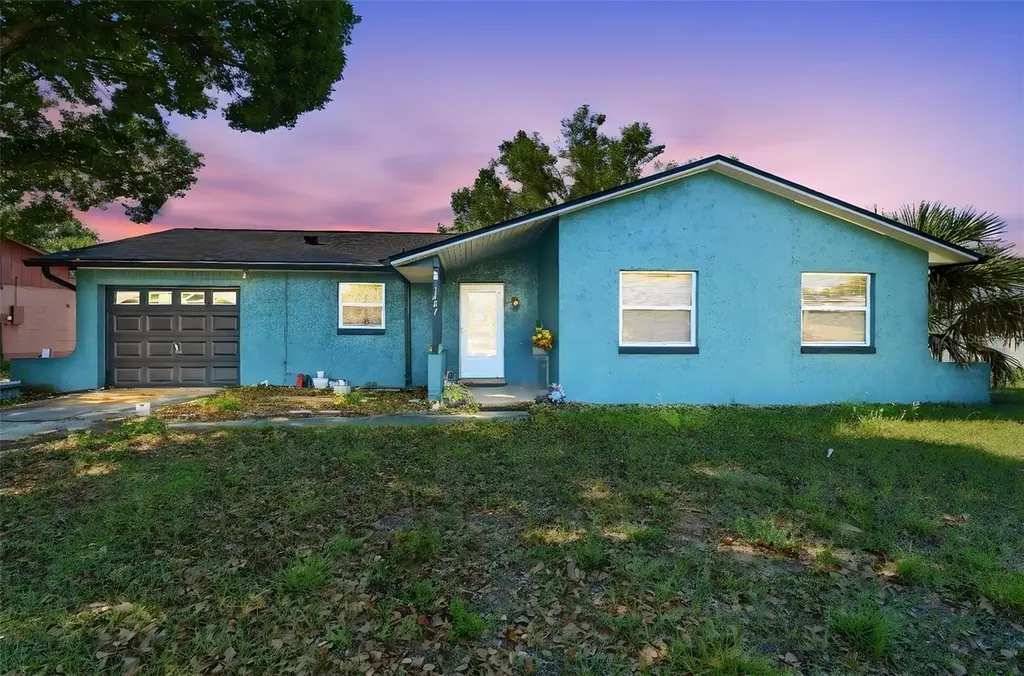
1407 Benwick Way · Casselberry, FL
Flood risk 1/10 · Minimal
- FEMA flood zone
- X (unshaded)
- Chance of flooding over 30 yrs
- 0.0%
- Est. flood insurance / yr
- $507 – $1,088
Fire risk 1/10 · Minimal
- Est. fire insurance / yr
- $947 – $1,759
Heat risk 9/10 · Severe
- Hot days now (above 108°F)
- 7 days/yr
- Hot days in 30 yrs
- 22 days/yr
Wind risk 9/10 · Severe
- Chance of severe wind over 30 yrs
- 99.0%
Air-quality risk 2/10 · Minimal
- Unhealthy air days now
- 1 days/yr
- Unhealthy air days in 30 yrs
- 2 days/yr
Risk factors via First Street. Map © Google.
Why this score? — see what drove the C grade
The composite is a weighted blend of 9 inputs, each scored 0–100. Each bar is that input's sub-score; the figure is the points it added to the 100-point composite (weight × sub-score).
- Cash flow +18.2/30.0
- ARV discount +15.0/15.0
- DSCR +5.7/10.0
- Schools +5.1/10.0
- 1% rule +3.8/10.0
- Livability +3.7/5.0
- Rent growth +3.0/5.0
- Condition / age +2.5/5.0
- Appreciation +0.0/10.0
$249,900
🖨 Deal sheet (PDF) 📄 Offer letter ✓ Due diligence
Listing remarks
HIGHEST AND BEST BY 5/7/26. INVESTOR SPECIAL with serious upside! This is a prime opportunity for investors, flippers, or buyers looking to create their dream home. This property requires a full interior clean-out and renovation, offering a blank slate to reimagine and maximize value. The major components have already been addressed, including a newer roof, AC, and water heater- giving you a strong head start on the renovation. With solid bones, a functional layout, and strong resale potential, this is an ideal project for a fix-and-flip, rental, or custom remodel. Located near shopping, dining, and major roadways, the location supports long-term value and desirability. Estimated ARV based
Key facts
- Newer ac
- Newer roof
- Newer water heater
Tags
Property features AI
Finance
- Other: Zoned R-9; Lot about 0.2 acre (approx. 0 to less than 1/4 acre); Paved road access
- Financial info: No lease restrictions; Tax information available (tax year 2025)
- HOA & community: No association (no HOA indicated)
Exterior
- Parking: Attached garage; 1-car garage
- Utilities: Public water; Public sewer; Electricity connected; Water connected
- Home design: Single family residence; One story; Faces northwest
- Construction: Block and stucco construction; Shingle roof; Slab foundation; Built with public-records listed living area of 1,256 sq ft and total building area of 1,636 sq ft
- Exterior features: Sidewalk; Paved lot
Interior
- Kitchen: Range; Microwave; Refrigerator; Dishwasher
- Bedrooms: 3 bedrooms
- Flooring: Ceramic tile; Linoleum
- Bathrooms: 2 full bathrooms
- Heating & cooling: Central heating; Central air conditioning
- Interior features: Other interior features
- Laundry & utility: Inside laundry; Washer; Dryer
Neighborhood map
What this means for you Summary
Snapshot
- This is a 3-bed/2.0-bath single-family listed at $250k.
Deal economics
- At list price, monthly cash flow is $224 ($3k/yr) — positive.
- The deal already cash-flows at list — no discount required.
- To meet the 1% rule (rent ≥ 1% of price), the offer needs to be $219k (12.5% below list).
- Recommended offer: $219k (12.5% below list) — sets the bar for 1% rule.
- Cap rate 7.4% vs local median 4.1% in Casselberry — top-decile yield for the area; either an underpriced asset or a hidden risk that comps aren't pricing in. Stress-test before assuming the spread holds.
Location & tenants
- Location reads 73/100 on livability (#314 in FL) — a middle-class / working-renter tenant base. Strengths: cost of living A+, housing A+, health & safety A-; Watch: crime C-, employment C-, amenities F.
- Seminole (suburban): math 57% / reading 61% proficiency, ranked #13 of 73 in FL (top 18%) — acceptable for families but not a draw, mixed tenant base, ~2y average lease.
- Zoned schools: Casselberry Elementary School (math 68% / reading 65%, grade B+, #473 of 2,144 statewide, top 23%, 766 students, 70% FRL); Winter Springs High School (math 43% / reading 55%, grade D, #193 of 667 statewide, top 29%, 2,038 students, 47% FRL) — zoned schools average 59% FRL vs 38% district-wide (20 pts higher); higher-poverty schools than district average — tighter screening recommended.
- Market conditions: Rents rising (+2.1%/yr); 189 active listings in the ZIP; 15 comparable units currently listed for rent nearby; rentals at typical pace (median 19d on market — plan ~3-4 weeks tenant-placement turnaround); 1,979 units permitted in Seminole County in 2024 (1,191 in 5+ unit buildings).
- This rent runs 38% of the median local income ($69k/yr) — at the standard rent-burdened threshold; future hikes will face affordability resistance.
Forward outlook
- Local home prices are declining (-3.0%/yr); year-one equity from $2k of loan paydown is wiped out by about $7k of value loss. Plan a longer hold.
- Seminole County population projected at +24% by 2050 — long-run rental-demand tailwind backs the buy-and-hold thesis.
Negotiation context
- Only 3 days on market — expect competitive offers; lowballing is unlikely to land.
- Current owner paid $61k; list at $250k implies a 310% gain — meaningful room to come down on a strong offer.
Risks & watch-outs
- Climate carrying-cost: severe wind risk, 99% chance of damaging wind over 30y; extreme-heat days projected 7→22/yr by 2055 (HVAC capex compounding) — expect insurance premiums to compound above CPI over the hold.
Questions for the listing agent
- Built in 1976 — when were the roof, HVAC, electrical panel, plumbing, and water heater last replaced?
- Is there a deadline driving the sale (1031 exchange, divorce, estate, relocation)? That informs how much negotiation room exists.
- Schools are B-rated — typically a magnet for longer-tenancy family renters. What's the average tenant stay here, and is there a school-zone premium baked into asking?
- What's the average days-on-market for RENTAL listings here right now (not sales)? A rising rental-DOM trend means longer vacancies and softer asking-rent achievability than the comps imply.
- What's the recent tenant-quality profile in this submarket — average credit score on applications, eviction rate, late-payment / NSF rate, and stable-employment percentage? A property-management company in the area should have these aggregated.
- How much new for-sale + rental construction is in the pipeline within 1–3 miles? Heavy new supply typically softens prices + rents 12–24 months out; constrained supply supports both.
Investment metrics
- 1% rule
- 0.88% ✗
- Cap rate
- 7.37%
- Cash-on-cash
- 3.84%
- DSCR
- 1.17
- GRM
- 9.5
CMA / ARV
- ARV (on-the-fly)
- $332,840
- Comps found
- 12
Show comp detail 12 sales within ~0.75 mi
| Address | Dist | Beds/Ba | Sqft | Sold | Price | $/sf | Match |
|---|---|---|---|---|---|---|---|
| 1407 Benwick Way | 0.00mi | 3/2.0 | 1,256 (0%) | 1mo | $260,000 | $207 | 99 |
| 1346 Quintuplet Dr | 0.42mi | 3/2.0 | 1,242 (-1%) | 2mo | $360,000 | $290 | 77 |
| 1370 Lancelot Way | 0.19mi | 3/2.0 | 1,310 (+4%) | 15mo | $355,000 | $271 | 72 |
| 344 Redwing Way | 0.36mi | 3/2.0 | 1,337 (+6%) | 7mo | $369,900 | $277 | 67 |
| 107 Thrush Ln | 0.45mi | 3/2.0 | 1,383 (+10%) | 2mo | $360,000 | $260 | 60 |
| 1210 Quintuplet Dr | 0.46mi | 3/2.0 | 1,170 (-7%) | 10mo | $310,000 | $265 | 59 |
| 1434 Lake Dr | 0.42mi | 3/2.0 | 1,080 (-14%) | 0mo | $230,000 | $213 | 57 |
| 611 Laurel Way | 0.54mi | 3/2.0 | 1,169 (-7%) | 9mo | $299,000 | $256 | 56 |
| 380 Brittany Cir | 0.56mi | 3/2.0 | 1,169 (-7%) | 8mo | $360,000 | $308 | 56 |
| 513 Woodfire Way | 0.74mi | 2/2.0 (-1) | 1,266 (+1%) | 8mo | $310,000 | $245 | 53 |
| 323 Shadow Oak Dr | 0.62mi | 3/2.0 | 1,400 (+12%) | 14mo | $420,000 | $300 | 40 |
| 365 Kingsley Dr | 0.57mi | 3/2.0 | 1,436 (+14%) | 13mo | $376,500 | $262 | 38 |
Match score weights: distance 35% · size 25% · config 20% · recency 20%. Top-matched comps best support the ARV.
Projected returns pro-forma
-3.0% appreciation · 2.09% rent growth · sell at horizon
- IRR
- -11.2%
- Equity multiple
- 0.60×
- Total profit
- $-28,317
- Equity at exit
- $37,261
- IRR
- -3.3%
- Equity multiple
- 0.79×
- Total profit
- $-14,707
- Equity at exit
- $21,607
Cash invested: $69,972 (down + closing). Projections, not guarantees.
Landlord ↔ Tenant lean methodology
- Overall (STATE)
- 87 Strongly Landlord-Friendly
- State Florida
- 87 Strongly Landlord-Friendly · R+3
- County
- — inherits STATE
- City
- — inherits STATE
ZIP-level market 32707
- Rents YoY
- 2.1%
- Active inventory
- 189
- Price-to-rent
- 9.5×
Monthly cashflow live
- Estimated rent
- $2,187 high interval (Pro) →
- Mortgage (P&I)
- −$1,311
- Tax from tax record
- −$89 /mo · $1,071/yr
- Insurance
- −$104
- HOA
- −$0
- Vacancy / Maint / Mgmt
- −$459
- Net cashflow
- $224
Break-even live
Sensitivity live
| Price | -10% $365 | -5% $295 | +0% $224 | +5% $153 | +10% $83 |
|---|---|---|---|---|---|
| Rent | -10% $51 | -5% $138 | +0% $224 | +5% $310 | +10% $397 |
| Rate | -1.0pp $350 | -0.5pp $288 | base $224 | +0.5pp $159 | +1.0pp $93 |
UW: 25.0% down · 7.5% · 30yr · 1.5% tax · 5.0% vac · 8.0% maint · 8.0% mgmt
Financing live
Cash to close
- Down payment
- $62,475
- Closing costs
- $7,497
- Reserves months
- —
- Total cash needed
- —
Loan-product check · same deal, 3 products live
Conventional
25% down · 7.5% · 30yr
- Down + closing
- —
- Monthly P&I
- —
- Monthly cashflow
- —
- DSCR
- —
- Eligible?
- —
Personal DTI + credit; lowest rate.
DSCR
20% down · 8.5% · 30yr
- Down + closing
- —
- Monthly P&I
- —
- Monthly cashflow
- —
- DSCR
- —
- Eligible?
- —
No personal income docs; deal must DSCR.
Hard money
10% down · 12.0% · 12mo
- Down + closing
- —
- Monthly P&I
- —
- Monthly cashflow
- —
- DSCR
- —
- Eligible?
- —
Short-term bridge; refi at stabilization.
Rent comps 15 comps
| Address | Beds | Baths | Sqft | Rent | $/sqft | DOM | Units | Dist |
|---|---|---|---|---|---|---|---|---|
| 617 E Helm Way Casselberry, FL | 3.0 | 1.0 | 1000 | $1,995 | $2.00 | 6d | 1 | 0.87mi |
| 512 El Dorado Way Casselberry, FL | 3.0 | 1.0 | 1094 | $1,895 | $1.73 | 6d | 1 | 1.06mi |
| 661 Murphy Rd Winter Springs, FL | 3.0 | 2.0 | 1320 | $2,200 | $1.67 | 25d | 1 | 1.06mi |
| 1131 Castle Wood Ter Casselberry, FL | 1.0–3.0 | 1.0–2.0 | 1003 | $1,571 | $1.57 | 6d | 1 | 1.07mi |
| 2982 Embassy Ct Casselberry, FL | 2.0 | 2.5 | 1238 | $1,895 | $1.53 | 3d | 1 | 1.22mi |
| 2982 Embassy Ct Casselberry, FL | 2.0 | 2.5 | 1238 | $1,895 | $1.53 | 19d | 1 | 1.22mi |
| 660 Jasmine Rd Casselberry, FL | 2.0 | 1.0 | 953 | $1,725 | $1.81 | 6d | 1 | 1.25mi |
| 986 Rollingwood Loop Casselberry, FL | 2.0 | 1.0–2.0 | 669 | $1,880 | $2.81 | 25d | 15 | 1.25mi |
| 1141 Exceller Ct #103 Casselberry, FL | 3.0 | 2.0 | 1151 | $1,800 | $1.56 | 25d | 1 | 1.27mi |
| 384 Coral Beach Cir Casselberry, FL | 3.0 | 2.5 | 1565 | $2,300 | $1.47 | 25d | 1 | 1.27mi |
| 1445 Bird Rd Winter Springs, FL | 3.0 | 2.0 | 1500 | $2,500 | $1.67 | 25d | 1 | 1.33mi |
| 102 Lago Vista Blvd Unit 1 Casselberry, FL | 3.0 | 3.0 | 1532 | $3,200 | $2.09 | 25d | 1 | 1.35mi |
| 541 Moccasin Ct Casselberry, FL | 2.0 | 2.0 | 1208 | $2,095 | $1.73 | 25d | 1 | 1.36mi |
| 1124 Shoreview Cir Casselberry, FL | 1.0–3.0 | 1.0–2.0 | 1068 | $2,784 | $2.61 | 3d | 23 | 1.44mi |
| 421 S Hawthorn Cir Winter Springs, FL | 3.0 | 2.0 | 1052 | $2,070 | $1.97 | 6d | 1 | 1.48mi |
Listing history 3 events
-
2026-05-08status Pending
-
2026-05-05$249,900 Active
-
1985-10-01soldstatus $61,000
ⓘ Source: listings_history table (triggers on properties + properties_extension) + one-shot
backfill from property_details.listing_events for pre-trigger history.
Tax reassessment forecast FL · Resets to sale price
- Current annual tax
- $1,071 · $89/mo
- Projected year-2 tax
- $2,074 · $173/mo
- Expected delta
- +$1,003/yr (+$84/mo · 93.6%)
ⓘ Screening estimate from a state-policy table — verify with the county assessor before closing.
Climate risk First Street
- Flood 1/10 Low FEMA zone X (unshaded) · 0% chance over 30 yrs
- Wildfire 1/10 Low
- Heat 9/10 Extreme 7 d/yr ≥108°F today · 22 d/yr by 30 yrs out
- Wind 9/10 Extreme 99% chance of damaging wind over 30 yrs
- Air quality 2/10 Low 1 unhealthy d/yr today · 2 by 30 yrs out
Nearby sold comps map
Loading sold comps map…
Walkable amenities ~0.75 mi
Loading nearby amenities…
Taxation est. · year 1
- Rental income
- $26,247
- − Mortgage interest
- −$13,998
- − Property taxes
- −$1,071
- − Insurance
- −$1,250
- − Repairs & maintenance
- −$2,100
- − Management
- −$2,100
- − Depreciation
- −$7,270
- Taxable loss
- −$1,542
- Est. tax savings @ 24.0%
- +$370
- After-tax cash flow
- $3,058/yr
For passive investors: Depreciation is non-cash, so a rental often shows a tax loss while cash-flowing — sheltering income. Rental losses are passive: they offset passive income freely, and up to $25,000/yr can offset ordinary (W-2) income if you actively participate and your MAGI is under $100k (phasing out to $0 by $150k); unused losses carry forward. On sale, claimed depreciation is recaptured at up to 25%, and gains may owe capital-gains tax (a 1031 exchange can defer both). Figures are a year-1 estimate at your 24.0% rate — not tax advice; consult a CPA.
Schools (NCES district)
- District
- Seminole
- NCES district ID
- 1201710
- Math proficiency
- 57% ▼ -7.00%
- Reading proficiency
- 61% ▼ -1.00%
- Median HH income
- $58,478
- Composite
- 51.05/100
- National rank
- #1769
- State rank
- #13 of 73 in FL
Livability — Casselberry
- Score
- 73/100
- State rank
- #314
- US rank
- #5320
Category grades
Schools grade is shown separately in the Schools card above.
Census & demographics
- Census place
- Casselberry, FL
- County
- Seminole County · 436,154 people
- City population
- 45,584
- Metro
- Orlando-Kissimmee-Sanford, FL
- Population (ZIP)
- 39,493
- Household income
- $69,113
- Rent vs Own
- Severe rent burden
- 1482.0
Population outlook (Seminole County) Hauer SSP2
- Today (2025)
- 515,494 people
- By 2030
- 545,713 · +5.9%
- By 2040
- 598,068 · +16.0%
- By 2050
- 640,663 · +24.3%
- By 2075
- 724,461 · +40.5%
- By 2100
- 755,530 · +46.6%
Race, ethnicity, and origin ACS 2023
- Neighborhood character
- Diverse neighborhood (Simpson 0.61)
- Race & ethnicity
- White 56% Hispanic / Latino 27% Two or more races 14% Black 10% Asian 4%
- Hispanic origin (detail)
- Mexican 3% Puerto Rican 12% Cuban 4% Dominican 2%
- Common ancestry
- Hispanic 3% Romanian 2% Lithuanian 2%
- Foreign-born
- 15% · Canada, Jamaica, China
- Languages at home
- 76% English-only · Spanish 18% French/Haitian/Cajun 2% Other Indo-European 1%
Political lean MEDSL · Seminole
- 2024 margin
- Toss-up / Even · D 47.6% · R 51.1% · Other 1.3%
- 2008→2024 swing
- -0.8pp no change · 2008: -2.8pp · 2024: -3.5pp
- All cycles
- 2024: R+3.5 2020: D+2.8 2016: R+1.6 2012: R+6.5 2008: R+2.8
Not yet ingested
- Civics
- —
Market trends
- HPI YoY
- ▼ -251.90%
- Current HPI
- 342.1006
- Rent YoY
- ▲ 2.09%
- Metro
- Orlando-Kissimmee-Sanford, FL
- State GDP YoY
- ▲ 3.28%
- F500 in state
- 36
Industry mix (Fortune 500 HQ in FL)
| Industry | F500 HQs | Revenue |
|---|---|---|
| Industrial Technology | 2 | $29B |
|
||
| Insurance | 2 | $17B |
|
||
| Retail | 1 | $60B |
|
||
| Technology Distribution | 1 | $58B |
|
||
| Homebuilding | 1 | $35B |
|
||
| Technology Manufacturing | 1 | $35B |
|
||
Price history
+309.7% since first listed3 events — show timeline
- 2026-05-08 Pending — Stellar MLS as Distributed by MLS Grid
- 2026-05-05 Listed $249,900 Stellar MLS as Distributed by MLS Grid
- 1985-10-01 Sold (Public Records) $61,000 Public Records
Property tax history
+3.1%/yrLatest (2025): $1,071 · +7.3% YoY. Source: county tax records.
Cash-flow waterfall
monthlySold comps — $/sqft
last 12 mo · ≤1 miLoading sold comps…