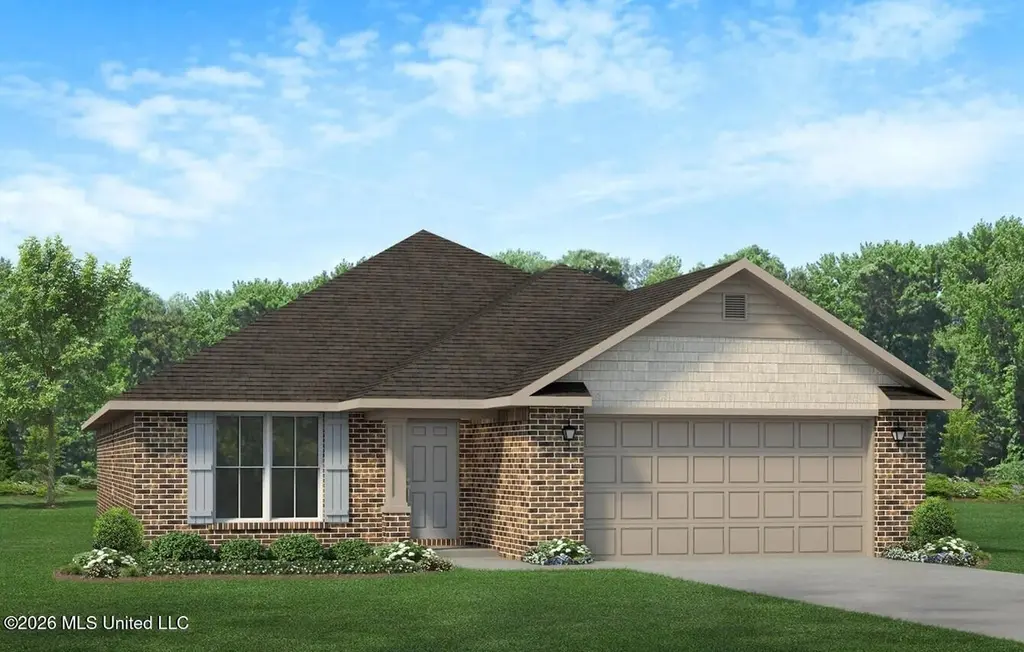
 🏗️ New Construction
14252 Hartland Dr · Gulfport, MS
Flood risk 1/10 · Minimal
- FEMA flood zone
- X (unshaded)
- Chance of flooding over 30 yrs
- 0.0%
- Est. flood insurance / yr
- $507 – $1,088
Fire risk 4/10 · Minor
- Est. fire insurance / yr
- $1,241 – $2,305
Heat risk 9/10 · Severe
- Hot days now (above 107°F)
- 7 days/yr
- Hot days in 30 yrs
- 19 days/yr
Wind risk 9/10 · Severe
- Chance of severe wind over 30 yrs
- 99.0%
Air-quality risk 1/10 · Minimal
- Unhealthy air days now
- 0 days/yr
- Unhealthy air days in 30 yrs
- 0 days/yr
Risk factors via First Street. Map © Google.
Why this score? — see what drove the F grade
The composite is a weighted blend of 9 inputs, each scored 0–100. Each bar is that input's sub-score; the figure is the points it added to the 100-point composite (weight × sub-score).
- Cash flow +8.5/30.0
- ARV discount +7.5/15.0
- Rent growth +4.2/5.0
- Schools +4.2/10.0
- Livability +3.7/5.0
- 1% rule +2.8/10.0
- DSCR +2.3/10.0
- Condition / age +1.0/5.0
- Appreciation +0.0/10.0
$276,500
🖨 Deal sheet 📄 Offer letter ✓ Due diligence
Listing remarks
Beautiful 3 Bedroom Home with Whole Home Upgrades and Luxury Master Retreat Step into this thoughtfully designed 3 bedroom, 2 bath home where modern finishes and a smart, functional layout come together effortlessly. The open concept living, dining, and kitchen areas create a bright, welcoming flow—perfect for everyday living and entertaining. The kitchen serves as the heart of the home, showcasing granite countertops throughout, abundant cabinetry, and a seamless connection to both the breakfast nook and formal dining room. Durable luxury vinyl flooring extends through the entire home, offering a clean, cohesive look with easy maintenance. The private primary suite is enhanced with t
Key facts
- Open concept living
- Abundant cabinetry
- Granite countertops
Tags
Property features AI
Finance
- HOA & community: Homeowners association with annual fee of $320; One-time association fee of $200; Association management included; Community sidewalks and street lights
Exterior
- Parking: 2-car garage; Concrete driveway with direct garage access and garage door opener
- Security: Smoke detectors; Carbon monoxide detectors
- Utilities: Public water; Public sewer; Electricity connected; Sewer connected; Water connected; Underground utilities
- Home design: Single-family house; One story; Under construction; New construction; Builder model 1900A
- Construction: Brick exterior; Architectural shingle roof; Slab foundation; Built by the builder (living area per builder)
- Exterior features: Front porch; Rear porch; Private yard
Interior
- Kitchen: Dishwasher; Disposal; Electric range; Microwave; Plumbed for ice maker; Stainless steel appliances
- Flooring: Luxury vinyl
- Bathrooms: 2 full bathrooms
- Heating & cooling: Electric heat; Heat pump; Ceiling fans for cooling
- Interior features: Ceiling fans; Double vanity; Entrance foyer; Granite counters; High ceilings; Soaking tub; Tray ceilings; Walk-in closets; Breakfast bar; Double-pane insulated windows with screens
- Laundry & utility: Laundry room with washer and electric dryer hookups
Neighborhood map
What this means for you Summary
Snapshot
- This is a 3-bed/2.0-bath single-family listed at $276k. Condition is rated poor.
Deal economics
- At list price, monthly cash flow is $-246 ($-3k/yr) — negative.
- To cash-flow at today's rent, offer at most $246k (10.9% below list).
- To meet the 1% rule (rent ≥ 1% of price), the offer needs to be $219k (20.8% below list).
- Recommended offer: $219k (20.8% below list) — sets the bar for 1% rule.
Location & tenants
- Location reads 73/100 on livability (#15 in MS) — a middle-class / working-renter tenant base. Strengths: cost of living A+, housing A+, health & safety A+; Watch: schools D, amenities F, commute F.
- Harrison County School District (rural): math 52% / reading 46% proficiency, ranked #14 of 130 in MS (top 11%) — families likely to look elsewhere, expect single-tenant / working-renter base with shorter leases; 62% free/reduced lunch — lower-income household profile, screen leases tightly.
- Market conditions: Rents rising fast (+7.0%/yr); 763 active listings in the ZIP; 6 comparable units currently listed for rent nearby; rentals lingering (median 44d on market — plan ~5-8 weeks vacancy on turnover, expect pricing pressure); 50% of comp listings sitting > 30 days — soft ceiling on asking rent; 2,194 units permitted in Harrison County in 2024 (0 in 5+ unit buildings).
- This rent runs 42% of the median local income ($63k/yr) — at the standard rent-burdened threshold; future hikes will face affordability resistance.
Forward outlook
- Local home prices are declining (-3.0%/yr); year-one equity from $2k of loan paydown is wiped out by about $8k of value loss. Plan a longer hold.
- Harrison County population projected at +27% by 2050 — long-run rental-demand tailwind backs the buy-and-hold thesis.
Negotiation context
- It's been on market 45 days — a 3% lower offer ($268k) is reasonable based on typical stale-listing flexibility.
Risks & watch-outs
- Climate carrying-cost: severe wind risk, 99% chance of damaging wind over 30y; extreme-heat days projected 7→19/yr by 2055 (HVAC capex compounding) — expect insurance premiums to compound above CPI over the hold.
Questions for the listing agent
- What do current leases actually rent for vs. the listed asking? Can we see a recent rent roll and the last 12 months of T-12 income?
- It's been on market 45 days. Have you received any prior offers? Is the seller open to a 21% concession, seller financing, or rate buy-down credit?
- Have any recent inspections been done? Can we get a copy of the seller's disclosures and any deferred-maintenance estimates?
- What does the HOA fee cover, when was the last increase, and are there any pending special assessments or reserve-fund shortfalls?
- Is there a deadline driving the sale (1031 exchange, divorce, estate, relocation)? That informs how much negotiation room exists.
- Schools are D-rated, which usually means shorter tenancies and higher turnover. Who's the typical renter profile here, and what's been the actual vacancy rate?
- The area grade is low — what's the realistic commute time and amenity access for the typical tenant pool here? Any planned neighborhood developments (good or bad) we should know about?
- What's the average days-on-market for RENTAL listings here right now (not sales)? A rising rental-DOM trend means longer vacancies and softer asking-rent achievability than the comps imply.
- What's the recent tenant-quality profile in this submarket — average credit score on applications, eviction rate, late-payment / NSF rate, and stable-employment percentage? A property-management company in the area should have these aggregated.
- How much new for-sale + rental construction is in the pipeline within 1–3 miles? Heavy new supply typically softens prices + rents 12–24 months out; constrained supply supports both.
Investment metrics
- 1% rule
- 0.78% ✗
- Cap rate
- 5.25%
- Cash-on-cash
- -3.74%
- DSCR
- 0.83
- GRM
- 10.7
CMA / ARV
- ARV (median comp)
- $281,952
- List price
- $276,500
- Delta
- -1.93%
- Verdict
- FAIR
- Comps
- 20 within 1.0 mi
Show comp detail 12 sales within ~0.75 mi
| Address | Dist | Beds/Ba | Sqft | Sold | Price | $/sf | Match |
|---|---|---|---|---|---|---|---|
| 14864 Fritz Cir | 0.06mi | 4/2.0 (+1) | 1,930 (+2%) | 3mo | $270,250 | $140 | 87 |
| 14175 Hartland Dr | 0.13mi | 4/2.0 (+1) | 1,820 (-4%) | 1mo | $247,500 | $136 | 81 |
| 14456 N Swan Rd | 0.21mi | 3/2.0 | 1,800 (-5%) | 2mo | $265,000 | $147 | 80 |
| 14922 Fritz Cir | 0.12mi | 4/2.0 (+1) | 1,820 (-4%) | 4mo | $251,175 | $138 | 79 |
| 14151 Hartland Dr | 0.19mi | 4/2.0 (+1) | 1,820 (-4%) | 2mo | $249,900 | $137 | 78 |
| 14946 Fritz Cir | 0.16mi | 4/2.0 (+1) | 1,820 (-4%) | 6mo | $256,217 | $141 | 76 |
| 14960 Fritz Cir | 0.09mi | 4/2.0 (+1) | 1,635 (-14%) | 2mo | $245,450 | $150 | 66 |
| 14930 Fritz Cir | 0.06mi | 4/2.0 (+1) | 1,635 (-14%) | 4mo | $239,525 | $146 | 66 |
| 15346 Summerfield Dr | 0.54mi | 4/2.0 (+1) | 1,913 (+1%) | 5mo | $277,000 | $145 | 65 |
| 14159 Hartland Dr | 0.16mi | 4/2.0 (+1) | 1,635 (-14%) | 1mo | $245,450 | $150 | 63 |
| 14130 Ursuline Rd | 0.41mi | 3/2.0 | 1,740 (-8%) | 5mo | $285,000 | $164 | 63 |
| 15407 Meadow Brook Ct | 0.65mi | 3/2.0 | 1,818 (-4%) | 7mo | $285,000 | $157 | 56 |
Match score weights: distance 35% · size 25% · config 20% · recency 20%. Top-matched comps best support the ARV.
Projected returns pro-forma
-3.0% appreciation · 6.99% rent growth · sell at horizon
- IRR
- -18.1%
- Equity multiple
- 0.34×
- Total profit
- $-52,166
- Equity at exit
- $42,040
- IRR
- -4.0%
- Equity multiple
- 0.69×
- Total profit
- $-24,668
- Equity at exit
- $24,378
Cash invested: $78,947 (down + closing). Projections, not guarantees.
Landlord ↔ Tenant lean methodology
- Overall (STATE)
- 90 Strongly Landlord-Friendly
- State Mississippi
- 90 Strongly Landlord-Friendly · R+11
- County
- — inherits STATE
- City
- — inherits STATE
ZIP-level market 39503
- Home prices YoY
- -21.5%
- Rents YoY
- 7.0%
- Active inventory
- 763
- Price-to-rent
- 10.5×
Monthly cashflow live
- Estimated rent
- $2,189 high interval (Pro) →
- Mortgage (P&I)
- −$1,479
- Tax est. 1.5%
- −$352 /mo · $4,229/yr
- Insurance
- −$117
- HOA
- −$27
- Vacancy / Maint / Mgmt
- −$460
- Net cashflow
- $-246
Break-even live
UW: 25.0% down · 7.5% · 30yr · 1.5% tax · 5.0% vac · 8.0% maint · 8.0% mgmt
Financing live
Cash to close
- Down payment
- $70,488
- Closing costs
- $8,459
- Reserves months
- —
- Total cash needed
- —
Loan-product check · same deal, 3 products live
Conventional
25% down · 7.5% · 30yr
- Down + closing
- —
- Monthly P&I
- —
- Monthly cashflow
- —
- DSCR
- —
- Eligible?
- —
Personal DTI + credit; lowest rate.
DSCR
20% down · 8.5% · 30yr
- Down + closing
- —
- Monthly P&I
- —
- Monthly cashflow
- —
- DSCR
- —
- Eligible?
- —
No personal income docs; deal must DSCR.
Hard money
10% down · 12.0% · 12mo
- Down + closing
- —
- Monthly P&I
- —
- Monthly cashflow
- —
- DSCR
- —
- Eligible?
- —
Short-term bridge; refi at stabilization.
Rent comps 6 comps
| Address | Beds | Baths | Sqft | Rent | $/sqft | DOM | Units | Dist |
|---|---|---|---|---|---|---|---|---|
| 15033 S White Swan Dr Gulfport, MS | 4.0 | 2.5 | 1933 | $2,495 | $1.29 | 21d | 1 | 0.40mi |
| 15336 Lakeview Ct Gulfport, MS | 3.0 | 2.0 | 1837 | $2,195 | $1.19 | 21d | 1 | 0.40mi |
| 15740 Rachael Dr Gulfport, MS | 4.0 | 2.0 | 1928 | $2,400 | $1.24 | 13d | 1 | 0.79mi |
| 13727 Fox Hill Dr Gulfport, MS | 3.0 | 2.0 | 1388 | $1,800 | $1.30 | 43d | 1 | 1.10mi |
| 13518 Huntington Cir Gulfport, MS | 4.0 | 2.0 | 2084 | $1,950 | $0.94 | 43d | 1 | 1.23mi |
| 15395 Percy St Gulfport, MS | 3.0 | 2.0 | 1710 | $1,975 | $1.15 | 43d | 1 | 1.34mi |
HOA detail
- Monthly dues
- $27 · $324/yr
Listing history 17 events
-
2026-06-16status $276,500 Pending 45 DOM
-
2026-06-16days on market $276,500 Active 45 DOM
-
2026-06-15days on market $276,500 Active 44 DOM
-
2026-06-14days on market $276,500 Active 42 DOM
-
2026-06-13pricedays on market $276,500 Active 41 DOM
-
2026-06-10days on market $272,500 Active 39 DOM
-
2026-06-09days on market $272,500 Active 38 DOM
-
2026-06-08days on market $272,500 Active 37 DOM
-
2026-06-07days on market $272,500 Active 36 DOM
-
2026-06-02days on market $272,500 Active 31 DOM
-
2026-06-01days on market $272,500 Active 30 DOM
-
2026-05-31days on market $272,500 Active 29 DOM
-
2026-05-30pricedays on market $272,500 Active 28 DOM
-
2026-05-15price $267,900 1335-char remark
-
2026-05-15price $270,900 1335-char remark
-
2026-05-06price $267,900 1335-char remark
-
2026-05-02$264,900 Active 1335-char remark
ⓘ Source: listings_history table (triggers on properties + properties_extension) + one-shot
backfill from property_details.listing_events for pre-trigger history.
Climate risk First Street
- Flood 1/10 Low FEMA zone X (unshaded) · 0% chance over 30 yrs
- Wildfire 4/10 Moderate
- Heat 9/10 Extreme 7 d/yr ≥107°F today · 19 d/yr by 30 yrs out
- Wind 9/10 Extreme 99% chance of damaging wind over 30 yrs
- Air quality 1/10 Low 0 unhealthy d/yr today · 0 by 30 yrs out
Nearby sold comps map
Loading sold comps map…
Walkable amenities ~0.75 mi
Loading nearby amenities…
Taxation est. · year 1
- Rental income
- $26,271
- − Mortgage interest
- −$15,794
- − Property taxes
- −$4,229
- − Insurance
- −$1,410
- − Repairs & maintenance
- −$2,102
- − Management
- −$2,102
- − HOA
- −$324
- − Depreciation
- −$8,202
- Taxable loss
- −$7,891
- Est. tax savings @ 24.0%
- +$1,894
- After-tax cash flow
- $-1,058/yr
For passive investors: Depreciation is non-cash, so a rental often shows a tax loss while cash-flowing — sheltering income. Rental losses are passive: they offset passive income freely, and up to $25,000/yr can offset ordinary (W-2) income if you actively participate and your MAGI is under $100k (phasing out to $0 by $150k); unused losses carry forward. On sale, claimed depreciation is recaptured at up to 25%, and gains may owe capital-gains tax (a 1031 exchange can defer both). Figures are a year-1 estimate at your 24.0% rate — not tax advice; consult a CPA.
Condition & rehab AI · 2 photos
This property requires extensive repairs and improvements to its roof, exterior, and landscaping, significantly impacting its value. Immediate action is needed to address these critical issues.
Repairs flagged
- Major roof — Significant damage visible
- Major exterior landscaping and fencing — Severe overgrowth and poor condition
- Major foundation — Aerial view suggests potential structural issues
Value-add opportunities
- Both landscaping and fencing improvements — Enhances curb appeal and property value
- Both roof repair — Critical to safety and property value
- Both foundation repair — Ensures structural integrity and safety
Renovation cost estimate screening
| Repair item | Severity | Est. cost |
|---|---|---|
| roof · Significant damage visible | Major | $15,000–50,000 |
| exterior landscaping and fencing · Severe overgrowth and poor condition | Major | $15,000–50,000 |
| foundation · Aerial view suggests potential structural issues | Major | $15,000–50,000 |
| Total estimated repair cost · 3 items | $45,000–150,000 |
Value-add ROI direction
- Both landscaping and fencing improvements — Enhances curb appeal and property value ↑
- Both roof repair — Critical to safety and property value ↑
- Both foundation repair — Ensures structural integrity and safety ↑
ⓘ Cost ranges are severity-bucket heuristics (US national rule-of-thumb). Get contractor quotes + a written scope before underwriting a rehab budget.
Schools (NCES district)
- District
- Harrison County School District
- NCES district ID
- 2801770
- Math proficiency
- 52% ▼ -4.00%
- Reading proficiency
- 46% ▼ -4.00%
- Median HH income
- $46,504
- Composite
- 41.66/100
- National rank
- #3419
- State rank
- #14 of 130 in MS
Livability — Gulfport
- Score
- 73/100
- State rank
- #15
- US rank
- #5010
Category grades
Schools grade is shown separately in the Schools card above.
Census & demographics
- County
- Harrison County · 178,171 people
- City population
- 96,188
- Metro
- Gulfport-Biloxi, MS
- Population (ZIP)
- 55,059
- Household income
- $62,641
- Rent vs Own
- Severe rent burden
- 1686.0
Population outlook (Harrison County) Hauer SSP2
- Today (2025)
- 228,444 people
- By 2030
- 241,942 · +5.9%
- By 2040
- 267,531 · +17.1%
- By 2050
- 291,062 · +27.4%
- By 2075
- 346,711 · +51.8%
- By 2100
- 378,165 · +65.5%
Race, ethnicity, and origin ACS 2023
- Neighborhood character
- Diverse neighborhood (Simpson 0.58)
- Race & ethnicity
- White 58% Black 27% Two or more races 9% Hispanic / Latino 6% Asian 2%
- Hispanic origin (detail)
- Mexican 2% Puerto Rican 1%
- Common ancestry
- Lithuanian 5% Slovak 1% Portuguese 1%
- Foreign-born
- 3% · Canada
- Languages at home
- 95% English-only · Spanish 3%
Political lean MEDSL · Harrison
- 2024 margin
- Strong R (+28.9) · D 35.0% · R 63.9% · Other 1.1%
- 2008→2024 swing
- -2.9pp toward R · 2008: -26.0pp · 2024: -28.9pp
- All cycles
- 2024: R+28.9 2020: R+25.2 2016: R+30.7 2012: R+26.6 2008: R+26.0
Not yet ingested
- Civics
- —
Market trends
- HPI YoY
- ▼ -51.39%
- Current HPI
- 187.285
- Rent YoY
- ▲ 6.99%
- Metro
- Gulfport-Biloxi, MS
- State GDP YoY
- —
- F500 in state
- 0
Price history
+4.4% since first listed7 events — show timeline
- 2026-06-16 Pending — MLSU
- 2026-06-11 Price Changed $276,500 MLSU
- 2026-05-29 Price Changed $272,500 MLSU
- 2026-05-15 Price Changed $267,900 MLSU
- 2026-05-15 Price Changed $270,900 MLSU
- 2026-05-06 Price Changed $267,900 MLSU
- 2026-05-02 Listed $264,900 MLSU
Cash-flow waterfall
monthlySold comps — $/sqft
last 12 mo · ≤1 miLoading sold comps…