 Multi-family
101 Ike Rd · Huntsville, AL
Flood risk No data
- FEMA flood zone
- —
- Chance of flooding over 30 yrs
- —
- Est. flood insurance / yr
- —
Fire risk No data
- Est. fire insurance / yr
- —
Heat risk No data
- Hot days now (above threshold)
- —
- Hot days in 30 yrs
- —
Wind risk No data
- Chance of severe wind over 30 yrs
- —
Air-quality risk No data
- Unhealthy air days now
- —
- Unhealthy air days in 30 yrs
- —
Risk factors via First Street. Map © Google.
Why this score? — see what drove the B grade
The composite is a weighted blend of 9 inputs, each scored 0–100. Each bar is that input's sub-score; the figure is the points it added to the 100-point composite (weight × sub-score).
- Cash flow +30.0/30.0
- 1% rule +10.0/10.0
- DSCR +10.0/10.0
- ARV discount +7.5/15.0
- Livability +4.1/5.0
- Schools +3.7/10.0
- Rent growth +3.4/5.0
- Condition / age +2.5/5.0
- Appreciation +0.0/10.0
$600,000
🖨 Deal sheet 📄 Offer letter ✓ Due diligence
Multi-family units
County records classify this as Multi-Family (5+ Unit). Listing-text estimate: 1 unit. estimate disagrees with records
5+ unit building — per-unit beds/baths from public records are typically unavailable; the breakdown below (if shown) is an estimate from the listing text.
Listing remarks MLS
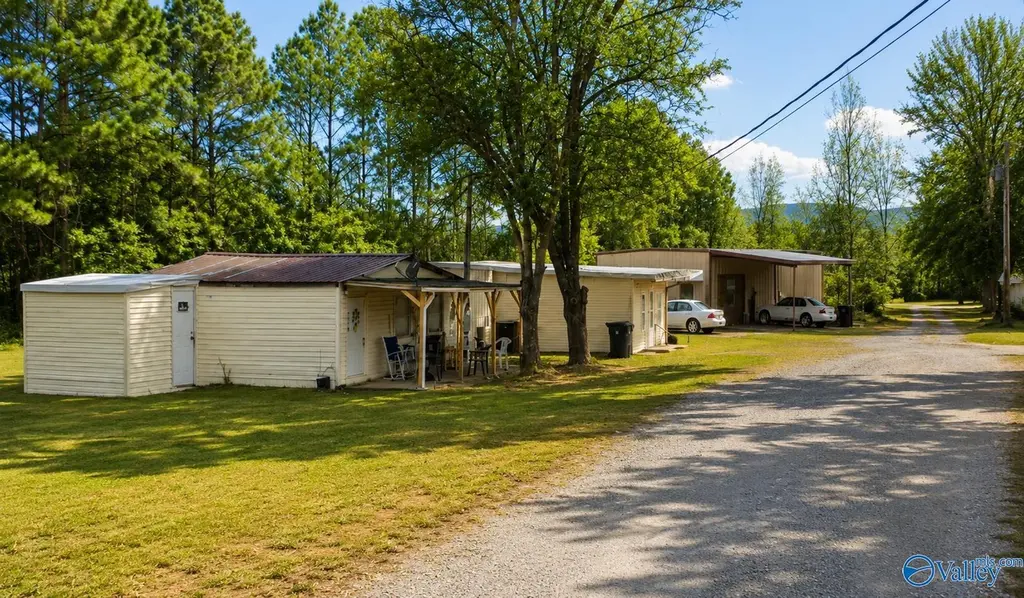
PRIME PROPERTY, 3.5 acres in one of Alabama's fastest growing areas, Hampton Cove. Located between Hwy 431 and Old Big Cove Rd. This property has a TOTAL of 10 rental units 3 mobile homes, 6 apartments and 1 Mechanic shop, all 100% occupied. In addition, to the present RENTAL INCOME it has great growth potential for APARTMENT COMPLEX. Located in the county with city water.
Key facts
- 1.8 acre lot
- 13 parking spots
- Listed 10 days
Property features AI
Finance
- HOA & community: Located in the Owens Cross Roads community
Exterior
- Parking: 13 parking spaces; Open parking available; Lot and private parking; Lighted parking; On-street parking; Driveway with circular, dirt, and gravel sections; RV access/parking; Shared driveway
- Utilities: Public sewer; Public water
- Home design: Multi-family residential income property; Not new construction
- Exterior features: No significant view; Public water source
Interior
- Heating & cooling: Heating present; Wall Unit(s) and Window Unit(s) for cooling
- Interior features: Wall and window cooling units
Neighborhood map
What this means for you Summary
Snapshot
- This is a multifamily listed at $600k.
Deal economics
- At list price, monthly cash flow is $6k ($67k/yr) — positive.
- The deal already cash-flows at list — no discount required.
- Meets the 1% rule at list price ($12k rent vs $600k).
- Cap rate 17.5% vs local median 3.8% in Huntsville — top-decile yield for the area; either an underpriced asset or a hidden risk that comps aren't pricing in. Stress-test before assuming the spread holds.
Location & tenants
- Location reads 82/100 on livability (#3 in AL, #1,082 nationally) — a professional / high-income tenant draw. Strengths: commute A+, cost of living A+, housing A+; Watch: crime F.
- Madison County (rural): math 27% / reading 56% proficiency, ranked #19 of 129 in AL (top 15%) — families likely to look elsewhere, expect single-tenant / working-renter base with shorter leases.
- Market conditions: Rents rising (+3.5%/yr); 366 active listings in the ZIP; 2 comparable units currently listed for rent nearby; high-income renter base; 4,709 units permitted in Madison County in 2024 (1,186 in 5+ unit buildings).
- At $12,364/mo this rent would consume 120% of the median local household income ($123k/yr) (locally 73% of renters already pay >50% of income on rent) — very limited rent-growth headroom before tenants either downsize or default.
Forward outlook
- Local home prices are declining (-3.0%/yr); year-one equity from $4k of loan paydown is wiped out by about $18k of value loss. Plan a longer hold.
- Madison County population projected at +18% by 2050 — long-run rental-demand tailwind backs the buy-and-hold thesis.
- At projected returns (-3.0% appreciation + 3.5% rent growth), your $168k cash investment doubles in ~3 years — after that, you're playing with house money.
Negotiation context
- Only 10 days on market — expect competitive offers; lowballing is unlikely to land.
- 3 sale attempts since 5y ago with the ask held roughly flat each time — persistent listings suggest the price (not the market) is what's stuck; bring a comps-based counter.
Questions for the listing agent
- Is there a deadline driving the sale (1031 exchange, divorce, estate, relocation)? That informs how much negotiation room exists.
- Crime grade is F in this area — have there been break-ins, vandalism, or insurance claims at this property in the last 3 years? What carrier currently insures it and at what premium?
- What's the average days-on-market for RENTAL listings here right now (not sales)? A rising rental-DOM trend means longer vacancies and softer asking-rent achievability than the comps imply.
- What's the recent tenant-quality profile in this submarket — average credit score on applications, eviction rate, late-payment / NSF rate, and stable-employment percentage? A property-management company in the area should have these aggregated.
- How much new apartment / multifamily construction is in the pipeline within 1–3 miles? Heavy new supply (>2% of stock underway) typically softens rents 12–24 months out; light construction supports rent growth.
Investment metrics
- 1% rule
- 2.06% ✓
- Cap rate
- 17.54%
- Cash-on-cash
- 40.15%
- DSCR
- 2.79
- GRM
- 4.0
CMA / ARV
No comps found within radius.
Projected returns pro-forma
-3.0% appreciation · 3.54% rent growth · sell at horizon
- IRR
- 37.2%
- Equity multiple
- 2.59×
- Total profit
- $267,725
- Equity at exit
- $89,462
- IRR
- 44.0%
- Equity multiple
- 5.30×
- Total profit
- $722,903
- Equity at exit
- $51,877
Cash invested: $168,000 (down + closing). Projections, not guarantees.
Landlord ↔ Tenant lean methodology
- Overall (STATE)
- 90 Strongly Landlord-Friendly
- State Alabama
- 90 Strongly Landlord-Friendly · R+15
- County
- — inherits STATE
- City
- — inherits STATE
ZIP-level market 35763
- Home prices YoY
- -3.6%
- Rents YoY
- 3.5%
- Active inventory
- 366
- Price-to-rent
- 40.4×
Monthly cashflow live
- Estimated rent
- $12,364 medium interval (Pro) →
- Mortgage (P&I)
- −$3,146
- Tax est. 1.5%
- −$750 /mo · $9,000/yr
- Insurance
- −$250
- HOA
- −$0
- Vacancy / Maint / Mgmt
- −$2,596
- Net cashflow
- $5,621
Break-even live
10-unit breakdown (identical units grouped — click to expand)
| Units | Beds | Baths | Est. rent |
|---|---|---|---|
| 10× units | 1 | 1.5 | $12,360 |
| #1 | 1 | 1.5 | $1,236 |
| #2 | 1 | 1.5 | $1,236 |
| #3 | 1 | 1.5 | $1,236 |
| #4 | 1 | 1.5 | $1,236 |
| #5 | 1 | 1.5 | $1,236 |
| #6 | 1 | 1.5 | $1,236 |
| #7 | 1 | 1.5 | $1,236 |
| #8 | 1 | 1.5 | $1,236 |
| #9 | 1 | 1.5 | $1,236 |
| #10 | 1 | 1.5 | $1,236 |
| Total (10 units) | $12,364 | ||
UW: 25.0% down · 7.5% · 30yr · 1.5% tax · 5.0% vac · 8.0% maint · 8.0% mgmt
Financing live
Cash to close
- Down payment
- $150,000
- Closing costs
- $18,000
- Reserves months
- —
- Total cash needed
- —
Loan-product check · same deal, 3 products live
Conventional
25% down · 7.5% · 30yr
- Down + closing
- —
- Monthly P&I
- —
- Monthly cashflow
- —
- DSCR
- —
- Eligible?
- —
Personal DTI + credit; lowest rate.
DSCR
20% down · 8.5% · 30yr
- Down + closing
- —
- Monthly P&I
- —
- Monthly cashflow
- —
- DSCR
- —
- Eligible?
- —
No personal income docs; deal must DSCR.
Hard money
10% down · 12.0% · 12mo
- Down + closing
- —
- Monthly P&I
- —
- Monthly cashflow
- —
- DSCR
- —
- Eligible?
- —
Short-term bridge; refi at stabilization.
Rent comps 2 comps
| Address | Beds | Baths | Sqft | Rent | $/sqft | DOM | Units | Dist |
|---|---|---|---|---|---|---|---|---|
| 123 Miller Ln Owens Cross Roads, AL | 3.0 | 2.0 | 1500 | $1,395 | $0.93 | 13d | 1 | 0.08mi |
| 1001 Heights Trl SE Brownsboro, AL | 1.0–2.0 | 1.0–2.0 | 912 | $1,655 | $1.81 | 13d | 16 | 0.97mi |
Listing history 7 events
-
2026-06-18days on market $600,000 Active 10 DOM
-
2026-06-17days on market $600,000 Active 9 DOM
-
2026-06-16days on market $600,000 Active 8 DOM
-
2026-06-15days on market $600,000 Active 7 DOM
-
2026-06-14days on market $600,000 Active 5 DOM
-
2026-06-10days on market $600,000 Active 2 DOM
-
2026-06-09$600,000 Active 1 DOM
ⓘ Source: listings_history table (triggers on properties + properties_extension) + one-shot
backfill from property_details.listing_events for pre-trigger history.
Nearby sold comps map
Loading sold comps map…
Walkable amenities ~0.75 mi
Loading nearby amenities…
Taxation est. · year 1
- Rental income
- $148,368
- − Mortgage interest
- −$33,609
- − Property taxes
- −$9,000
- − Insurance
- −$3,000
- − Repairs & maintenance
- −$11,869
- − Management
- −$11,869
- − Depreciation
- −$17,455
- Taxable income
- $61,565
- Est. tax owed @ 24.0%
- −$14,776
- After-tax cash flow
- $52,677/yr
For passive investors: Depreciation is non-cash, so a rental often shows a tax loss while cash-flowing — sheltering income. Rental losses are passive: they offset passive income freely, and up to $25,000/yr can offset ordinary (W-2) income if you actively participate and your MAGI is under $100k (phasing out to $0 by $150k); unused losses carry forward. On sale, claimed depreciation is recaptured at up to 25%, and gains may owe capital-gains tax (a 1031 exchange can defer both). Figures are a year-1 estimate at your 24.0% rate — not tax advice; consult a CPA.
Schools (NCES district)
- District
- Madison County
- NCES district ID
- 0102220
- Math proficiency
- 27% ▼ -32.00%
- Reading proficiency
- 56% ▼ -1.00%
- Median HH income
- $66,058
- Composite
- 37.15/100
- National rank
- #4483
- State rank
- #19 of 129 in AL
Livability — Huntsville
- Score
- 82/100
- State rank
- #3
- US rank
- #1082
Category grades
Schools grade is shown separately in the Schools card above.
Census & demographics
- County
- Madison County · 380,832 people
- City population
- 220,435
- Metro
- Huntsville, AL
- Population (ZIP)
- 19,819
- Household income
- $123,497
- Rent vs Own
- Severe rent burden
- 73.0
Population outlook (Madison County) Hauer SSP2
- Today (2025)
- 392,086 people
- By 2030
- 409,788 · +4.5%
- By 2040
- 440,557 · +12.4%
- By 2050
- 460,990 · +17.6%
- By 2075
- 502,872 · +28.3%
- By 2100
- 513,623 · +31.0%
Race, ethnicity, and origin ACS 2023
- Neighborhood character
- Predominantly White (85%)
- Race & ethnicity
- White 85% Two or more races 8% Hispanic / Latino 5% Black 2% Asian 2%
- Common ancestry
- Italian 5% Slovak 2% Serbian 2%
- Foreign-born
- 4% · Canada
- Languages at home
- 95% English-only · Other Indo-European 2% Spanish 1% Russian/Polish/Slavic 1%
Political lean MEDSL · Madison
- 2024 margin
- Lean R (+9.0) · D 44.7% · R 53.7% · Other 1.6%
- 2008→2024 swing
- +6.0pp toward D · 2008: -14.9pp · 2024: -9.0pp
- All cycles
- 2024: R+9.0 2020: R+8.0 2016: R+16.8 2012: R+18.7 2008: R+14.9
Not yet ingested
- Civics
- —
Market trends
- HPI YoY
- ▼ -10.43%
- Current HPI
- 281.0561
- Rent YoY
- ▲ 3.54%
- Metro
- Huntsville, AL
- State GDP YoY
- ▲ 2.94%
- F500 in state
- 4
Industry mix (Fortune 500 HQ in AL)
| Industry | F500 HQs | Revenue |
|---|---|---|
| Financial Services | 1 | $8B |
|
||
| Healthcare | 1 | $5B |
|
||
Price history
+3.6% since first listed7 events — show timeline
- 2026-06-08 Listed $600,000 VMLS
- 2025-08-10 Rental Removed $695 APPFOLIO
- 2025-08-02 Listed for Rent $695 APPFOLIO
- 2022-03-03 Sold (MLS) $570,000 VMLS
- 2021-12-01 Pending — VMLS
- 2021-10-20 Listed $595,000 VMLS
- 2018-12-27 Sold (Public Records) $579,000 Public Records
Property tax history
+1.9%/yrLatest (2022): $416 · +12.4% YoY. Source: county tax records.
Cash-flow waterfall
monthlySold comps — $/sqft
last 12 mo · ≤1 miLoading sold comps…