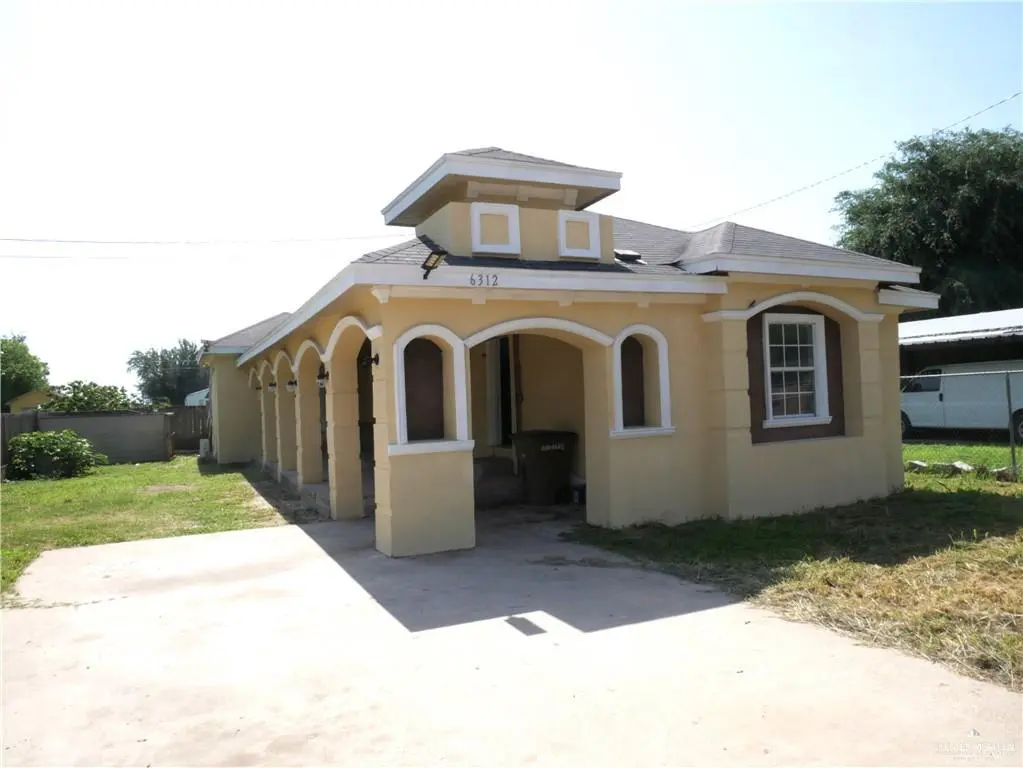
6312 Gold Ave · Edinburg, TX
Flood risk 3/10 · Minor
- FEMA flood zone
- X (shaded)
- Chance of flooding over 30 yrs
- 0.17%
- Est. flood insurance / yr
- $507 – $1,088
Fire risk 8/10 · Major
- Est. fire insurance / yr
- $1,222 – $2,270
Heat risk 9/10 · Severe
- Hot days now (above 112°F)
- 7 days/yr
- Hot days in 30 yrs
- 22 days/yr
Wind risk 8/10 · Major
- Chance of severe wind over 30 yrs
- 99.0%
Air-quality risk 1/10 · Minimal
- Unhealthy air days now
- 0 days/yr
- Unhealthy air days in 30 yrs
- 0 days/yr
Risk factors via First Street. Map © Google.
Why this score? — see what drove the D+ grade
The composite is a weighted blend of 9 inputs, each scored 0–100. Each bar is that input's sub-score; the figure is the points it added to the 100-point composite (weight × sub-score).
- ARV discount +15.0/15.0
- Cash flow +14.3/30.0
- 1% rule +4.7/10.0
- DSCR +4.4/10.0
- Livability +3.2/5.0
- Condition / age +2.5/5.0
- Rent growth +2.2/5.0
- Schools +2.2/10.0
- Appreciation +0.0/10.0
$119,000
🖨 Deal sheet (PDF) 📄 Offer letter ✓ Due diligence
Listing remarks
3 bedroom one bathroom home. There is a large patio done in 2000. The property is fully fenced. The property has 1148 sq ft of living area.
Key facts
- 5,300 sq ft lot
- Built 2000
- Listed 52 days
Property features AI
Finance
- Other: Lot dimensions roughly 53 x 100 (about 5,300 sq ft / 0.1217 acres); Directions: from highway 281 exit Ramseyer head right on Davis Rd
- HOA & community: No association
Exterior
- Parking: No designated parking or carport
- Utilities: Public water
- Home design: Single-story property; Living area source: HidalgoCAD
- Construction: Stucco exterior; Composition shingle roof; Pillar/post/pier foundation; Built area approximately 1,148
- Exterior features: Privacy fence; Deck; Paved road access
Interior
- Kitchen: Electric water heater; Stove/Range
- Bedrooms: Living area includes 1 living space
- Flooring: Laminate flooring
- Bathrooms: 1 full bathroom
- Heating & cooling: Central heating; Central air conditioning
- Interior features: Laminate countertops; Mini blinds
- Laundry & utility: Laundry area with washer/dryer connection
Neighborhood map
What this means for you Summary
Snapshot
- This is a 2-bed/1.0-bath single-family listed at $119k.
Deal economics
- At list price, monthly cash flow is $22 ($263/yr) — positive.
- The deal already cash-flows at list — no discount required.
- To meet the 1% rule (rent ≥ 1% of price), the offer needs to be $115k (3.0% below list).
- Recommended offer: $115k (3.0% below list) — sets the bar for 1% rule.
- Cap rate 6.5% vs local median 2.4% in Edinburg — top-decile yield for the area; either an underpriced asset or a hidden risk that comps aren't pricing in. Stress-test before assuming the spread holds.
Location & tenants
- Location reads 64/100 on livability (#784 in TX) — a middle-class / working-renter tenant base. Strengths: cost of living A+, housing A+; Watch: employment D, amenities F, commute F.
- Edinburg CISD (urban): math 20% / reading 34% proficiency, ranked #699 of 826 in TX (top 85%) — low school quality limits family demand, transient renter base, plan for 1-2y turnover; 62% free/reduced lunch — lower-income household profile, screen leases tightly.
- Zoned schools: Freddy Gonzalez El (math 22% / reading 37%, grade F, #2,525 of 4,322 statewide, top 62%, 500 students, 64% FRL); B L Garza Middle (math 19% / reading 40%, grade F, #1,077 of 1,662 statewide, top 66%, 1,056 students, 82% FRL); Economedes H S (math 19% / reading 24%, grade F, #1,377 of 1,632 statewide, top 85%, 2,762 students, 92% FRL) — zoned schools average 79% FRL vs 62% district-wide (17 pts higher); higher-poverty schools than district average — tighter screening recommended.
- Market conditions: Rents soft (-1.1%/yr); 1011 active listings in the ZIP; 7,378 units permitted in Hidalgo County in 2024 (641 in 5+ unit buildings).
Forward outlook
- Local home prices are declining (-3.0%/yr); year-one equity from $823 of loan paydown is wiped out by about $4k of value loss. Plan a longer hold.
- Hidalgo County population projected at +28% by 2050 — long-run rental-demand tailwind backs the buy-and-hold thesis.
Negotiation context
- It's been on market 52 days — a 3% lower offer ($115k) is reasonable based on typical stale-listing flexibility.
- Current owner paid $8k; list at $119k implies a 1388% gain — meaningful room to come down on a strong offer.
Risks & watch-outs
- Climate carrying-cost: severe wind risk, 99% chance of damaging wind over 30y; severe wildfire risk; extreme-heat days projected 7→22/yr by 2055 (HVAC capex compounding) — expect insurance premiums to compound above CPI over the hold.
Questions for the listing agent
- It's been on market 52 days. Have you received any prior offers? Is the seller open to a 3% concession, seller financing, or rate buy-down credit?
- Is there a deadline driving the sale (1031 exchange, divorce, estate, relocation)? That informs how much negotiation room exists.
- Schools are D-rated, which usually means shorter tenancies and higher turnover. Who's the typical renter profile here, and what's been the actual vacancy rate?
- The area grade is low — what's the realistic commute time and amenity access for the typical tenant pool here? Any planned neighborhood developments (good or bad) we should know about?
- What's the average days-on-market for RENTAL listings here right now (not sales)? A rising rental-DOM trend means longer vacancies and softer asking-rent achievability than the comps imply.
- What's the recent tenant-quality profile in this submarket — average credit score on applications, eviction rate, late-payment / NSF rate, and stable-employment percentage? A property-management company in the area should have these aggregated.
- How much new for-sale + rental construction is in the pipeline within 1–3 miles? Heavy new supply typically softens prices + rents 12–24 months out; constrained supply supports both.
Investment metrics
- 1% rule
- 0.97% ✗
- Cap rate
- 6.51%
- Cash-on-cash
- 0.79%
- DSCR
- 1.04
- GRM
- 8.6
CMA / ARV
- ARV (median comp)
- $230,188
- List price
- $119,000
- Delta
- -48.30%
- Verdict
- UNDERPRICED
- Comps
- 20 within 1.0 mi
Show comp detail 7 sales within ~0.75 mi
| Address | Dist | Beds/Ba | Sqft | Sold | Price | $/sf | Match |
|---|---|---|---|---|---|---|---|
| 5921 N Playa Del Sol St | 0.29mi | 3/2.0 (+1) | 1,200 (+4%) | 12mo | $220,000 | $183 | 60 |
| 1117 E Costa Del Sol Ave | 0.37mi | 3/2.0 (+1) | 1,265 (+10%) | 3mo | $209,500 | $166 | 54 |
| 5813 N Rayo Del Sol | 0.26mi | 3/2.0 (+1) | 1,303 (+14%) | 5mo | $229,000 | $176 | 52 |
| 5917 N Playa Del Sol St | 0.30mi | 3/2.5 (+1) | 1,303 (+14%) | 6mo | $229,000 | $176 | 47 |
| 6009 N Playa Del Sol St | 0.23mi | 3/2.0 (+1) | 1,248 (+9%) | 23mo | $219,900 | $176 | 46 |
| — | 0.33mi | 3/2.0 (+1) | 1,232 (+7%) | 22mo | $220,000 | $179 | 45 |
| 6001 N Rayo Del Sol St | 0.29mi | 3/2.0 (+1) | 1,307 (+14%) | 17mo | $215,000 | $164 | 40 |
Match score weights: distance 35% · size 25% · config 20% · recency 20%. Top-matched comps best support the ARV.
Projected returns pro-forma
-3.0% appreciation · 0.0% rent growth · sell at horizon
- IRR
- -18.7%
- Equity multiple
- 0.36×
- Total profit
- $-21,210
- Equity at exit
- $17,743
- IRR
- -19.5%
- Equity multiple
- 0.11×
- Total profit
- $-29,504
- Equity at exit
- $10,289
Cash invested: $33,320 (down + closing). Projections, not guarantees.
Landlord ↔ Tenant lean methodology
- Overall (STATE)
- 87 Strongly Landlord-Friendly
- State Texas
- 87 Strongly Landlord-Friendly · R+5
- County
- — inherits STATE
- City
- — inherits STATE
ZIP-level market 78542
- Home prices YoY
- -13.4%
- Rents YoY
- -1.1%
- Active inventory
- 1011
- Price-to-rent
- 8.6×
Monthly cashflow live
- Estimated rent
- $1,154 medium interval (Pro) →
- Mortgage (P&I)
- −$624
- Tax from tax record
- −$216 /mo · $2,594/yr
- Insurance
- −$50
- HOA
- −$0
- Lot rent
- −$0
- Vacancy / Maint / Mgmt
- −$242
- Net cashflow
- $22
Break-even live
Sensitivity live
| Price | -10% $89 | -5% $56 | +0% $22 | +5% $-12 | +10% $-45 |
|---|---|---|---|---|---|
| Rent | -10% $-69 | -5% $-24 | +0% $22 | +5% $68 | +10% $113 |
| Rate | -1.0pp $82 | -0.5pp $52 | base $22 | +0.5pp $-9 | +1.0pp $-40 |
UW: 25.0% down · 7.5% · 30yr · 1.5% tax · 5.0% vac · 8.0% maint · 8.0% mgmt
Financing live
Cash to close
- Down payment
- $29,750
- Closing costs
- $3,570
- Reserves months
- —
- Total cash needed
- —
Loan-product check · same deal, 3 products live
Conventional
25% down · 7.5% · 30yr
- Down + closing
- —
- Monthly P&I
- —
- Monthly cashflow
- —
- DSCR
- —
- Eligible?
- —
Personal DTI + credit; lowest rate.
DSCR
20% down · 8.5% · 30yr
- Down + closing
- —
- Monthly P&I
- —
- Monthly cashflow
- —
- DSCR
- —
- Eligible?
- —
No personal income docs; deal must DSCR.
Hard money
10% down · 12.0% · 12mo
- Down + closing
- —
- Monthly P&I
- —
- Monthly cashflow
- —
- DSCR
- —
- Eligible?
- —
Short-term bridge; refi at stabilization.
Listing history 21 events
-
2026-06-21days on market $119,000 Active 52 DOM
-
2026-06-18days on market $119,000 Active 49 DOM
-
2026-06-17days on market $119,000 Active 48 DOM
-
2026-06-16days on market $119,000 Active 47 DOM
-
2026-06-15days on market $119,000 Active 46 DOM
-
2026-06-14days on market $119,000 Active 44 DOM
-
2026-06-13days on market $119,000 Active 43 DOM
-
2026-06-10days on market $119,000 Active 41 DOM
-
2026-06-09days on market $119,000 Active 40 DOM
-
2026-06-08days on market $119,000 Active 39 DOM
-
2026-06-07days on market $119,000 Active 38 DOM
-
2026-06-03days on market $119,000 Active 34 DOM
-
2026-06-02days on market $119,000 Active 33 DOM
-
2026-06-01days on market $119,000 Active 32 DOM
-
2026-05-31days on market $119,000 Active 31 DOM
-
2026-05-31days on market $119,000 Active 30 DOM
-
2026-04-30$119,000 Active 139-char remark
-
2021-03-16soldstatus
-
2019-08-02soldstatus
-
2012-07-24soldstatus
-
1996-08-27soldstatus $7,995
ⓘ Source: listings_history table (triggers on properties + properties_extension) + one-shot
backfill from property_details.listing_events for pre-trigger history.
Tax reassessment forecast TX · Resets to sale price
- Current annual tax
- $2,594 · $216/mo
- Projected year-2 tax
- $2,594 · $216/mo
- Expected delta
- $0/yr ($0/mo · 0.0%)
ⓘ Screening estimate from a state-policy table — verify with the county assessor before closing.
Climate risk First Street
- Flood 3/10 Moderate FEMA zone X (shaded) · 17% chance over 30 yrs
- Wildfire 8/10 Severe
- Heat 9/10 Extreme 7 d/yr ≥112°F today · 22 d/yr by 30 yrs out
- Wind 8/10 Severe 99% chance of damaging wind over 30 yrs
- Air quality 1/10 Low 0 unhealthy d/yr today · 0 by 30 yrs out
Nearby sold comps map
Loading sold comps map…
Walkable amenities ~0.75 mi
Loading nearby amenities…
Taxation est. · year 1
- Rental income
- $13,849
- − Mortgage interest
- −$6,666
- − Property taxes
- −$2,594
- − Insurance
- −$595
- − Repairs & maintenance
- −$1,108
- − Management
- −$1,108
- − Depreciation
- −$3,462
- Taxable loss
- −$1,684
- Est. tax savings @ 24.0%
- +$404
- After-tax cash flow
- $667/yr
For passive investors: Depreciation is non-cash, so a rental often shows a tax loss while cash-flowing — sheltering income. Rental losses are passive: they offset passive income freely, and up to $25,000/yr can offset ordinary (W-2) income if you actively participate and your MAGI is under $100k (phasing out to $0 by $150k); unused losses carry forward. On sale, claimed depreciation is recaptured at up to 25%, and gains may owe capital-gains tax (a 1031 exchange can defer both). Figures are a year-1 estimate at your 24.0% rate — not tax advice; consult a CPA.
Schools (NCES district)
- District
- Edinburg CISD
- NCES district ID
- 4818180
- Math proficiency
- 20% ▼ -34.00%
- Reading proficiency
- 34% ▼ -11.00%
- Median HH income
- $36,985
- Composite
- 22.42/100
- National rank
- #8114
- State rank
- #699 of 826 in TX
Livability — Edinburg
- Score
- 64/100
- State rank
- #784
- US rank
- #14319
Category grades
Schools grade is shown separately in the Schools card above.
Census & demographics
- Census place
- Edinburg, TX
- County
- Hidalgo County · 623,128 people
- City population
- 178,279
- Metro
- McAllen-Edinburg-Mission, TX
- Population (ZIP)
- 89,401
- Household income
- $55,243
- Rent vs Own
- Severe rent burden
- 1240.0
Population outlook (Hidalgo County) Hauer SSP2
- Today (2025)
- 955,232 people
- By 2030
- 1,009,774 · +5.7%
- By 2040
- 1,120,332 · +17.3%
- By 2050
- 1,225,036 · +28.2%
- By 2075
- 1,439,189 · +50.7%
- By 2100
- 1,533,429 · +60.5%
Race, ethnicity, and origin ACS 2023
- Neighborhood character
- Predominantly Hispanic (95%)
- Race & ethnicity
- Hispanic / Latino 95% Two or more races 59% White 4%
- Hispanic origin (detail)
- Mexican 91%
- Foreign-born
- 25% · Canada
- Languages at home
- 15% English-only · Spanish 84%
Political lean MEDSL · Hidalgo
- 2024 margin
- Toss-up / Even · D 48.1% · R 51.0%
- 2008→2024 swing
- -41.6pp toward R · 2008: 38.7pp · 2024: -2.9pp
- All cycles
- 2024: R+2.9 2020: D+17.1 2016: D+40.5 2012: D+41.8 2008: D+38.7
Not yet ingested
- Civics
- —
Market trends
- HPI YoY
- ▼ -34.17%
- Current HPI
- 220.921
- Rent YoY
- ▼ -1.07%
- Metro
- McAllen-Edinburg-Mission, TX
- State GDP YoY
- ▲ 3.95%
- F500 in state
- 110
Industry mix (Fortune 500 HQ in TX)
| Industry | F500 HQs | Revenue |
|---|---|---|
| Energy | 16 | $1,198B |
|
||
| Technology | 5 | $198B |
|
||
| Engineering / Construction | 4 | $72B |
|
||
| Energy Services | 3 | $60B |
|
||
| Utilities | 3 | $41B |
|
||
| Healthcare | 2 | $330B |
|
||
Price history
+1388.4% since first listed5 events — show timeline
- 2026-04-30 Listed $119,000 MCALLENMLS
- 2021-03-16 Sold (Public Records) — Public Records
- 2019-08-02 Sold (Public Records) — Public Records
- 2012-07-24 Sold (Public Records) — Public Records
- 1996-08-27 Sold (Public Records) $7,995 Public Records
Property tax history
+17.0%/yrLatest (2025): $2,594 · +19.4% YoY. Source: county tax records.
Cash-flow waterfall
monthlySold comps — $/sqft
last 12 mo · ≤1 miLoading sold comps…