1024 W Sycamore Ave · Gastonia, NC
Flood risk 1/10 · Minimal
- FEMA flood zone
- X (unshaded)
- Chance of flooding over 30 yrs
- 0.0%
- Est. flood insurance / yr
- $473 – $860
Fire risk 2/10 · Minimal
- Est. fire insurance / yr
- $906 – $1,684
Heat risk 6/10 · Moderate
- Hot days now (above 104°F)
- 7 days/yr
- Hot days in 30 yrs
- 17 days/yr
Wind risk 5/10 · Moderate
- Chance of severe wind over 30 yrs
- 22.0%
Air-quality risk 3/10 · Minor
- Unhealthy air days now
- 3 days/yr
- Unhealthy air days in 30 yrs
- 3 days/yr
Risk factors via First Street. Map © Google.
Why this score? — see what drove the B grade
The composite is a weighted blend of 9 inputs, each scored 0–100. Each bar is that input's sub-score; the figure is the points it added to the 100-point composite (weight × sub-score).
- Cash flow +30.0/30.0
- 1% rule +10.0/10.0
- DSCR +10.0/10.0
- ARV discount +7.5/15.0
- Rent growth +3.9/5.0
- Schools +3.6/10.0
- Livability +3.0/5.0
- Condition / age +2.5/5.0
- Appreciation +0.0/10.0
$65,000
🖨 Deal sheet 📄 Offer letter ✓ Due diligence
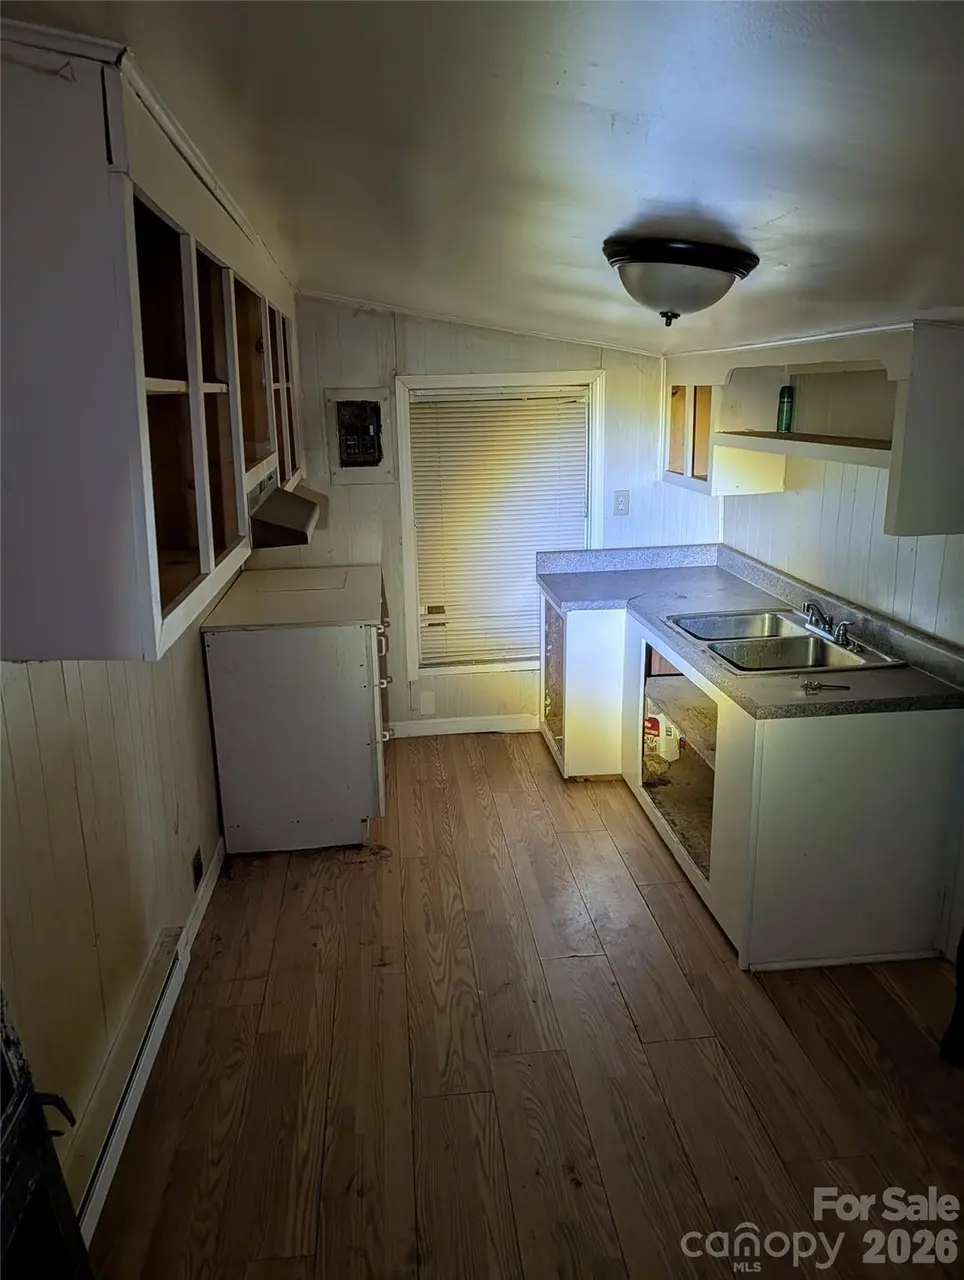
Listing remarks
A great opportunity to remodel or start over fresh. Lots of new construction and renovations nearby. This home offers value and investment potential, come see it today!
Key facts
- 7,840 sq ft lot
- Built 1950
- Listed 50 days
Property features AI
Finance
- HOA & community: No HOA
Exterior
- Parking: Driveway
- Utilities: City water; Public sewer
- Home design: Single-family residence; Residential property; One story
- Construction: Site-built construction; Metal construction materials; Crawl space foundation; Built for 1 level living
- Exterior features: Lot approximately 0.18 acres; Roads are dirt and paved; Publicly maintained road
Interior
- Kitchen: No appliances listed
- Bedrooms: 2 bedrooms on the main level
- Bathrooms: 1 full bathroom on the main level
- Heating & cooling: No heating listed; No central cooling
- Interior features: 3 total rooms; Fireplace
- Laundry & utility: No laundry features
Neighborhood map
What this means for you Summary
Snapshot
- This is a 2-bed/1.0-bath single-family listed at $65k.
Deal economics
- At list price, monthly cash flow is $473 ($6k/yr) — positive.
- The deal already cash-flows at list — no discount required.
- Meets the 1% rule at list price ($1k rent vs $65k).
- Recommended offer: $63k (3.0% below list) — sets the bar for market timing.
- Cap rate 15.0% vs local median 3.7% in Gastonia — top-decile yield for the area; either an underpriced asset or a hidden risk that comps aren't pricing in. Stress-test before assuming the spread holds.
Location & tenants
- Location reads 59/100 on livability (#528 in NC) — a working-class tenant base; expect higher turnover. Strengths: cost of living A+, housing A+; Watch: employment D, crime F, amenities F.
- Gaston County Schools (suburban): math 44% / reading 42% proficiency, ranked #93 of 178 in NC (top 52%) — families likely to look elsewhere, expect single-tenant / working-renter base with shorter leases.
- Zoned schools: Bessemer City Primary (445 students, 99% FRL); Ashbrook High (math 57% / reading 46%, grade D+, #299 of 535 statewide, top 56%, 1,303 students, 72% FRL) — zoned schools average 86% FRL vs 37% district-wide (49 pts higher); higher-poverty schools than district average — tighter screening recommended.
- Market conditions: Rents rising fast (+5.6%/yr); 347 active listings in the ZIP; 11 comparable units currently listed for rent nearby; rentals at typical pace (median 24d on market — plan ~3-4 weeks tenant-placement turnaround); 2,069 units permitted in Gaston County in 2024 (142 in 5+ unit buildings).
Forward outlook
- Local home prices are declining (-3.0%/yr); year-one equity from $449 of loan paydown is wiped out by about $2k of value loss. Plan a longer hold.
- Gaston County population projected at +12% by 2050 — modest demand growth; plan on rents tracking national, not racing it.
- At projected returns (-3.0% appreciation + 5.6% rent growth), your $18k cash investment doubles in ~4 years — after that, you're playing with house money.
Negotiation context
- It's been on market 50 days — a 3% lower offer ($63k) is reasonable based on typical stale-listing flexibility.
- Current owner paid $8k; list at $65k implies a 712% gain — meaningful room to come down on a strong offer.
Risks & watch-outs
- Watch-outs: built in 1950 — expect roof / HVAC / electrical / plumbing capex.
- Climate carrying-cost: moderate wind risk, 22% chance of damaging wind over 30y; extreme-heat days projected 7→17/yr by 2055 (HVAC capex compounding) — expect insurance premiums to compound above CPI over the hold.
Questions for the listing agent
- It's been on market 50 days. Have you received any prior offers? Is the seller open to a 3% concession, seller financing, or rate buy-down credit?
- Built in 1950 — when were the roof, HVAC, electrical panel, plumbing, and water heater last replaced?
- Is there a deadline driving the sale (1031 exchange, divorce, estate, relocation)? That informs how much negotiation room exists.
- Schools are D-rated, which usually means shorter tenancies and higher turnover. Who's the typical renter profile here, and what's been the actual vacancy rate?
- Crime grade is F in this area — have there been break-ins, vandalism, or insurance claims at this property in the last 3 years? What carrier currently insures it and at what premium?
- What's the average days-on-market for RENTAL listings here right now (not sales)? A rising rental-DOM trend means longer vacancies and softer asking-rent achievability than the comps imply.
- What's the recent tenant-quality profile in this submarket — average credit score on applications, eviction rate, late-payment / NSF rate, and stable-employment percentage? A property-management company in the area should have these aggregated.
- How much new for-sale + rental construction is in the pipeline within 1–3 miles? Heavy new supply typically softens prices + rents 12–24 months out; constrained supply supports both.
Investment metrics
- 1% rule
- 1.72% ✓
- Cap rate
- 15.02%
- Cash-on-cash
- 31.17%
- DSCR
- 2.39
- GRM
- 4.8
CMA / ARV
- ARV (on-the-fly)
- $151,182
- Comps found
- 4
Show comp detail 4 sales within ~0.75 mi
| Address | Dist | Beds/Ba | Sqft | Sold | Price | $/sf | Match |
|---|---|---|---|---|---|---|---|
| 1221 N Ransom St | 0.06mi | 2/1.0 | 750 (+13%) | 9mo | $170,000 | $227 | 69 |
| 1047 Sycamore Ave | 0.06mi | 2/1.0 | 721 (+8%) | 21mo | $120,000 | $166 | 66 |
| 1120 N Ransom St | 0.11mi | 1/1.0 (-1) | 624 (-6%) | 18mo | $85,000 | $136 | 64 |
| 1341 Essex St | 0.67mi | 2/1.0 | 728 (+9%) | 6mo | $178,000 | $245 | 48 |
Match score weights: distance 35% · size 25% · config 20% · recency 20%. Top-matched comps best support the ARV.
Projected returns pro-forma
-3.0% appreciation · 5.63% rent growth · sell at horizon
- IRR
- 28.8%
- Equity multiple
- 2.24×
- Total profit
- $22,614
- Equity at exit
- $9,692
- IRR
- 37.7%
- Equity multiple
- 4.94×
- Total profit
- $71,624
- Equity at exit
- $5,620
Cash invested: $18,200 (down + closing). Projections, not guarantees.
Landlord ↔ Tenant lean methodology
- Overall (STATE)
- 85 Strongly Landlord-Friendly
- State North Carolina
- 85 Strongly Landlord-Friendly · R+3
- County
- — inherits STATE
- City
- — inherits STATE
ZIP-level market 28052
- Rents YoY
- 5.6%
- Active inventory
- 347
- Price-to-rent
- 4.8×
Monthly cashflow live
- Estimated rent
- $1,121 high interval (Pro) →
- Mortgage (P&I)
- −$341
- Tax from tax record
- −$45 /mo · $540/yr
- Insurance
- −$27
- HOA
- −$0
- Vacancy / Maint / Mgmt
- −$235
- Net cashflow
- $473
Break-even live
UW: 25.0% down · 7.5% · 30yr · 1.5% tax · 5.0% vac · 8.0% maint · 8.0% mgmt
Financing live
Cash to close
- Down payment
- $16,250
- Closing costs
- $1,950
- Reserves months
- —
- Total cash needed
- —
Loan-product check · same deal, 3 products live
Conventional
25% down · 7.5% · 30yr
- Down + closing
- —
- Monthly P&I
- —
- Monthly cashflow
- —
- DSCR
- —
- Eligible?
- —
Personal DTI + credit; lowest rate.
DSCR
20% down · 8.5% · 30yr
- Down + closing
- —
- Monthly P&I
- —
- Monthly cashflow
- —
- DSCR
- —
- Eligible?
- —
No personal income docs; deal must DSCR.
Hard money
10% down · 12.0% · 12mo
- Down + closing
- —
- Monthly P&I
- —
- Monthly cashflow
- —
- DSCR
- —
- Eligible?
- —
Short-term bridge; refi at stabilization.
Rent comps 11 comps
| Address | Beds | Baths | Sqft | Rent | $/sqft | DOM | Units | Dist |
|---|---|---|---|---|---|---|---|---|
| 1120 N Ransom St Gastonia, NC | 1.0 | 1.0 | 624 | $1,175 | $1.88 | 2d | 1 | 0.13mi |
| 1027 New Beginnings Ave Gastonia, NC | 2.0 | 1.0 | 560 | $995 | $1.78 | 23d | 1 | 0.23mi |
| 1301 Sims Cir Unit D Gastonia, NC | 1.0 | 1.0 | 702 | $950 | $1.35 | 12d | 1 | 0.27mi |
| 922 Dowd Dr Unit D Gastonia, NC | 1.0 | 1.0 | 702 | $950 | $1.35 | 23d | 1 | 0.31mi |
| 310 Norment Ave Gastonia, NC | 2.0 | 1.0 | 691 | $995 | $1.44 | 23d | 1 | 0.72mi |
| 1665 N Webb St Apt : H Gastonia, NC | 2.0 | 1.0 | 674 | $1,025 | $1.52 | 23d | 1 | 1.13mi |
| 147 W Main Ave Gastonia, NC | 3.0 | 1.0–2.0 | 1080 | $1,950 | $1.81 | 23d | 8 | 1.31mi |
| 408 S Weldon St Gastonia, NC | 2.0 | 1.0 | 600 | $900 | $1.50 | 14d | 1 | 1.32mi |
| 416 S Weldon St Gastonia, NC | 2.0 | 1.0 | 650 | $900 | $1.38 | 14d | 1 | 1.34mi |
| 402 N Broad St Gastonia, NC | 1.0 | 1.0 | 600 | $850 | $1.42 | 17d | 1 | 1.42mi |
| 610 W 5th Ave Unit 12 Gastonia, NC | 2.0 | 1.0 | 676 | $950 | $1.41 | 23d | 1 | 1.45mi |
Listing history 16 events
-
2026-06-18days on market $65,000 Active 50 DOM
-
2026-06-17days on market $65,000 Active 49 DOM
-
2026-06-16days on market $65,000 Active 48 DOM
-
2026-06-15days on market $65,000 Active 47 DOM
-
2026-06-13days on market $65,000 Active 45 DOM
-
2026-06-09days on market $65,000 Active 41 DOM
-
2026-06-08days on market $65,000 Active 40 DOM
-
2026-06-07days on market $65,000 Active 39 DOM
-
2026-06-04days on market $65,000 Active 36 DOM
-
2026-06-03days on market $65,000 Active 35 DOM
-
2026-06-02days on market $65,000 Active 34 DOM
-
2026-06-02price $65,000 Active 33 DOM
-
2026-06-01days on market $75,000 Active 33 DOM
-
2026-05-31days on market $75,000 Active 32 DOM
-
2026-04-24$75,000 Active
-
1989-10-01soldstatus $8,000
ⓘ Source: listings_history table (triggers on properties + properties_extension) + one-shot
backfill from property_details.listing_events for pre-trigger history.
Tax reassessment forecast NC · Resets to sale price
- Current annual tax
- $540 · $45/mo
- Projected year-2 tax
- $540 · $45/mo
- Expected delta
- $0/yr ($0/mo · 0.0%)
ⓘ Screening estimate from a state-policy table — verify with the county assessor before closing.
Climate risk First Street
- Flood 1/10 Low FEMA zone X (unshaded) · 0% chance over 30 yrs
- Wildfire 2/10 Low
- Heat 6/10 Major 7 d/yr ≥104°F today · 17 d/yr by 30 yrs out
- Wind 5/10 Major 22% chance of damaging wind over 30 yrs
- Air quality 3/10 Moderate 3 unhealthy d/yr today · 3 by 30 yrs out
Nearby sold comps map
Loading sold comps map…
Walkable amenities ~0.75 mi
Loading nearby amenities…
Taxation est. · year 1
- Rental income
- $13,453
- − Mortgage interest
- −$3,641
- − Property taxes
- −$540
- − Insurance
- −$325
- − Repairs & maintenance
- −$1,076
- − Management
- −$1,076
- − Depreciation
- −$1,891
- Taxable income
- $4,904
- Est. tax owed @ 24.0%
- −$1,177
- After-tax cash flow
- $4,496/yr
For passive investors: Depreciation is non-cash, so a rental often shows a tax loss while cash-flowing — sheltering income. Rental losses are passive: they offset passive income freely, and up to $25,000/yr can offset ordinary (W-2) income if you actively participate and your MAGI is under $100k (phasing out to $0 by $150k); unused losses carry forward. On sale, claimed depreciation is recaptured at up to 25%, and gains may owe capital-gains tax (a 1031 exchange can defer both). Figures are a year-1 estimate at your 24.0% rate — not tax advice; consult a CPA.
Schools (NCES district)
- District
- Gaston County Schools
- NCES district ID
- 3701620
- Math proficiency
- 44% ▲ 4.00%
- Reading proficiency
- 42% ▲ 1.00%
- Median HH income
- $43,644
- Composite
- 36.39/100
- National rank
- #4680
- State rank
- #93 of 178 in NC
Livability — Gastonia
- Score
- 59/100
- State rank
- #528
- US rank
- #19444
Category grades
Schools grade is shown separately in the Schools card above.
Census & demographics
- Census place
- Gastonia, NC
- County
- Gaston County · 201,497 people
- City population
- 114,179
- Metro
- Charlotte-Concord-Gastonia, NC-SC
- Population (ZIP)
- 36,272
- Household income
- $49,643
- Rent vs Own
- Severe rent burden
- 1521.0
Population outlook (Gaston County) Hauer SSP2
- Today (2025)
- 230,027 people
- By 2030
- 237,300 · +3.2%
- By 2040
- 249,659 · +8.5%
- By 2050
- 257,806 · +12.1%
- By 2075
- 272,163 · +18.3%
- By 2100
- 268,652 · +16.8%
Race, ethnicity, and origin ACS 2023
- Neighborhood character
- Diverse neighborhood (Simpson 0.65)
- Race & ethnicity
- White 46% Black 33% Hispanic / Latino 16% Two or more races 9%
- Hispanic origin (detail)
- Mexican 6% Puerto Rican 2%
- Common ancestry
- Serbian 2% Slovak 1% Italian 1%
- Foreign-born
- 7% · Canada, Dominican Republic, Jamaica
- Languages at home
- 86% English-only · Spanish 13%
Political lean MEDSL · Gaston
- 2024 margin
- Strong R (+25.0) · D 37.0% · R 62.1%
- 2008→2024 swing
- 0.0pp no change · 2008: -25.0pp · 2024: -25.0pp
- All cycles
- 2024: R+25.0 2020: R+27.8 2016: R+32.1 2012: R+25.6 2008: R+25.0
Not yet ingested
- Civics
- —
Market trends
- HPI YoY
- ▼ -348.71%
- Current HPI
- 252.912
- Rent YoY
- ▲ 5.63%
- Metro
- Charlotte-Concord-Gastonia, NC-SC
- State GDP YoY
- ▲ 3.28%
- F500 in state
- 26
Industry mix (Fortune 500 HQ in NC)
| Industry | F500 HQs | Revenue |
|---|---|---|
| Financial Services | 2 | $213B |
|
||
| Retail | 2 | $95B |
|
||
| Industrial Conglomerate | 1 | $38B |
|
||
| Metals / Steel | 1 | $35B |
|
||
| Utilities | 1 | $30B |
|
||
| Industrial Machinery | 1 | $19B |
|
||
Price history
+837.5% since first listed2 events — show timeline
- 2026-04-24 Listed $75,000 CANOPYMLS as Distributed by MLS Grid
- 1989-10-01 Sold (Public Records) $8,000 Public Records
Property tax history
+3.2%/yrLatest (2025): $540 · +0.0% YoY. Source: county tax records.
Cash-flow waterfall
monthlySold comps — $/sqft
last 12 mo · ≤1 miLoading sold comps…