90 Caiola Ct · Greenport West, NY
Flood risk 1/10 · Minimal
- FEMA flood zone
- X (unshaded)
- Chance of flooding over 30 yrs
- 0.0%
- Est. flood insurance / yr
- $473 – $860
Fire risk 1/10 · Minimal
- Est. fire insurance / yr
- $691 – $1,283
Heat risk 5/10 · Moderate
- Hot days now (above 90°F)
- 7 days/yr
- Hot days in 30 yrs
- 19 days/yr
Wind risk 8/10 · Major
- Chance of severe wind over 30 yrs
- 80.0%
Air-quality risk 3/10 · Minor
- Unhealthy air days now
- 3 days/yr
- Unhealthy air days in 30 yrs
- 4 days/yr
Risk factors via First Street. Map © Google.
Why this score? — see what drove the B+ grade
The composite is a weighted blend of 9 inputs, each scored 0–100. Each bar is that input's sub-score; the figure is the points it added to the 100-point composite (weight × sub-score).
- Cash flow +30.0/30.0
- ARV discount +12.9/15.0
- 1% rule +10.0/10.0
- DSCR +10.0/10.0
- Schools +4.5/10.0
- Livability +2.9/5.0
- Rent growth +2.5/5.0
- Condition / age +2.5/5.0
- Appreciation +0.0/10.0
$1,785,000
🖨 Deal sheet 📄 Offer letter ✓ Due diligence
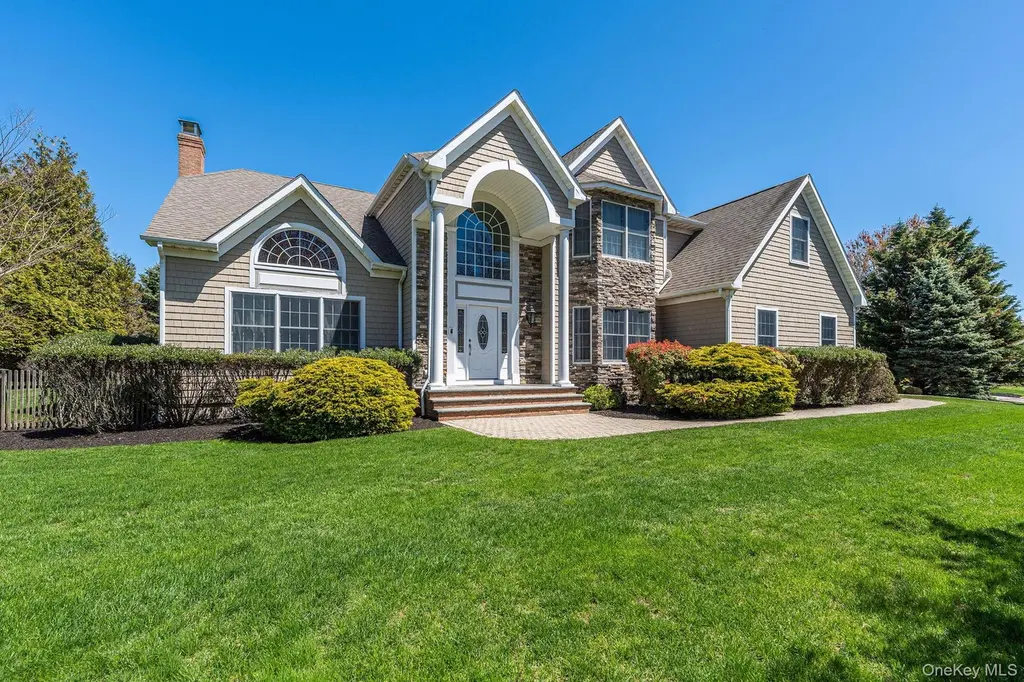
Listing remarks
Located in coveted Rock Cove Estates in Greenport, this beautifully maintained cedar shake and stone residence offers the perfect blend of privacy, comfort, and North Fork lifestyle. Built in 2007 and lovingly cared for by its original owner, the home features four bedrooms and three full baths, including a spacious primary suite with well-appointed bath with double sinks, Jacuzzi tub and separate shower. The primary bedroom also includes large closet and area for home office. The main level offers warm and inviting living spaces, including a living room with wood-burning fireplace, a library, an updated kitchen with induction stove, new backsplash, newer dishwasher and wood floors througho
Key facts
- 0.62 acre lot
- 2 garage spots
- Built 2007
Property features AI
Finance
- Other: County: Suffolk County
- HOA & community: Annual association fee of $500; Association covers common area maintenance and other services; Community amenities: other
Exterior
- Parking: Attached garage; Driveway; Garage present (2 spaces); No carport
- Security: Security system
- Utilities: Septic tank; Utilities details: see remarks
- Home design: Single family residence; Two stories; Living area measured by CubiCasa
- Construction: Frame construction; Full unfinished basement
- Exterior features: Frame construction; Back yard fencing; Security system; Not waterfront
Interior
- Kitchen: Dishwasher; Oven; Stainless steel appliances; Kitchen island; Eat-in kitchen
- Bedrooms: Total rooms: 10 (includes bedrooms and living spaces); Two levels
- Flooring: Hardwood flooring
- Bathrooms: Three full bathrooms
- Heating & cooling: Hot air heating (natural gas); Central air conditioning; Other heating system features
- Interior features: First-floor full bathroom; Eat-in kitchen; Entrance foyer; Kitchen island; Open kitchen layout; Additional interior features (see remarks)
- Laundry & utility: Basement full and unfinished (utility space available)
Neighborhood map
What this means for you Summary
Snapshot
- This is a 4-bed/3.0-bath single-family listed at $1.78M.
Deal economics
- At list price, monthly cash flow is $16k ($196k/yr) — positive.
- The deal already cash-flows at list — no discount required.
- Meets the 1% rule at list price ($35k rent vs $1.78M).
- Recommended offer: $1.73M (3.0% below list) — sets the bar for market timing.
- Cap rate 17.3% vs local median 8.0% in Greenport West — top-decile yield for the area; either an underpriced asset or a hidden risk that comps aren't pricing in. Stress-test before assuming the spread holds.
Location & tenants
- Location reads 58/100 on livability (#1,073 in NY) — a working-class tenant base; expect higher turnover. Strengths: crime A+, employment A+; Watch: amenities F, commute F, cost of living F.
- Greenport Union Free School District (town): math 55% / reading 45% proficiency, ranked #450 of 755 in NY (top 60%) — acceptable for families but not a draw, mixed tenant base, ~2y average lease.
- Zoned schools: Greenport Elementary School (math 47% / reading 62%, grade C, #908 of 2,108 statewide, top 46%, 339 students, 61% FRL); Greenport High School (math 52% / reading 54%, grade C-, #934 of 1,100 statewide, top 86%, 356 students, 63% FRL).
- Market conditions: 67 active listings in the ZIP; 6 comparable units currently listed for rent nearby; rentals lingering (median 44d on market — plan ~5-8 weeks vacancy on turnover, expect pricing pressure); 100% of comp listings sitting > 30 days — soft ceiling on asking rent; 1,366 units permitted in Suffolk County in 2024 (216 in 5+ unit buildings).
Forward outlook
- Local home prices are declining (-3.0%/yr); year-one equity from $12k of loan paydown is wiped out by about $54k of value loss. Plan a longer hold.
- Suffolk County population projected to shrink 5% by 2050 — rents likely to lag national; underwrite the cash flow, not the appreciation.
- At projected returns (-3.0% appreciation + 3.0% rent growth), your $500k cash investment doubles in ~3 years — after that, you're playing with house money.
Negotiation context
- It's been on market 49 days — a 3% lower offer ($1.73M) is reasonable based on typical stale-listing flexibility.
- Current owner paid $846k; list at $1.78M implies a 111% gain — meaningful room to come down on a strong offer.
Risks & watch-outs
- Climate carrying-cost: severe wind risk, 80% chance of damaging wind over 30y; extreme-heat days projected 7→19/yr by 2055 (HVAC capex compounding) — expect insurance premiums to compound above CPI over the hold.
Questions for the listing agent
- It's been on market 49 days. Have you received any prior offers? Is the seller open to a 3% concession, seller financing, or rate buy-down credit?
- What does the HOA fee cover, when was the last increase, and are there any pending special assessments or reserve-fund shortfalls?
- Is there a deadline driving the sale (1031 exchange, divorce, estate, relocation)? That informs how much negotiation room exists.
- Schools are D-rated, which usually means shorter tenancies and higher turnover. Who's the typical renter profile here, and what's been the actual vacancy rate?
- What's the average days-on-market for RENTAL listings here right now (not sales)? A rising rental-DOM trend means longer vacancies and softer asking-rent achievability than the comps imply.
- What's the recent tenant-quality profile in this submarket — average credit score on applications, eviction rate, late-payment / NSF rate, and stable-employment percentage? A property-management company in the area should have these aggregated.
- How much new for-sale + rental construction is in the pipeline within 1–3 miles? Heavy new supply typically softens prices + rents 12–24 months out; constrained supply supports both.
Investment metrics
- 1% rule
- 1.96% ✓
- Cap rate
- 17.30%
- Cash-on-cash
- 39.31%
- DSCR
- 2.75
- GRM
- 4.2
CMA / ARV
- ARV (median comp)
- $2,029,922
- List price
- $1,785,000
- Delta
- -12.07%
- Verdict
- UNDERPRICED
- Comps
- 20 within 1.0 mi
Show comp detail 8 sales within ~0.75 mi
| Address | Dist | Beds/Ba | Sqft | Sold | Price | $/sf | Match |
|---|---|---|---|---|---|---|---|
| 1000 Green Hill Ln | 0.07mi | 4/2.5 | 3,400 (+0%) | 4mo | $1,450,000 | $426 | 91 |
| 155 Caiola Ct | 0.05mi | 4/3.5 | 3,500 (+3%) | 11mo | $1,885,000 | $539 | 82 |
| 695 Sound Dr | 0.20mi | 5/3.0 (+1) | 3,393 (0%) | 8mo | $2,163,000 | $637 | 79 |
| 3200 Sound Dr | 0.32mi | 4/3.0 | 3,145 (-7%) | 1mo | $2,142,500 | $681 | 72 |
| 1740 Inlet Pond Rd | 0.11mi | 4/3.0 | 3,756 (+11%) | 11mo | $3,000,000 | $799 | 68 |
| 2375 Sound Dr | 0.19mi | 5/5.5 (+1) | 3,200 (-6%) | 0mo | $2,150,000 | $672 | 66 |
| 135 Sunset Ln | 0.25mi | 4/5.0 | 3,200 (-6%) | 17mo | $975,000 | $305 | 57 |
| 1075 Moores Ln N | 0.16mi | 4/4.0 | 2,900 (-14%) | 24mo | $1,475,000 | $509 | 45 |
Match score weights: distance 35% · size 25% · config 20% · recency 20%. Top-matched comps best support the ARV.
Projected returns pro-forma
-3.0% appreciation · 3.0% rent growth · sell at horizon
- IRR
- 35.6%
- Equity multiple
- 2.51×
- Total profit
- $753,349
- Equity at exit
- $266,149
- IRR
- 42.3%
- Equity multiple
- 5.00×
- Total profit
- $1,998,248
- Equity at exit
- $154,334
Cash invested: $499,800 (down + closing). Projections, not guarantees.
Landlord ↔ Tenant lean methodology
- Overall (STATE)
- 15 Strongly Tenant-Friendly
- State New York
- 15 Strongly Tenant-Friendly · D+10
- County
- — inherits STATE
- City
- — inherits STATE
ZIP-level market 11944
- Home prices YoY
- -23.7%
- Active inventory
- 67
- Price-to-rent
- 4.2×
Monthly cashflow live
- Estimated rent
- $35,054 medium interval (Pro) →
- Mortgage (P&I)
- −$9,361
- Tax from tax record
- −$1,175 /mo · $14,096/yr
- Insurance
- −$744
- HOA
- −$42
- Vacancy / Maint / Mgmt
- −$7,361
- Net cashflow
- $16,371
Break-even live
UW: 25.0% down · 7.5% · 30yr · 1.5% tax · 5.0% vac · 8.0% maint · 8.0% mgmt
Financing live
Cash to close
- Down payment
- $446,250
- Closing costs
- $53,550
- Reserves months
- —
- Total cash needed
- —
Loan-product check · same deal, 3 products live
Conventional
25% down · 7.5% · 30yr
- Down + closing
- —
- Monthly P&I
- —
- Monthly cashflow
- —
- DSCR
- —
- Eligible?
- —
Personal DTI + credit; lowest rate.
DSCR
20% down · 8.5% · 30yr
- Down + closing
- —
- Monthly P&I
- —
- Monthly cashflow
- —
- DSCR
- —
- Eligible?
- —
No personal income docs; deal must DSCR.
Hard money
10% down · 12.0% · 12mo
- Down + closing
- —
- Monthly P&I
- —
- Monthly cashflow
- —
- DSCR
- —
- Eligible?
- —
Short-term bridge; refi at stabilization.
Rent comps 6 comps
| Address | Beds | Baths | Sqft | Rent | $/sqft | DOM | Units | Dist |
|---|---|---|---|---|---|---|---|---|
| 950 Tasker Ln Greenport, NY | 4.0 | 3.5 | 3500 | $36,000 | $10.29 | 43d | 1 | 0.19mi |
| 1000 Sound Dr Greenport, NY | 5.0 | 4.5 | 3700 | $45,000 | $12.16 | 43d | 1 | 0.22mi |
| 2700 Sound Dr Greenport, NY | 5.0 | 3.0 | 3700 | $25,000 | $6.76 | 43d | 1 | 0.26mi |
| 64230 North Rd Greenport, NY | 4.0 | 3.0 | 2800 | $6,500 | $2.32 | 43d | 1 | 0.79mi |
| 63615 North Rd Greenport, NY | 4.0 | 4.5 | 3500 | $7,000 | $2.00 | 43d | 1 | 0.87mi |
| 165 Marine Pl Greenport, NY | 4.0 | 4.5 | 3800 | $20,000 | $5.26 | 43d | 1 | 1.35mi |
HOA detail
- Monthly dues
- $42 · $504/yr
Listing history 17 events
-
2026-06-18days on market $1,785,000 Active 49 DOM
-
2026-06-17days on market $1,785,000 Active 48 DOM
-
2026-06-16days on market $1,785,000 Active 47 DOM
-
2026-06-15days on market $1,785,000 Active 46 DOM
-
2026-06-13days on market $1,785,000 Active 44 DOM
-
2026-06-12days on market $1,785,000 Active 43 DOM
-
2026-06-09days on market $1,785,000 Active 40 DOM
-
2026-06-08days on market $1,785,000 Active 39 DOM
-
2026-06-07days on market $1,785,000 Active 38 DOM
-
2026-06-05days on market $1,785,000 Active 36 DOM
-
2026-06-04days on market $1,785,000 Active 34 DOM
-
2026-06-02days on market $1,785,000 Active 33 DOM
-
2026-06-01days on market $1,785,000 Active 32 DOM
-
2026-05-31days on market $1,785,000 Active 31 DOM
-
2026-04-30$1,785,000 Active 1295-char remark
-
2008-05-14soldstatus $845,900
-
2002-09-26soldstatus $140,000
ⓘ Source: listings_history table (triggers on properties + properties_extension) + one-shot
backfill from property_details.listing_events for pre-trigger history.
Tax reassessment forecast NY · Partial reset (capped growth)
- Current annual tax
- $14,096 · $1,175/mo
- Projected year-2 tax
- $22,132 · $1,844/mo
- Expected delta
- +$8,035/yr (+$670/mo · 57.0%)
ⓘ Screening estimate from a state-policy table — verify with the county assessor before closing.
Climate risk First Street
- Flood 1/10 Low FEMA zone X (unshaded) · 0% chance over 30 yrs
- Wildfire 1/10 Low
- Heat 5/10 Major 7 d/yr ≥90°F today · 19 d/yr by 30 yrs out
- Wind 8/10 Severe 80% chance of damaging wind over 30 yrs
- Air quality 3/10 Moderate 3 unhealthy d/yr today · 4 by 30 yrs out
Nearby sold comps map
Loading sold comps map…
Walkable amenities ~0.75 mi
Loading nearby amenities…
Taxation est. · year 1
- Rental income
- $420,644
- − Mortgage interest
- −$99,988
- − Property taxes
- −$14,096
- − Insurance
- −$8,925
- − Repairs & maintenance
- −$33,652
- − Management
- −$33,652
- − HOA
- −$504
- − Depreciation
- −$51,927
- Taxable income
- $177,900
- Est. tax owed @ 24.0%
- −$42,696
- After-tax cash flow
- $153,758/yr
For passive investors: Depreciation is non-cash, so a rental often shows a tax loss while cash-flowing — sheltering income. Rental losses are passive: they offset passive income freely, and up to $25,000/yr can offset ordinary (W-2) income if you actively participate and your MAGI is under $100k (phasing out to $0 by $150k); unused losses carry forward. On sale, claimed depreciation is recaptured at up to 25%, and gains may owe capital-gains tax (a 1031 exchange can defer both). Figures are a year-1 estimate at your 24.0% rate — not tax advice; consult a CPA.
Schools (NCES district)
- District
- Greenport Union Free School District
- NCES district ID
- 3612840
- Math proficiency
- 55% ▲ 5.00%
- Reading proficiency
- 45% ▼ -5.00%
- Median HH income
- $54,490
- Composite
- 45.25/100
- National rank
- #5759
- State rank
- #450 of 755 in NY
Livability — Greenport West
- Score
- 58/100
- State rank
- #1073
- US rank
- #21520
Category grades
Schools grade is shown separately in the Schools card above.
Census & demographics
- Census place
- Greenport West, NY
- Population (ZIP)
- 4,744
Population outlook (Suffolk County) Hauer SSP2
- Today (2025)
- 1,505,262 people
- By 2030
- 1,498,318 · -0.5%
- By 2040
- 1,471,101 · -2.3%
- By 2050
- 1,424,848 · -5.3%
- By 2075
- 1,337,157 · -11.2%
- By 2100
- 1,217,720 · -19.1%
Race, ethnicity, and origin ACS 2023
- Neighborhood character
- Predominantly White (69%)
- Race & ethnicity
- White 69% Hispanic / Latino 23% Two or more races 6% Black 4% Asian 2%
- Hispanic origin (detail)
- Mexican 5% Puerto Rican 2%
- Common ancestry
- Romanian 6% Lithuanian 2% Subsaharan African 2%
- Foreign-born
- 19% · Canada, China
- Languages at home
- 69% English-only · Spanish 22% German/W. Germanic 3% Russian/Polish/Slavic 2%
Political lean MEDSL · Suffolk
- 2024 margin
- Lean R (+10.0) · D 45.0% · R 55.0%
- 2008→2024 swing
- -16.0pp toward R · 2008: 6.0pp · 2024: -10.0pp
- All cycles
- 2024: R+10.0 2020: R+0.0 2016: R+8.2 2012: D+2.9 2008: D+6.0
Not yet ingested
- Civics
- —
Market trends
- HPI YoY
- ▼ -143.97%
- Current HPI
- 462.3431
- Rent YoY
- —
- Metro
- —
- State GDP YoY
- ▲ 2.60%
- F500 in state
- 92
Industry mix (Fortune 500 HQ in NY)
| Industry | F500 HQs | Revenue |
|---|---|---|
| Financial Services | 10 | $950B |
|
||
| Consumer Goods | 9 | $162B |
|
||
| Insurance | 4 | $225B |
|
||
| Telecommunications | 2 | $144B |
|
||
| Pharmaceuticals | 2 | $112B |
|
||
| Media / Entertainment | 2 | $69B |
|
||
Price history
+1175.0% since first listed3 events — show timeline
- 2026-04-30 Listed $1,785,000 OneKey® MLS as Distributed by MLS Grid
- 2008-05-14 Sold (Public Records) $845,900 Public Records
- 2002-09-26 Sold (Public Records) $140,000 Public Records
Property tax history
+2.7%/yrLatest (2025): $14,096 · +0.0% YoY. Source: county tax records.
Cash-flow waterfall
monthlySold comps — $/sqft
last 12 mo · ≤1 miLoading sold comps…