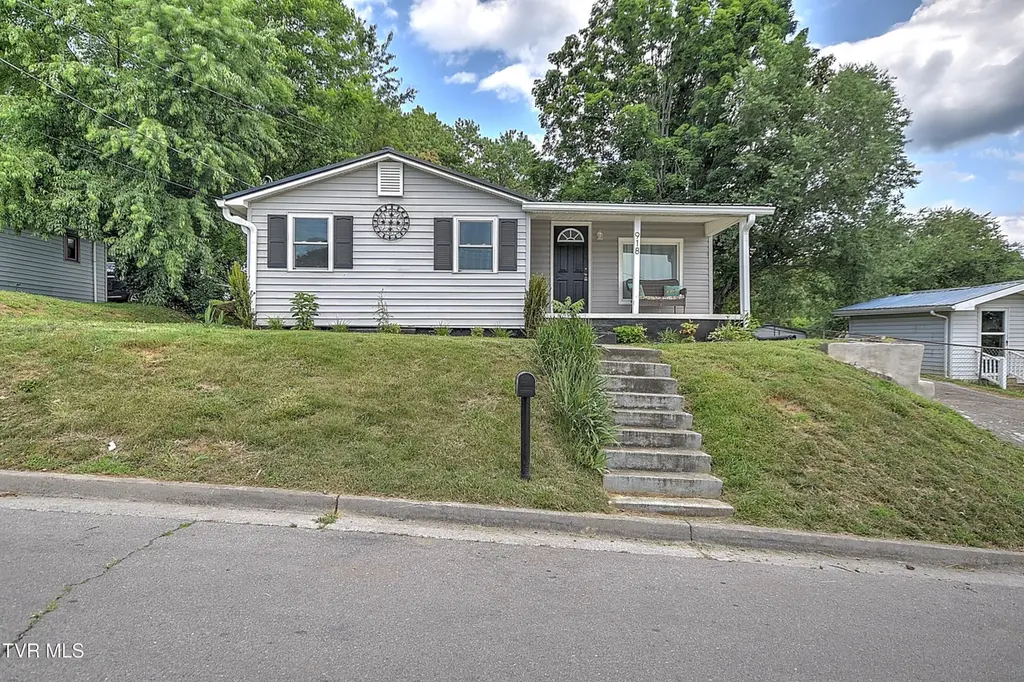
918 Cedar Ave · Elizabethton, TN
Flood risk 1/10 · Minimal
- FEMA flood zone
- X (unshaded)
- Chance of flooding over 30 yrs
- 0.0%
- Est. flood insurance / yr
- $507 – $1,088
Fire risk 2/10 · Minimal
- Est. fire insurance / yr
- $949 – $1,763
Heat risk 4/10 · Minor
- Hot days now (above 97°F)
- 7 days/yr
- Hot days in 30 yrs
- 20 days/yr
Wind risk 2/10 · Minimal
- Chance of severe wind over 30 yrs
- —
Air-quality risk 2/10 · Minimal
- Unhealthy air days now
- 1 days/yr
- Unhealthy air days in 30 yrs
- 1 days/yr
Risk factors via First Street. Map © Google.
Why this score? — see what drove the D+ grade
The composite is a weighted blend of 9 inputs, each scored 0–100. Each bar is that input's sub-score; the figure is the points it added to the 100-point composite (weight × sub-score).
- Cash flow +14.5/30.0
- ARV discount +13.5/15.0
- DSCR +4.4/10.0
- Livability +3.3/5.0
- 1% rule +2.9/10.0
- Schools +2.9/10.0
- Rent growth +2.5/5.0
- Condition / age +2.5/5.0
- Appreciation +0.0/10.0
$219,900
🖨 Deal sheet 📄 Offer letter ✓ Due diligence
Listing remarks
Looking for a turn-key home in the heart of Elizabethton? Don't miss this one! Completely remodeled, this cute cottage has been fully updated and offers 3 bedrooms, 2 full bathrooms, and over 1,400+ sq ft of finished living space, all on one level. Inside, the home has been updated with fresh paint, new flooring, and updated lighting that sets the tone, while a refreshed kitchen anchors the space with stainless appliances, butcher-block countertops, and open shelving. Elevating the home even further, both bathrooms have been tastefully updated--creating a clean, modern interior that's truly move-in ready. Offering a thoughtful layout, this home includes four bedrooms total, highlighted by a
Key facts
- Stainless appliances
- Remodeled cottage
- Turn-key home
Tags
Property features AI
Exterior
- Parking: Gravel parking
- Utilities: Public water; Public sewer
- Home design: Single-family house; One story; Residential zoning; Updated/remodeled condition
- Construction: Vinyl siding; Metal roof; Built with standard house foundation
- Exterior features: Covered patio/porch; Shed(s) on property; Level and sloped topography
Interior
- Kitchen: Dishwasher; Electric range; Microwave; Refrigerator
- Bathrooms: 2 full bathrooms
- Heating & cooling: Heat pump heating; Heat pump cooling
- Interior features: Updated/remodeled interior; See remarks
- Laundry & utility: Washer hookup; Electric dryer hookup
Neighborhood map
What this means for you Summary
Snapshot
- This is a 3-bed/1.0-bath single-family listed at $220k.
Deal economics
- At list price, monthly cash flow is $47 ($566/yr) — positive.
- The deal already cash-flows at list — no discount required.
- To meet the 1% rule (rent ≥ 1% of price), the offer needs to be $174k (20.9% below list).
- Recommended offer: $174k (20.9% below list) — sets the bar for 1% rule.
- Cap rate 6.6% vs local median 3.7% in Elizabethton — top-decile yield for the area; either an underpriced asset or a hidden risk that comps aren't pricing in. Stress-test before assuming the spread holds.
Location & tenants
- Location reads 66/100 on livability (#121 in TN) — a middle-class / working-renter tenant base. Strengths: cost of living A+, housing A, crime A-; Watch: amenities F, commute F, employment F.
- Elizabethton (suburban): math 36% / reading 35% proficiency, ranked #35 of 139 in TN (top 25%) — families likely to look elsewhere, expect single-tenant / working-renter base with shorter leases.
- Zoned schools: Harold Mccormick Elementary (math 27% / reading 32%, grade F, #423 of 952 statewide, top 48%, 380 students, 0% FRL); T A Dugger Junior High School (math 42% / reading 28%, grade F, #65 of 333 statewide, top 20%, 633 students, 0% FRL); Elizabethton High School (math 17% / reading 41%, grade F, #92 of 332 statewide, top 28%, 863 students, 0% FRL) — zoned schools average 0% FRL vs 43% district-wide (43 pts lower); this property's tenant base skews higher-income than the district average.
- Market conditions: 173 active listings in the ZIP; 3 comparable units currently listed for rent nearby; rentals leasing fast (median 14d on market — plan ~1-2 weeks tenant-placement turnaround); 184 units permitted in Carter County in 2024 (0 in 5+ unit buildings).
Forward outlook
- Local home prices are declining (-3.0%/yr); year-one equity from $2k of loan paydown is wiped out by about $7k of value loss. Plan a longer hold.
- Carter County population projected at -21% by 2050 — secular population decline; favor cash flow + early exit over multi-decade hold.
Negotiation context
- Only 14 days on market — expect competitive offers; lowballing is unlikely to land.
- Current owner paid $102k; list at $220k implies a 115% gain — meaningful room to come down on a strong offer.
Risks & watch-outs
- Watch-outs: built in 1950 — expect roof / HVAC / electrical / plumbing capex.
Questions for the listing agent
- Built in 1950 — when were the roof, HVAC, electrical panel, plumbing, and water heater last replaced?
- Is there a deadline driving the sale (1031 exchange, divorce, estate, relocation)? That informs how much negotiation room exists.
- Schools are D-rated, which usually means shorter tenancies and higher turnover. Who's the typical renter profile here, and what's been the actual vacancy rate?
- The area grade is low — what's the realistic commute time and amenity access for the typical tenant pool here? Any planned neighborhood developments (good or bad) we should know about?
- What's the average days-on-market for RENTAL listings here right now (not sales)? A rising rental-DOM trend means longer vacancies and softer asking-rent achievability than the comps imply.
- What's the recent tenant-quality profile in this submarket — average credit score on applications, eviction rate, late-payment / NSF rate, and stable-employment percentage? A property-management company in the area should have these aggregated.
- How much new for-sale + rental construction is in the pipeline within 1–3 miles? Heavy new supply typically softens prices + rents 12–24 months out; constrained supply supports both.
Investment metrics
- 1% rule
- 0.79% ✗
- Cap rate
- 6.55%
- Cash-on-cash
- 0.92%
- DSCR
- 1.04
- GRM
- 10.5
CMA / ARV
- ARV (on-the-fly)
- $253,440
- Comps found
- 12
Show comp detail 12 sales within ~0.75 mi
| Address | Dist | Beds/Ba | Sqft | Sold | Price | $/sf | Match |
|---|---|---|---|---|---|---|---|
| 614 Roan St | 0.36mi | 3/1.0 | 1,425 (-1%) | 6mo | $205,000 | $144 | 77 |
| 602 Bradley St | 0.17mi | 3/1.5 | 1,485 (+3%) | 11mo | $240,000 | $162 | 75 |
| 604 2nd St | 0.21mi | 3/2.0 | 1,482 (+3%) | 10mo | $257,000 | $173 | 73 |
| 607 Bradley St | 0.17mi | 4/1.0 (+1) | 1,404 (-2%) | 13mo | $230,900 | $164 | 72 |
| 405 Watauga Avenue Ave | 0.39mi | 3/1.0 | 1,397 (-3%) | 9mo | $239,900 | $172 | 69 |
| 609 Watauga Ave | 0.28mi | 3/2.0 | 1,334 (-7%) | 3mo | $295,000 | $221 | 68 |
| 700a Johnson Ave | 0.26mi | 3/2.0 | 1,300 (-10%) | 2mo | $270,000 | $208 | 66 |
| 722 Watauga Ave | 0.20mi | 3/2.0 | 1,264 (-12%) | 7mo | $260,000 | $206 | 61 |
| 310 2nd St | 0.33mi | 2/1.0 (-1) | 1,325 (-8%) | 9mo | $179,900 | $136 | 59 |
| 718 Lynn Ave | 0.14mi | 3/2.5 | 1,650 (+15%) | 9mo | $292,000 | $177 | 56 |
| 509 Bingham St | 0.18mi | 3/2.0 | 1,225 (-15%) | 8mo | $215,000 | $176 | 56 |
| 401 H St | 0.74mi | 3/3.0 | 1,648 (+14%) | 13mo | $340,000 | $206 | 23 |
Match score weights: distance 35% · size 25% · config 20% · recency 20%. Top-matched comps best support the ARV.
Projected returns pro-forma
-3.0% appreciation · 3.0% rent growth · sell at horizon
- IRR
- -14.9%
- Equity multiple
- 0.47×
- Total profit
- $-32,719
- Equity at exit
- $32,788
- IRR
- -6.3%
- Equity multiple
- 0.59×
- Total profit
- $-24,993
- Equity at exit
- $19,013
Cash invested: $61,572 (down + closing). Projections, not guarantees.
Landlord ↔ Tenant lean methodology
- Overall (STATE)
- 87 Strongly Landlord-Friendly
- State Tennessee
- 87 Strongly Landlord-Friendly · R+13
- County
- — inherits STATE
- City
- — inherits STATE
ZIP-level market 37643
- Home prices YoY
- -19.3%
- Active inventory
- 173
- Price-to-rent
- 10.5×
Monthly cashflow live
- Estimated rent
- $1,740 medium interval (Pro) →
- Mortgage (P&I)
- −$1,153
- Tax from tax record
- −$83 /mo · $992/yr
- Insurance
- −$92
- HOA
- −$0
- Vacancy / Maint / Mgmt
- −$365
- Net cashflow
- $47
Break-even live
UW: 25.0% down · 7.5% · 30yr · 1.5% tax · 5.0% vac · 8.0% maint · 8.0% mgmt
Financing live
Cash to close
- Down payment
- $54,975
- Closing costs
- $6,597
- Reserves months
- —
- Total cash needed
- —
Loan-product check · same deal, 3 products live
Conventional
25% down · 7.5% · 30yr
- Down + closing
- —
- Monthly P&I
- —
- Monthly cashflow
- —
- DSCR
- —
- Eligible?
- —
Personal DTI + credit; lowest rate.
DSCR
20% down · 8.5% · 30yr
- Down + closing
- —
- Monthly P&I
- —
- Monthly cashflow
- —
- DSCR
- —
- Eligible?
- —
No personal income docs; deal must DSCR.
Hard money
10% down · 12.0% · 12mo
- Down + closing
- —
- Monthly P&I
- —
- Monthly cashflow
- —
- DSCR
- —
- Eligible?
- —
Short-term bridge; refi at stabilization.
Rent comps 3 comps
| Address | Beds | Baths | Sqft | Rent | $/sqft | DOM | Units | Dist |
|---|---|---|---|---|---|---|---|---|
| 107 Ingram St Elizabethton, TN | 3.0 | 2.0 | 1500 | $2,000 | $1.33 | 13d | 1 | 0.77mi |
| 1541 Southside Rd Apt 4 Elizabethton, TN | 3.0 | 2.0 | 1300 | $1,398 | $1.08 | 13d | 1 | 0.86mi |
| 600 Pine Hill Rd Elizabethton, TN | 2.0 | 1.0 | 1200 | $1,800 | $1.50 | 13d | 1 | 1.36mi |
Listing history 12 events
-
2026-06-19days on market $219,900 Active 14 DOM
-
2026-06-18days on market $219,900 Active 13 DOM
-
2026-06-17days on market $219,900 Active 12 DOM
-
2026-06-16days on market $219,900 Active 11 DOM
-
2026-06-15days on market $219,900 Active 10 DOM
-
2026-06-14days on market $219,900 Active 8 DOM
-
2026-06-13days on market $219,900 Active 7 DOM
-
2026-06-10days on market $219,900 Active 5 DOM
-
2026-06-09days on market $219,900 Active 4 DOM
-
2026-06-08days on market $219,900 Active 3 DOM
-
2026-06-07remarks 699-char remark
-
2026-06-07$219,900 Active 2 DOM
ⓘ Source: listings_history table (triggers on properties + properties_extension) + one-shot
backfill from property_details.listing_events for pre-trigger history.
Tax reassessment forecast TN · Resets to sale price
- Current annual tax
- $992 · $83/mo
- Projected year-2 tax
- $1,561 · $130/mo
- Expected delta
- +$569/yr (+$47/mo · 57.4%)
ⓘ Screening estimate from a state-policy table — verify with the county assessor before closing.
Climate risk First Street
- Flood 1/10 Low FEMA zone X (unshaded) · 0% chance over 30 yrs
- Wildfire 2/10 Low
- Heat 4/10 Moderate 7 d/yr ≥97°F today · 20 d/yr by 30 yrs out
- Wind 2/10 Low
- Air quality 2/10 Low 1 unhealthy d/yr today · 1 by 30 yrs out
Nearby sold comps map
Loading sold comps map…
Walkable amenities ~0.75 mi
Loading nearby amenities…
Taxation est. · year 1
- Rental income
- $20,881
- − Mortgage interest
- −$12,318
- − Property taxes
- −$992
- − Insurance
- −$1,100
- − Repairs & maintenance
- −$1,670
- − Management
- −$1,670
- − Depreciation
- −$6,397
- Taxable loss
- −$3,266
- Est. tax savings @ 24.0%
- +$784
- After-tax cash flow
- $1,350/yr
For passive investors: Depreciation is non-cash, so a rental often shows a tax loss while cash-flowing — sheltering income. Rental losses are passive: they offset passive income freely, and up to $25,000/yr can offset ordinary (W-2) income if you actively participate and your MAGI is under $100k (phasing out to $0 by $150k); unused losses carry forward. On sale, claimed depreciation is recaptured at up to 25%, and gains may owe capital-gains tax (a 1031 exchange can defer both). Figures are a year-1 estimate at your 24.0% rate — not tax advice; consult a CPA.
Schools (NCES district)
- District
- Elizabethton
- NCES district ID
- 4701110
- Math proficiency
- 36% ▼ -12.00%
- Reading proficiency
- 35% ▼ -8.00%
- Median HH income
- $30,800
- Composite
- 28.94/100
- National rank
- #6630
- State rank
- #35 of 139 in TN
Livability — Elizabethton
- Score
- 66/100
- State rank
- #121
- US rank
- #11785
Category grades
Schools grade is shown separately in the Schools card above.
Census & demographics
- Census place
- Elizabethton, TN
- City population
- 513
- Population (ZIP)
- 33,690
Population outlook (Carter County) Hauer SSP2
- Today (2025)
- 54,493 people
- By 2030
- 52,639 · -3.4%
- By 2040
- 47,929 · -12.0%
- By 2050
- 42,877 · -21.3%
- By 2075
- 31,487 · -42.2%
- By 2100
- 21,979 · -59.7%
Race, ethnicity, and origin ACS 2023
- Neighborhood character
- Predominantly White (93%)
- Race & ethnicity
- White 93% Two or more races 3% Hispanic / Latino 3% Black 2%
- Common ancestry
- Serbian 3% Slovak 2% Italian 2%
- Foreign-born
- 2% · Canada
- Languages at home
- 98% English-only · Spanish 2%
Political lean MEDSL · Carter
- 2024 margin
- Solid R (+63.2) · D 17.9% · R 81.2%
- 2008→2024 swing
- -16.1pp toward R · 2008: -47.2pp · 2024: -63.2pp
- All cycles
- 2024: R+63.2 2020: R+61.5 2016: R+64.0 2012: R+52.0 2008: R+47.2
Not yet ingested
- Civics
- —
Market trends
- HPI YoY
- ▼ -77.08%
- Current HPI
- 321.4024
- Rent YoY
- —
- Metro
- —
- State GDP YoY
- ▲ 2.78%
- F500 in state
- 22
Industry mix (Fortune 500 HQ in TN)
| Industry | F500 HQs | Revenue |
|---|---|---|
| Healthcare | 3 | $91B |
|
||
| Retail | 3 | $72B |
|
||
| Transportation / Logistics | 1 | $88B |
|
||
| Paper / Packaging | 1 | $19B |
|
||
| Insurance | 1 | $13B |
|
||
| Energy | 1 | $12B |
|
||
Price history
+1193.5% since first listed8 events — show timeline
- 2026-06-05 Listed $219,900 TVRMLS
- 2026-01-23 Price Changed $219,900 TVRMLS
- 2025-09-24 Sold (Public Records) $102,500 Public Records
- 2025-08-09 Price Changed $156,000 TVRMLS
- 2025-07-27 Price Changed $164,000 TVRMLS
- 2025-07-16 Price Changed $169,000 TVRMLS
- 2019-03-04 Sold (Public Records) $65,300 Public Records
- 2016-02-02 Sold (Public Records) $17,000 Public Records
Property tax history
+4.9%/yrLatest (2025): $992 · +38.7% YoY. Source: county tax records.
Cash-flow waterfall
monthlySold comps — $/sqft
last 12 mo · ≤1 miLoading sold comps…