18485 SW Pacific Dr · Tualatin, OR
Flood risk 1/10 · Minimal
- FEMA flood zone
- X (unshaded)
- Chance of flooding over 30 yrs
- 0.0%
- Est. flood insurance / yr
- $507 – $1,088
Fire risk 3/10 · Minor
- Est. fire insurance / yr
- $498 – $926
Heat risk 3/10 · Minor
- Hot days now (above 92°F)
- 7 days/yr
- Hot days in 30 yrs
- 14 days/yr
Wind risk 1/10 · Minimal
- Chance of severe wind over 30 yrs
- —
Air-quality risk 9/10 · Severe
- Unhealthy air days now
- 12 days/yr
- Unhealthy air days in 30 yrs
- 13 days/yr
Risk factors via First Street. Map © Google.
Why this score? — see what drove the B grade
The composite is a weighted blend of 9 inputs, each scored 0–100. Each bar is that input's sub-score; the figure is the points it added to the 100-point composite (weight × sub-score).
- Cash flow +30.0/30.0
- 1% rule +10.0/10.0
- DSCR +10.0/10.0
- ARV discount +7.5/15.0
- Schools +5.6/10.0
- Livability +4.3/5.0
- Condition / age +2.5/5.0
- Rent growth +1.7/5.0
- Appreciation +0.0/10.0
$72,000
🖨 Deal sheet 📄 Offer letter ✓ Due diligence
Listing remarks MLS
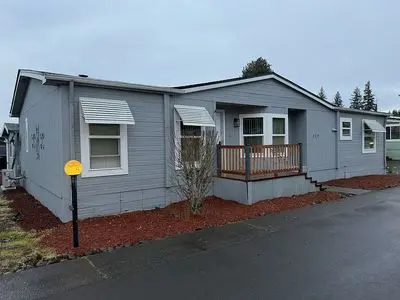
BEAUTIFUL 3BR/2BA GOLDEN WEST MFG HOME IN GREAT SR PARK!TAPE/TEXTURED! 6" CONST! 21X13 LIV RM! LG KIT W/EATING BAR & OAK! LOVELY MASTER SUITE! NEW EXT PAINT! VERY WELL CARED FOR! NEWER QUIET PK! TUALATIN. $19,850!
Key facts
- Move-in ready
- Central heat
- New flooring
Tags
Property features AI
Finance
- Other: Living area approximately 1404 square feet
Exterior
- Utilities: Utilities information not provided
- Home design: Built in 1986; Single-family home
- Construction: Construction details not provided
- Exterior features: Located in the Sherwood - Tualatin North subdivision
Neighborhood map
What this means for you Summary
Snapshot
- This is a 4-bed/2.0-bath land listed at $72k.
Deal economics
- At list price, monthly cash flow is $2k ($19k/yr) — positive.
- The deal already cash-flows at list — no discount required.
- Meets the 1% rule at list price ($3k rent vs $72k).
- Recommended offer: $70k (3.0% below list) — sets the bar for market timing.
- Cap rate 32.8% vs local median 2.6% in Tualatin — top-decile yield for the area; either an underpriced asset or a hidden risk that comps aren't pricing in. Stress-test before assuming the spread holds.
Location & tenants
- Location reads 86/100 on livability (#16 in OR, #355 nationally) — a professional / high-income tenant draw. Strengths: amenities A+, commute A+, employment A+; Watch: cost of living F.
- Sherwood SD 88J (suburban): math 56% / reading 66% proficiency, ranked #5 of 58 in OR (top 9%) — acceptable for families but not a draw, mixed tenant base, ~2y average lease; only 14% free/reduced lunch — higher-income household profile.
- Market conditions: Rents falling (-3.0%/yr); 142 active listings in the ZIP; 6 comparable units currently listed for rent nearby; rentals leasing fast (median 2d on market — plan ~1-2 weeks tenant-placement turnaround); solid renter incomes; 2,224 units permitted in Washington County in 2024 (242 in 5+ unit buildings).
- This rent runs 30% of the median local income ($105k/yr) — at the standard rent-burdened threshold; future hikes will face affordability resistance.
Forward outlook
- Local home prices are declining (-3.0%/yr); year-one equity from $498 of loan paydown is wiped out by about $2k of value loss. Plan a longer hold.
- Washington County population projected at +33% by 2050 — long-run rental-demand tailwind backs the buy-and-hold thesis.
- At projected returns (-3.0% appreciation + 0.0% rent growth), your $20k cash investment doubles in ~2 years — after that, you're playing with house money.
Negotiation context
- It's been on market 37 days — a 3% lower offer ($70k) is reasonable based on typical stale-listing flexibility.
- 2 sale attempts since 23y ago with the ask held roughly flat each time — persistent listings suggest the price (not the market) is what's stuck; bring a comps-based counter.
- Current owner paid $20k; list at $72k implies a 263% gain — meaningful room to come down on a strong offer.
Questions for the listing agent
- It's been on market 37 days. Have you received any prior offers? Is the seller open to a 3% concession, seller financing, or rate buy-down credit?
- Is there a deadline driving the sale (1031 exchange, divorce, estate, relocation)? That informs how much negotiation room exists.
- Schools are B-rated — typically a magnet for longer-tenancy family renters. What's the average tenant stay here, and is there a school-zone premium baked into asking?
- What's the average days-on-market for RENTAL listings here right now (not sales)? A rising rental-DOM trend means longer vacancies and softer asking-rent achievability than the comps imply.
- What's the recent tenant-quality profile in this submarket — average credit score on applications, eviction rate, late-payment / NSF rate, and stable-employment percentage? A property-management company in the area should have these aggregated.
- How much new for-sale + rental construction is in the pipeline within 1–3 miles? Heavy new supply typically softens prices + rents 12–24 months out; constrained supply supports both.
Investment metrics
- 1% rule
- 3.67% ✓
- Cap rate
- 32.81%
- Cash-on-cash
- 94.69%
- DSCR
- 5.21
- GRM
- 2.3
CMA / ARV
No comps found within radius.
Projected returns pro-forma
-3.0% appreciation · 0.0% rent growth · sell at horizon
- IRR
- 92.1%
- Equity multiple
- 5.06×
- Total profit
- $81,947
- Equity at exit
- $10,735
- IRR
- 94.4%
- Equity multiple
- 9.53×
- Total profit
- $172,047
- Equity at exit
- $6,225
Cash invested: $20,160 (down + closing). Projections, not guarantees.
Landlord ↔ Tenant lean methodology
- Overall (STATE)
- 28 Tenant-Leaning
- State Oregon
- 28 Tenant-Leaning · D+6
- County
- — inherits STATE
- City
- — inherits STATE
ZIP-level market 97062
- Rents YoY
- -3.0%
- Active inventory
- 142
- Price-to-rent
- 2.3×
Monthly cashflow live
- Estimated rent
- $2,644 high interval (Pro) →
- Mortgage (P&I)
- −$378
- Tax est. 1.5%
- −$90 /mo · $1,080/yr
- Insurance
- −$30
- HOA
- −$0
- Vacancy / Maint / Mgmt
- −$555
- Net cashflow
- $1,591
Break-even live
UW: 25.0% down · 7.5% · 30yr · 1.5% tax · 5.0% vac · 8.0% maint · 8.0% mgmt
Financing live
Cash to close
- Down payment
- $18,000
- Closing costs
- $2,160
- Reserves months
- —
- Total cash needed
- —
Loan-product check · same deal, 3 products live
Conventional
25% down · 7.5% · 30yr
- Down + closing
- —
- Monthly P&I
- —
- Monthly cashflow
- —
- DSCR
- —
- Eligible?
- —
Personal DTI + credit; lowest rate.
DSCR
20% down · 8.5% · 30yr
- Down + closing
- —
- Monthly P&I
- —
- Monthly cashflow
- —
- DSCR
- —
- Eligible?
- —
No personal income docs; deal must DSCR.
Hard money
10% down · 12.0% · 12mo
- Down + closing
- —
- Monthly P&I
- —
- Monthly cashflow
- —
- DSCR
- —
- Eligible?
- —
Short-term bridge; refi at stabilization.
Rent comps 6 comps
| Address | Beds | Baths | Sqft | Rent | $/sqft | DOM | Units | Dist |
|---|---|---|---|---|---|---|---|---|
| 17335 SW Montague Way Portland, OR | 3.0 | 2.5 | 1687 | $3,175 | $1.88 | 2d | 1 | 0.47mi |
| 17865 SW Pacific Hwy Tualatin, OR | 1.0–3.0 | 1.0–2.0 | 970 | $2,242 | $2.31 | 2d | 13 | 0.51mi |
| 16903 SW 133rd Ter Portland, OR | 3.0 | 2.5 | 1665 | $2,845 | $1.71 | 10d | 1 | 0.66mi |
| 11865 SW Tualatin Rd Tualatin, OR | 2.0–3.0 | 2.0–2.5 | 1154 | $2,737 | $2.37 | 2d | 19 | 0.82mi |
| 12070 SW Fischer Rd Portland, OR | 1.0–3.0 | 1.0–2.0 | 925 | $2,099 | $2.27 | 2d | 9 | 0.91mi |
| 13830 SW Chinn Ln Portland, OR | 1.0–3.0 | 1.0–2.0 | 839 | $2,100 | $2.50 | 3d | 11 | 1.14mi |
Listing history 17 events
-
2026-06-18days on market $72,000 Active 37 DOM
-
2026-06-17days on market $72,000 Active 36 DOM
-
2026-06-16days on market $72,000 Active 35 DOM
-
2026-06-15days on market $72,000 Active 34 DOM
-
2026-06-13days on market $72,000 Active 32 DOM
-
2026-06-13days on market $72,000 Active 31 DOM
-
2026-06-09days on market $72,000 Active 28 DOM
-
2026-06-08days on market $72,000 Active 27 DOM
-
2026-06-07days on market $72,000 Active 26 DOM
-
2026-06-03days on market $72,000 Active 22 DOM
-
2026-06-02days on market $72,000 Active 21 DOM
-
2026-06-01days on market $72,000 Active 20 DOM
-
2026-05-31days on market $72,000 Active 19 DOM
-
2026-05-12$72,000 Active 1315-char remark
-
2003-06-06soldstatus $19,850 222-char remark
Show marketing remark (222 chars)
BEAUTIFUL 3BR/2BA GOLDEN WEST MFG HOME IN GREAT SR PARK!TAPE/TEXTURED! 6" CONST! 21X13 LIV RM! LG KIT W/EATING BAR & OAK! LOVELY MASTER SUITE! NEW EXT PAINT! VERY WELL CARED FOR! NEWER QUIET PK! TUALATIN. $19,850!
-
2003-04-10$19,850 222-char remark
Show marketing remark (222 chars)
BEAUTIFUL 3BR/2BA GOLDEN WEST MFG HOME IN GREAT SR PARK!TAPE/TEXTURED! 6" CONST! 21X13 LIV RM! LG KIT W/EATING BAR & OAK! LOVELY MASTER SUITE! NEW EXT PAINT! VERY WELL CARED FOR! NEWER QUIET PK! TUALATIN. $19,850!
-
1985-12-01soldstatus $115,000
ⓘ Source: listings_history table (triggers on properties + properties_extension) + one-shot
backfill from property_details.listing_events for pre-trigger history.
Climate risk First Street
- Flood 1/10 Low FEMA zone X (unshaded) · 0% chance over 30 yrs
- Wildfire 3/10 Moderate
- Heat 3/10 Moderate 7 d/yr ≥92°F today · 14 d/yr by 30 yrs out
- Wind 1/10 Low
- Air quality 9/10 Extreme 12 unhealthy d/yr today · 13 by 30 yrs out
Nearby sold comps map
Loading sold comps map…
Walkable amenities ~0.75 mi
Loading nearby amenities…
Taxation est. · year 1
- Rental income
- $31,723
- − Mortgage interest
- −$4,033
- − Property taxes
- −$1,080
- − Insurance
- −$360
- − Repairs & maintenance
- −$2,538
- − Management
- −$2,538
- − Depreciation
- −$2,095
- Taxable income
- $19,079
- Est. tax owed @ 24.0%
- −$4,579
- After-tax cash flow
- $14,511/yr
For passive investors: Depreciation is non-cash, so a rental often shows a tax loss while cash-flowing — sheltering income. Rental losses are passive: they offset passive income freely, and up to $25,000/yr can offset ordinary (W-2) income if you actively participate and your MAGI is under $100k (phasing out to $0 by $150k); unused losses carry forward. On sale, claimed depreciation is recaptured at up to 25%, and gains may owe capital-gains tax (a 1031 exchange can defer both). Figures are a year-1 estimate at your 24.0% rate — not tax advice; consult a CPA.
Schools (NCES district)
- District
- Sherwood SD 88J
- NCES district ID
- 4111290
- Math proficiency
- 56% ▼ -14.00%
- Reading proficiency
- 66% ▼ -11.00%
- Median HH income
- $88,369
- Composite
- 55.54/100
- National rank
- #1242
- State rank
- #5 of 58 in OR
Livability — Tualatin
- Score
- 86/100
- State rank
- #16
- US rank
- #355
Category grades
Schools grade is shown separately in the Schools card above.
Census & demographics
- Census place
- Tualatin, OR
- County
- Washington County · 583,254 people
- City population
- 28,930
- Metro
- Portland-Vancouver-Hillsboro, OR-WA
- Population (ZIP)
- 28,930
- Household income
- $105,407
- Rent vs Own
- Severe rent burden
- 1218.0
Population outlook (Washington County) Hauer SSP2
- Today (2025)
- 674,042 people
- By 2030
- 721,804 · +7.1%
- By 2040
- 812,732 · +20.6%
- By 2050
- 895,143 · +32.8%
- By 2075
- 1,058,806 · +57.1%
- By 2100
- 1,131,692 · +67.9%
Race, ethnicity, and origin ACS 2023
- Neighborhood character
- Predominantly White (66%)
- Race & ethnicity
- White 66% Hispanic / Latino 21% Two or more races 14% Asian 3% Pacific Islander 2% Black 1%
- Hispanic origin (detail)
- Mexican 17%
- Common ancestry
- Portuguese 4% Italian 4% Slovak 2%
- Foreign-born
- 12% · Canada, Vietnam, China
- Languages at home
- 77% English-only · Spanish 16% Other Asian/Pacific 2% Other Indo-European 1%
Political lean MEDSL · Washington
- 2024 margin
- Solid D (+34.0) · D 65.3% · R 31.3% · Other 3.4%
- 2008→2024 swing
- +11.8pp toward D · 2008: 22.1pp · 2024: 34.0pp
- All cycles
- 2024: D+34.0 2020: D+34.6 2016: D+26.7 2012: D+17.5 2008: D+22.1
Not yet ingested
- Civics
- —
Market trends
- HPI YoY
- ▼ -346.49%
- Current HPI
- 279.0431
- Rent YoY
- ▼ -3.03%
- Metro
- Portland-Vancouver-Hillsboro, OR-WA
- State GDP YoY
- ▲ 2.05%
- F500 in state
- 2
Industry mix (Fortune 500 HQ in OR)
| Industry | F500 HQs | Revenue |
|---|---|---|
| Consumer Goods | 1 | $51B |
|
||
Price history
-37.4% since first listed4 events — show timeline
- 2026-05-12 Listed $72,000 FSBO.com
- 2003-06-06 Sold (MLS) $19,850 RMLS
- 2003-04-10 Listed $19,850 RMLS
- 1985-12-01 Sold (Public Records) $115,000 Public Records
Property tax history
+33.7%/yrLatest (2025): $44,923 · +3.9% YoY. Source: county tax records.
Cash-flow waterfall
monthlySold comps — $/sqft
last 12 mo · ≤1 miLoading sold comps…