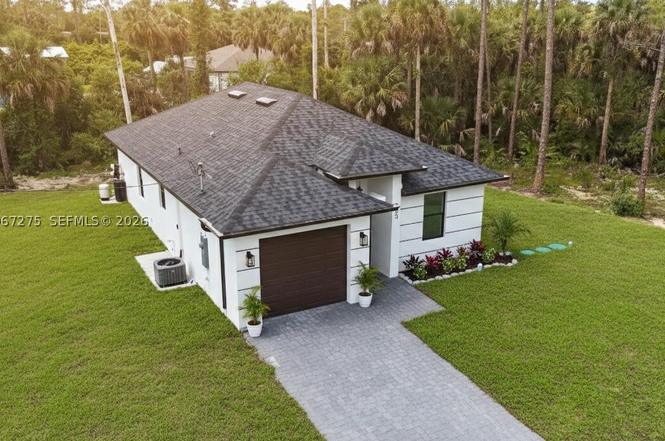
505 W 10 St · Lehigh Acres, FL
Flood risk No data
- FEMA flood zone
- —
- Chance of flooding over 30 yrs
- —
- Est. flood insurance / yr
- —
Fire risk No data
- Est. fire insurance / yr
- —
Heat risk No data
- Hot days now (above threshold)
- —
- Hot days in 30 yrs
- —
Wind risk No data
- Chance of severe wind over 30 yrs
- —
Air-quality risk No data
- Unhealthy air days now
- —
- Unhealthy air days in 30 yrs
- —
Risk factors via First Street. Map © Google.
Why this score? — see what drove the D- grade
The composite is a weighted blend of 9 inputs, each scored 0–100. Each bar is that input's sub-score; the figure is the points it added to the 100-point composite (weight × sub-score).
- Cash flow +11.5/30.0
- ARV discount +7.5/15.0
- Schools +4.1/10.0
- Rent growth +3.8/5.0
- DSCR +3.4/10.0
- Livability +3.0/5.0
- Condition / age +2.5/5.0
- 1% rule +2.0/10.0
- Appreciation +0.0/10.0
$285,000
🖨 Deal sheet 📄 Offer letter ✓ Due diligence
Listing remarks MLS
Many new homes being built in this area. The same seller has many others home sites available and will discount for bulk sale.
Key facts
- New construction
- Open-concept layout
- Garage
Tags
Property features AI
Exterior
- Parking: Driveway; 1 covered parking space; 1-car garage
- Security: High-impact doors
- Utilities: Well water; Septic tank
- Home design: Single-story; New construction
- Construction: Block construction; Shingle roof
- Exterior features: Security / high-impact doors; Room for a pool; Quarter- to half-acre lot; Residential zoning; East-facing
Interior
- Kitchen: Electric range; Microwave; Dishwasher; Refrigerator
- Flooring: Tile flooring
- Bathrooms: 2 full bathrooms
- Heating & cooling: Central heating; Central air conditioning
- Interior features: First-floor entry; Bedroom on main level
- Laundry & utility: Washer; Dryer; Utility room; Laundry room; Electric water heater
Neighborhood map
What this means for you Summary
Snapshot
- This is a 3-bed/2.0-bath land listed at $285k.
Deal economics
- At list price, monthly cash flow is $-94 ($-1k/yr) — negative.
- To cash-flow at today's rent, offer at most $268k (5.8% below list).
- To meet the 1% rule (rent ≥ 1% of price), the offer needs to be $200k (29.7% below list).
- Recommended offer: $200k (29.7% below list) — sets the bar for 1% rule.
- Cap rate 5.9% vs local median 4.7% in Lehigh Acres — meaningfully above typical; check what's discounted (condition, days-on-market, listing class) to confirm the premium yield is real.
Location & tenants
- Location reads 59/100 on livability (#826 in FL) — a working-class tenant base; expect higher turnover. Strengths: cost of living A+, housing A+; Watch: crime C-, employment D+, schools D-.
- Lee (suburban): math 47% / reading 50% proficiency, ranked #42 of 73 in FL (top 58%) — families likely to look elsewhere, expect single-tenant / working-renter base with shorter leases.
- Market conditions: Rents rising fast (+5.3%/yr); 1611 active listings in the ZIP; 22 comparable units currently listed for rent nearby; rentals at typical pace (median 24d on market — plan ~3-4 weeks tenant-placement turnaround); 15,411 units permitted in Lee County in 2024 (4,686 in 5+ unit buildings).
- This rent runs 33% of the median local income ($74k/yr) — at the standard rent-burdened threshold; future hikes will face affordability resistance.
Forward outlook
- Local home prices are declining (-3.0%/yr); year-one equity from $2k of loan paydown is wiped out by about $9k of value loss. Plan a longer hold.
- Lee County population projected at +44% by 2050 — long-run rental-demand tailwind backs the buy-and-hold thesis.
Negotiation context
- It's been on market 120 days — a 9% lower offer ($259k) is reasonable based on typical stale-listing flexibility.
- 4 sale attempts since 3y ago with the ask held roughly flat each time — persistent listings suggest the price (not the market) is what's stuck; bring a comps-based counter.
- Current owner paid $15k; list at $285k implies a 1800% gain — meaningful room to come down on a strong offer.
Questions for the listing agent
- What do current leases actually rent for vs. the listed asking? Can we see a recent rent roll and the last 12 months of T-12 income?
- It's been on market 120 days. Have you received any prior offers? Is the seller open to a 30% concession, seller financing, or rate buy-down credit?
- Why hasn't it sold? Are there any deal-killer items the seller is aware of (foundation, flood, title, zoning, code violations)?
- Is there a deadline driving the sale (1031 exchange, divorce, estate, relocation)? That informs how much negotiation room exists.
- Schools are D-rated, which usually means shorter tenancies and higher turnover. Who's the typical renter profile here, and what's been the actual vacancy rate?
- The area grade is low — what's the realistic commute time and amenity access for the typical tenant pool here? Any planned neighborhood developments (good or bad) we should know about?
- What's the average days-on-market for RENTAL listings here right now (not sales)? A rising rental-DOM trend means longer vacancies and softer asking-rent achievability than the comps imply.
- What's the recent tenant-quality profile in this submarket — average credit score on applications, eviction rate, late-payment / NSF rate, and stable-employment percentage? A property-management company in the area should have these aggregated.
- How much new for-sale + rental construction is in the pipeline within 1–3 miles? Heavy new supply typically softens prices + rents 12–24 months out; constrained supply supports both.
Investment metrics
- 1% rule
- 0.70% ✗
- Cap rate
- 5.90%
- Cash-on-cash
- -1.41%
- DSCR
- 0.94
- GRM
- 11.9
CMA / ARV
No comps found within radius.
Projected returns pro-forma
-3.0% appreciation · 5.33% rent growth · sell at horizon
- IRR
- -16.5%
- Equity multiple
- 0.40×
- Total profit
- $-47,516
- Equity at exit
- $42,494
- IRR
- -5.1%
- Equity multiple
- 0.64×
- Total profit
- $-29,011
- Equity at exit
- $24,642
Cash invested: $79,800 (down + closing). Projections, not guarantees.
Landlord ↔ Tenant lean methodology
- Overall (STATE)
- 87 Strongly Landlord-Friendly
- State Florida
- 87 Strongly Landlord-Friendly · R+3
- County
- — inherits STATE
- City
- — inherits STATE
ZIP-level market 33972
- Home prices YoY
- -13.6%
- Rents YoY
- 5.3%
- Active inventory
- 1611
- Price-to-rent
- 11.9×
Monthly cashflow live
- Estimated rent
- $2,004 high interval (Pro) →
- Mortgage (P&I)
- −$1,495
- Tax from tax record
- −$63 /mo · $762/yr
- Insurance
- −$119
- HOA
- −$0
- Vacancy / Maint / Mgmt
- −$421
- Net cashflow
- $-94
Break-even live
UW: 25.0% down · 7.5% · 30yr · 1.5% tax · 5.0% vac · 8.0% maint · 8.0% mgmt
Financing live
Cash to close
- Down payment
- $71,250
- Closing costs
- $8,550
- Reserves months
- —
- Total cash needed
- —
Loan-product check · same deal, 3 products live
Conventional
25% down · 7.5% · 30yr
- Down + closing
- —
- Monthly P&I
- —
- Monthly cashflow
- —
- DSCR
- —
- Eligible?
- —
Personal DTI + credit; lowest rate.
DSCR
20% down · 8.5% · 30yr
- Down + closing
- —
- Monthly P&I
- —
- Monthly cashflow
- —
- DSCR
- —
- Eligible?
- —
No personal income docs; deal must DSCR.
Hard money
10% down · 12.0% · 12mo
- Down + closing
- —
- Monthly P&I
- —
- Monthly cashflow
- —
- DSCR
- —
- Eligible?
- —
Short-term bridge; refi at stabilization.
Rent comps 22 comps
| Address | Beds | Baths | Sqft | Rent | $/sqft | DOM | Units | Dist |
|---|---|---|---|---|---|---|---|---|
| 603 W 9th St Lehigh Acres, FL | 3.0 | 2.0 | 1715 | $2,300 | $1.34 | 23d | 1 | 0.23mi |
| 915 Plumosa Ave Lehigh Acres, FL | 4.0 | 2.0 | 1744 | $1,901 | $1.09 | 23d | 1 | 0.32mi |
| 802 W 11th St Lehigh Acres, FL | 3.0 | 2.0 | 1283 | $1,725 | $1.34 | 3d | 1 | 0.38mi |
| 1103 W 10th St Lehigh Acres, FL | 3.0 | 2.0 | 1600 | $2,000 | $1.25 | 3d | 1 | 0.50mi |
| 14 W 11th St Lehigh Acres, FL | 3.0 | 2.0 | 1211 | $2,000 | $1.65 | 23d | 1 | 0.55mi |
| 714 W 12th St Lehigh Acres, FL | 3.0 | 2.0 | 1121 | $1,600 | $1.43 | 14d | 1 | 0.59mi |
| 1000 W 12th St #1002 Lehigh Acres, FL | 2.0 | 2.0 | 964 | $1,225 | $1.27 | 21d | 1 | 0.67mi |
| 1006 W 12th St Unit B Lehigh Acres, FL | 3.0 | 2.0 | 1400 | $1,800 | $1.29 | 23d | 1 | 0.69mi |
| 1113-1115 W 12th St Lehigh Acres, FL | 3.0 | 2.0 | 1600 | $1,800 | $1.12 | 23d | 1 | 0.75mi |
| 8071 Liriope Loop Lehigh Acres, FL | 3.0 | 2.0 | 1757 | $1,900 | $1.08 | 23d | 1 | 0.76mi |
| 1407 W 10th St Lehigh Acres, FL | 3.0 | 2.0 | 1407 | $1,700 | $1.21 | 23d | 1 | 0.81mi |
| 301 E 12th St Lehigh Acres, FL | 3.0 | 2.0 | 1305 | $1,700 | $1.30 | 23d | 1 | 0.95mi |
| 1418 W 12th St Lehigh Acres, FL | 2.0 | 2.0 | 1113 | $1,295 | $1.16 | 21d | 1 | 0.99mi |
| 414 E 12th St Lehigh Acres, FL | 3.0 | 2.0 | 1225 | $1,500 | $1.22 | 23d | 1 | 1.07mi |
| 1711 W 12th St Lehigh Acres, FL | 3.0 | 2.0 | 1400 | $1,999 | $1.43 | 19d | 1 | 1.18mi |
| 1711 W 12th St Lehigh Acres, FL | 3.0 | 2.0 | 1400 | $1,999 | $1.43 | 19d | 1 | 1.18mi |
| 808 Greenwood Ave Lehigh Acres, FL | 3.0 | 2.0 | 1419 | $1,800 | $1.27 | 23d | 1 | 1.19mi |
| 503 E 13th St Lehigh Acres, FL | 3.0 | 2.0 | 1248 | $2,300 | $1.84 | 23d | 1 | 1.29mi |
| 8187 Gopher Tortoise Trl Lehigh Acres, FL | 3.0 | 2.0 | 1555 | $2,000 | $1.29 | 23d | 1 | 1.39mi |
| 1004 E 10th St Lehigh Acres, FL | 3.0 | 2.0 | 1406 | $2,100 | $1.49 | 10d | 1 | 1.43mi |
| 8046 Gopher Tortoise Trl Lehigh Acres, FL | 4.0 | 2.0 | 1828 | $2,300 | $1.26 | 23d | 1 | 1.46mi |
| 8350 Tortoise Isle Ct Lehigh Acres, FL | 3.0 | 2.0 | 1478 | $1,595 | $1.08 | 3d | 1 | 1.50mi |
Listing history 23 events
-
2026-06-17days on market $285,000 Active 120 DOM
-
2026-06-16days on market $285,000 Active 119 DOM
-
2026-06-15days on market $285,000 Active 118 DOM
-
2026-06-13days on market $285,000 Active 116 DOM
-
2026-06-10days on market $285,000 Active 113 DOM
-
2026-06-09days on market $285,000 Active 112 DOM
-
2026-06-07days on market $285,000 Active 110 DOM
-
2026-06-02days on market $285,000 Active 105 DOM
-
2026-06-01days on market $285,000 Active 104 DOM
-
2026-06-01days on market $285,000 Active 103 DOM
-
2026-02-17$285,000 Active
-
2026-01-26historical
-
2025-06-24$299,000 Active
-
2023-09-18soldstatus $15,000 Closed 126-char remark
Show marketing remark (126 chars)
Many new homes being built in this area. The same seller has many others home sites available and will discount for bulk sale.
-
2023-09-15soldstatus $15,000
-
2023-08-15status Pending 126-char remark
Show marketing remark (126 chars)
Many new homes being built in this area. The same seller has many others home sites available and will discount for bulk sale.
-
2023-07-26status Active 126-char remark
Show marketing remark (126 chars)
Many new homes being built in this area. The same seller has many others home sites available and will discount for bulk sale.
-
2023-07-26price $16,250 126-char remark
Show marketing remark (126 chars)
Many new homes being built in this area. The same seller has many others home sites available and will discount for bulk sale.
-
2023-05-31status Pending 126-char remark
Show marketing remark (126 chars)
Many new homes being built in this area. The same seller has many others home sites available and will discount for bulk sale.
-
2023-05-16$14,950 Active 126-char remark
Show marketing remark (126 chars)
Many new homes being built in this area. The same seller has many others home sites available and will discount for bulk sale.
-
2005-05-13soldstatus $1,468,100
-
2005-01-05soldstatus $495,000
-
2004-09-08soldstatus $10,000
ⓘ Source: listings_history table (triggers on properties + properties_extension) + one-shot
backfill from property_details.listing_events for pre-trigger history.
Tax reassessment forecast FL · Resets to sale price
- Current annual tax
- $762 · $63/mo
- Projected year-2 tax
- $2,366 · $197/mo
- Expected delta
- +$1,604/yr (+$134/mo · 210.4%)
ⓘ Screening estimate from a state-policy table — verify with the county assessor before closing.
Nearby sold comps map
Loading sold comps map…
Walkable amenities ~0.75 mi
Loading nearby amenities…
Taxation est. · year 1
- Rental income
- $24,042
- − Mortgage interest
- −$15,964
- − Property taxes
- −$762
- − Insurance
- −$1,425
- − Repairs & maintenance
- −$1,923
- − Management
- −$1,923
- − Depreciation
- −$8,291
- Taxable loss
- −$6,247
- Est. tax savings @ 24.0%
- +$1,499
- After-tax cash flow
- $371/yr
For passive investors: Depreciation is non-cash, so a rental often shows a tax loss while cash-flowing — sheltering income. Rental losses are passive: they offset passive income freely, and up to $25,000/yr can offset ordinary (W-2) income if you actively participate and your MAGI is under $100k (phasing out to $0 by $150k); unused losses carry forward. On sale, claimed depreciation is recaptured at up to 25%, and gains may owe capital-gains tax (a 1031 exchange can defer both). Figures are a year-1 estimate at your 24.0% rate — not tax advice; consult a CPA.
Schools (NCES district)
- District
- Lee
- NCES district ID
- 1201080
- Math proficiency
- 47% ▼ -11.00%
- Reading proficiency
- 50% ▼ -4.00%
- Median HH income
- $49,518
- Composite
- 41.49/100
- National rank
- #3458
- State rank
- #42 of 73 in FL
Livability — Lehigh Acres
- Score
- 59/100
- State rank
- #826
- US rank
- #20055
Category grades
Schools grade is shown separately in the Schools card above.
Census & demographics
- Census place
- Lehigh Acres, FL
- County
- Lee County · 788,662 people
- City population
- 130,638
- Metro
- Cape Coral-Fort Myers, FL
- Population (ZIP)
- 17,285
- Household income
- $73,819
- Rent vs Own
- Severe rent burden
- 190.0
Population outlook (Lee County) Hauer SSP2
- Today (2025)
- 871,946 people
- By 2030
- 955,468 · +9.6%
- By 2040
- 1,113,587 · +27.7%
- By 2050
- 1,256,891 · +44.1%
- By 2075
- 1,560,270 · +78.9%
- By 2100
- 1,726,848 · +98.0%
Race, ethnicity, and origin ACS 2023
- Neighborhood character
- Diverse neighborhood (Simpson 0.65)
- Race & ethnicity
- White 44% Hispanic / Latino 38% Two or more races 21% Black 13%
- Hispanic origin (detail)
- Mexican 8% Puerto Rican 7% Cuban 18%
- Common ancestry
- Hispanic 6% Italian 2% Romanian 2%
- Foreign-born
- 27% · Canada, Guatemala
- Languages at home
- 61% English-only · Spanish 32% French/Haitian/Cajun 4% Other Indo-European 1%
Political lean MEDSL · Lee
- 2024 margin
- Strong R (+28.4) · D 35.5% · R 63.9%
- 2008→2024 swing
- -18.0pp toward R · 2008: -10.4pp · 2024: -28.4pp
- All cycles
- 2024: R+28.4 2020: R+19.2 2016: R+20.4 2012: R+16.6 2008: R+10.4
Not yet ingested
- Civics
- —
Market trends
- HPI YoY
- ▼ -53.97%
- Current HPI
- 343.484
- Rent YoY
- ▲ 5.33%
- Metro
- Cape Coral-Fort Myers, FL
- State GDP YoY
- ▲ 3.28%
- F500 in state
- 36
Industry mix (Fortune 500 HQ in FL)
| Industry | F500 HQs | Revenue |
|---|---|---|
| Industrial Technology | 2 | $29B |
|
||
| Insurance | 2 | $17B |
|
||
| Retail | 1 | $60B |
|
||
| Technology Distribution | 1 | $58B |
|
||
| Homebuilding | 1 | $35B |
|
||
| Technology Manufacturing | 1 | $35B |
|
||
Price history
+2750.0% since first listed13 events — show timeline
- 2026-02-17 Listed $285,000 MARMLS
- 2026-01-26 Listing Removed — MARMLS
- 2025-06-24 Listed $299,000 MARMLS
- 2023-09-18 Sold (MLS) $15,000 FORTMLS
- 2023-09-15 Sold (Public Records) $15,000 Public Records
- 2023-08-15 Pending — FORTMLS
- 2023-07-26 Relisted — FORTMLS
- 2023-07-26 Price Changed $16,250 FORTMLS
- 2023-05-31 Pending — FORTMLS
- 2023-05-16 Listed $14,950 FORTMLS
- 2005-05-13 Sold (Public Records) $1,468,100 Public Records
- 2005-01-05 Sold (Public Records) $495,000 Public Records
- 2004-09-08 Sold (Public Records) $10,000 Public Records
Property tax history
+25.6%/yrLatest (2025): $762 · +111.5% YoY. Source: county tax records.
Cash-flow waterfall
monthlySold comps — $/sqft
last 12 mo · ≤1 miLoading sold comps…