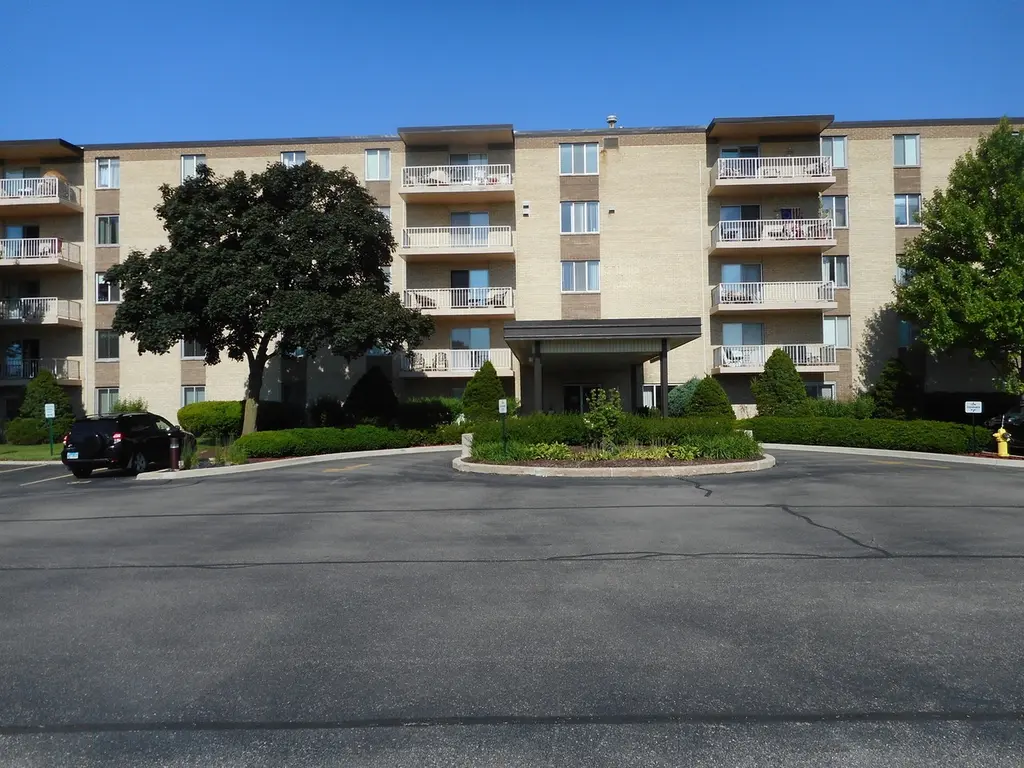
110 W Butterfield Rd Unit 409S · Elmhurst, IL
Flood risk 3/10 · Minor
- FEMA flood zone
- X (unshaded)
- Chance of flooding over 30 yrs
- 0.13%
- Est. flood insurance / yr
- $507 – $1,088
Fire risk 1/10 · Minimal
- Est. fire insurance / yr
- $804 – $1,492
Heat risk 3/10 · Minor
- Hot days now (above 101°F)
- 7 days/yr
- Hot days in 30 yrs
- 14 days/yr
Wind risk 2/10 · Minimal
- Chance of severe wind over 30 yrs
- —
Air-quality risk 4/10 · Minor
- Unhealthy air days now
- 6 days/yr
- Unhealthy air days in 30 yrs
- 7 days/yr
Risk factors via First Street. Map © Google.
Why this score? — see what drove the D+ grade
The composite is a weighted blend of 9 inputs, each scored 0–100. Each bar is that input's sub-score; the figure is the points it added to the 100-point composite (weight × sub-score).
- Cash flow +15.9/30.0
- 1% rule +8.2/10.0
- ARV discount +7.5/15.0
- DSCR +4.9/10.0
- Livability +4.4/5.0
- Rent growth +3.5/5.0
- Schools +2.9/10.0
- Condition / age +2.5/5.0
- Appreciation +0.0/10.0
$230,000
🖨 Deal sheet 📄 Offer letter ✓ Due diligence
Listing remarks MLS
This well updated unit has everything you need. Updated in 2019, it has 2 beds 2 full baths, and updated kitchen, spacious living room and balcony overlooking the school. There is laundry in the same floor, and unit comes with 2 parking spaces (one garage and one exterior). There is also an indoor pool. Conveniently located near highway, schools, restaurants and local shops.
Key facts
- Laundry area
- Granite countertops
- Remodeled bathrooms
Tags
Property features AI
Finance
- Other: School bus service available; Subdivision: Royal York; Parcel numbers on file
- Financial info: Not currently leased; No special service area
- HOA & community: Monthly association fee of $778; Association covers heat, air conditioning, water, gas, parking, insurance, security, pool, exterior maintenance, lawn care, scavenger service, and snow removal; Association amenities include coin laundry, storage, party room, and indoor pool; Manager off-site; No pets allowed
Exterior
- Parking: Detached garage with garage door opener; Assigned/owned garage parking; Asphalt parking; Two total parking spaces (one garage space)
- Security: Association includes security
- Utilities: Lake Michigan water source; Public sewer
- Home design: Attached single (condo); Ranch model — fourth floor entry level; Condo ownership
- Construction: Brick construction; Concrete perimeter foundation; Building age approximately 51–60 years; Built before 1978
- Exterior features: Balcony; Common lot/grounds
Interior
- Kitchen: Range; Microwave; Refrigerator
- Bedrooms: Master bedroom (fourth level) — includes full bath; Additional bedrooms (two other bedrooms; one listed as on fourth level)
- Flooring: Laminate (wood laminate in living areas and bedrooms)
- Bathrooms: Two full bathrooms
- Heating & cooling: Steam heating with individual controls; Electric cooling
- Interior features: Storage; Five total rooms; Separate dining room
- Laundry & utility: Common area laundry
Neighborhood map
What this means for you Summary
Snapshot
- This is a 2-bed/2.0-bath condo listed at $230k.
Deal economics
- At list price, monthly cash flow is $110 ($1k/yr) — positive.
- The deal already cash-flows at list — no discount required.
- Meets the 1% rule at list price ($3k rent vs $230k).
- Cap rate 6.9% vs local median 2.4% in Elmhurst — top-decile yield for the area; either an underpriced asset or a hidden risk that comps aren't pricing in. Stress-test before assuming the spread holds.
Location & tenants
- Location reads 87/100 on livability (#11 in IL, #268 nationally) — a professional / high-income tenant draw. Strengths: crime A+, commute A+, employment A+; Watch: cost of living F.
- Dupage Hsd 88 (suburban): math 29% / reading 35% proficiency, ranked #212 of 620 in IL (top 34%) — families likely to look elsewhere, expect single-tenant / working-renter base with shorter leases.
- Zoned schools: Willowbrook High School (math 34% / reading 41%, grade F, #104 of 693 statewide, top 15%, 1,992 students, 0% FRL).
- Market conditions: Rents rising fast (+4.0%/yr); 126 active listings in the ZIP; 11 comparable units currently listed for rent nearby; rentals leasing fast (median 4d on market — plan ~1-2 weeks tenant-placement turnaround); high-income renter base; 1,378 units permitted in DuPage County in 2024 (594 in 5+ unit buildings).
Forward outlook
- Local home prices are declining (-3.0%/yr); year-one equity from $2k of loan paydown is wiped out by about $7k of value loss. Plan a longer hold.
Negotiation context
- Only 1 days on market — expect competitive offers; lowballing is unlikely to land.
- 7 sale attempts since 6y ago with the ask held roughly flat each time — persistent listings suggest the price (not the market) is what's stuck; bring a comps-based counter.
- Current owner paid $190k; 21% above their basis — modest negotiation headroom, anchor on the comps not their cost.
Risks & watch-outs
- Watch-outs: HOA is 26% of rent.
Questions for the listing agent
- Built in 1970 — when were the roof, HVAC, electrical panel, plumbing, and water heater last replaced?
- What does the HOA fee cover, when was the last increase, and are there any pending special assessments or reserve-fund shortfalls?
- Any open or pending special assessments — roof, HVAC, plumbing, elevator, façade? What's the per-unit balance and payoff schedule, and is the seller paying it off at close or rolling it to the buyer?
- Is there a deadline driving the sale (1031 exchange, divorce, estate, relocation)? That informs how much negotiation room exists.
- Schools are A-rated — typically a magnet for longer-tenancy family renters. What's the average tenant stay here, and is there a school-zone premium baked into asking?
- The area grade is low — what's the realistic commute time and amenity access for the typical tenant pool here? Any planned neighborhood developments (good or bad) we should know about?
- What's the average days-on-market for RENTAL listings here right now (not sales)? A rising rental-DOM trend means longer vacancies and softer asking-rent achievability than the comps imply.
- What's the recent tenant-quality profile in this submarket — average credit score on applications, eviction rate, late-payment / NSF rate, and stable-employment percentage? A property-management company in the area should have these aggregated.
- How much new apartment / multifamily construction is in the pipeline within 1–3 miles? Heavy new supply (>2% of stock underway) typically softens rents 12–24 months out; light construction supports rent growth.
Investment metrics
- 1% rule
- 1.32% ✓
- Cap rate
- 6.87%
- Cash-on-cash
- 2.05%
- DSCR
- 1.09
- GRM
- 6.3
CMA / ARV
No comps found within radius.
Projected returns pro-forma
-3.0% appreciation · 4.0% rent growth · sell at horizon
- IRR
- -11.2%
- Equity multiple
- 0.59×
- Total profit
- $-26,691
- Equity at exit
- $34,294
- IRR
- 0.1%
- Equity multiple
- 1.01×
- Total profit
- $690
- Equity at exit
- $19,886
Cash invested: $64,400 (down + closing). Projections, not guarantees.
Landlord ↔ Tenant lean methodology
- Overall (STATE)
- 43 Moderately Tenant-Leaning
- State Illinois
- 43 Moderately Tenant-Leaning · D+7
- County
- — inherits STATE
- City
- — inherits STATE
ZIP-level market 60126
- Rents YoY
- 4.0%
- Active inventory
- 126
- Price-to-rent
- 6.3×
Monthly cashflow live
- Estimated rent
- $3,046 high interval (Pro) →
- Mortgage (P&I)
- −$1,206
- Tax from tax record
- −$217 /mo · $2,599/yr
- Insurance
- −$96
- HOA
- −$778
- Vacancy / Maint / Mgmt
- −$640
- Net cashflow
- $110
Break-even live
UW: 25.0% down · 7.5% · 30yr · 1.5% tax · 5.0% vac · 8.0% maint · 8.0% mgmt
Financing live
Cash to close
- Down payment
- $57,500
- Closing costs
- $6,900
- Reserves months
- —
- Total cash needed
- —
Loan-product check · same deal, 3 products live
Conventional
25% down · 7.5% · 30yr
- Down + closing
- —
- Monthly P&I
- —
- Monthly cashflow
- —
- DSCR
- —
- Eligible?
- —
Personal DTI + credit; lowest rate.
DSCR
20% down · 8.5% · 30yr
- Down + closing
- —
- Monthly P&I
- —
- Monthly cashflow
- —
- DSCR
- —
- Eligible?
- —
No personal income docs; deal must DSCR.
Hard money
10% down · 12.0% · 12mo
- Down + closing
- —
- Monthly P&I
- —
- Monthly cashflow
- —
- DSCR
- —
- Eligible?
- —
Short-term bridge; refi at stabilization.
Rent comps 11 comps
| Address | Beds | Baths | Sqft | Rent | $/sqft | DOM | Units | Dist |
|---|---|---|---|---|---|---|---|---|
| 995 S Swain Ave Elmhurst, IL | 3.0 | 2.0 | 1190 | $2,900 | $2.44 | 1d | 1 | 0.34mi |
| 1 Elm Creek Dr Elmhurst, IL | 1.0–3.0 | 1.0–3.5 | 1582 | $3,388 | $2.14 | 1d | 28 | 0.38mi |
| 171 E Hale St Elmhurst, IL | 3.0 | 2.0 | 1295 | $3,750 | $2.90 | 24d | 1 | 0.40mi |
| 0S620 Old York Rd Elmhurst, IL | 1.0–2.0 | 1.0 | 650 | $1,695 | $2.61 | 3d | 3 | 0.53mi |
| 860 S Spring Rd Elmhurst, IL | 3.0 | 2.0 | 1456 | $3,800 | $2.61 | 12d | 1 | 0.64mi |
| 861 S Hawthorne Ave Elmhurst, IL | 3.0 | 1.5 | 1216 | $3,750 | $3.08 | 1d | 1 | 0.77mi |
| 753 S Hawthorne Ave Elmhurst, IL | 3.0 | 2.0 | 1250 | $3,950 | $3.16 | 16d | 1 | 0.94mi |
| 2150 McDonalds Dr Oak Brook, IL | 1.0 | 1.0 | 934 | $4,305 | $4.61 | 24d | 1 | 1.34mi |
| 2150 McDonalds Dr Oak Brook, IL | 1.0–3.0 | 1.0–2.0 | 1258 | $5,214 | $4.14 | 1d | 30 | 1.34mi |
| 5900 Butterfield Rd Unit 9 Berkeley, IL | 2.0 | 1.0 | 840 | $1,400 | $1.67 | 3d | 1 | 1.36mi |
| 5900 Butterfield Rd Unit 9 Berkeley, IL | 2.0 | 1.0 | 840 | $1,400 | $1.67 | 6d | 1 | 1.36mi |
HOA detail condo
- Monthly dues
- $778 · $9,336/yr
- Likely covers
- pool
- Assessments
- None detected in remarks — confirm with the listing agent.
Listing history 2 events
-
2026-06-04remarks 616-char remark
-
2026-06-04$230,000 Active 1 DOM
ⓘ Source: listings_history table (triggers on properties + properties_extension) + one-shot
backfill from property_details.listing_events for pre-trigger history.
Tax reassessment forecast IL · Partial reset (capped growth)
- Current annual tax
- $2,599 · $217/mo
- Projected year-2 tax
- $3,910 · $326/mo
- Expected delta
- +$1,311/yr (+$109/mo · 50.4%)
ⓘ Screening estimate from a state-policy table — verify with the county assessor before closing.
Climate risk First Street
- Flood 3/10 Moderate FEMA zone X (unshaded) · 13% chance over 30 yrs
- Wildfire 1/10 Low
- Heat 3/10 Moderate 7 d/yr ≥101°F today · 14 d/yr by 30 yrs out
- Wind 2/10 Low
- Air quality 4/10 Moderate 6 unhealthy d/yr today · 7 by 30 yrs out
Nearby sold comps map
Loading sold comps map…
Walkable amenities ~0.75 mi
Loading nearby amenities…
Taxation est. · year 1
- Rental income
- $36,555
- − Mortgage interest
- −$12,884
- − Property taxes
- −$2,599
- − Insurance
- −$1,150
- − Repairs & maintenance
- −$2,924
- − Management
- −$2,924
- − HOA
- −$9,336
- − Depreciation
- −$6,691
- Taxable loss
- −$1,954
- Est. tax savings @ 24.0%
- +$469
- After-tax cash flow
- $1,788/yr
For passive investors: Depreciation is non-cash, so a rental often shows a tax loss while cash-flowing — sheltering income. Rental losses are passive: they offset passive income freely, and up to $25,000/yr can offset ordinary (W-2) income if you actively participate and your MAGI is under $100k (phasing out to $0 by $150k); unused losses carry forward. On sale, claimed depreciation is recaptured at up to 25%, and gains may owe capital-gains tax (a 1031 exchange can defer both). Figures are a year-1 estimate at your 24.0% rate — not tax advice; consult a CPA.
Schools (NCES district)
- District
- Dupage Hsd 88
- NCES district ID
- 1713940
- Math proficiency
- 29% ▼ -1.00%
- Reading proficiency
- 35% ▲ 3.00%
- Median HH income
- $64,846
- Composite
- 29.26/100
- National rank
- #6561
- State rank
- #212 of 620 in IL
Livability — Elmhurst
- Score
- 87/100
- State rank
- #11
- US rank
- #268
Category grades
Schools grade is shown separately in the Schools card above.
Census & demographics
- Census place
- Elmhurst, IL
- County
- DuPage County · 904,569 people
- City population
- 47,516
- Metro
- Chicago-Naperville-Elgin, IL-IN-WI
- Population (ZIP)
- 47,516
- Household income
- $147,566
- Rent vs Own
- Severe rent burden
- 602.0
Population outlook (DuPage County) Hauer SSP2
- Today (2025)
- 960,187 people
- By 2030
- 965,850 · +0.6%
- By 2040
- 965,812 · +0.6%
- By 2050
- 954,890 · -0.6%
- By 2075
- 910,185 · -5.2%
- By 2100
- 816,255 · -15.0%
Race, ethnicity, and origin ACS 2023
- Neighborhood character
- Predominantly White (77%)
- Race & ethnicity
- White 77% Hispanic / Latino 10% Two or more races 9% Asian 7% Black 2%
- Hispanic origin (detail)
- Mexican 7%
- Common ancestry
- Romanian 10% Italian 3% Lithuanian 2%
- Foreign-born
- 11% · Canada, China
- Languages at home
- 83% English-only · Spanish 6% Other Indo-European 4% Russian/Polish/Slavic 3%
Political lean MEDSL · DuPage
- 2024 margin
- D (+13.3) · D 55.9% · R 42.5% · Other 1.6%
- 2008→2024 swing
- +2.5pp toward D · 2008: 10.8pp · 2024: 13.3pp
- All cycles
- 2024: D+13.3 2020: D+18.1 2016: D+14.1 2012: D+1.0 2008: D+10.8
Not yet ingested
- Civics
- —
Market trends
- HPI YoY
- ▼ -545.93%
- Current HPI
- 212.3309
- Rent YoY
- ▲ 4.00%
- Metro
- Chicago-Naperville-Elgin, IL-IN-WI
- State GDP YoY
- ▲ 1.59%
- F500 in state
- 60
Industry mix (Fortune 500 HQ in IL)
| Industry | F500 HQs | Revenue |
|---|---|---|
| Insurance | 4 | $201B |
|
||
| Consumer Goods | 4 | $87B |
|
||
| Industrial Machinery | 3 | $64B |
|
||
| Healthcare | 2 | $55B |
|
||
| Retail / Pharmacy | 1 | $148B |
|
||
| Agriculture / Food | 1 | $86B |
|
||
Price history
+219.4% since first listed22 events — show timeline
- 2026-06-04 Listed $230,000 MRED as Distributed by MLS Grid
- 2024-07-18 Sold (Public Records) $190,000 Public Records
- 2024-07-01 Sold (MLS) $190,000 MRED as Distributed by MLS Grid
- 2024-06-07 Sold (Public Records) $95,000 Public Records
- 2024-06-07 Contingent — MRED as Distributed by MLS Grid
- 2024-05-31 Relisted — MRED as Distributed by MLS Grid
- 2024-05-20 Contingent — MRED as Distributed by MLS Grid
- 2024-05-08 Relisted — MRED as Distributed by MLS Grid
- 2024-05-08 Price Changed $190,000 MRED as Distributed by MLS Grid
- 2024-05-07 Listing Removed — MRED as Distributed by MLS Grid
- 2024-05-07 Relisted — MRED as Distributed by MLS Grid
- 2024-05-07 Listing Removed — MRED as Distributed by MLS Grid
- 2024-05-06 Relisted — MRED as Distributed by MLS Grid
- 2024-04-29 Listing Removed — MRED as Distributed by MLS Grid
- 2024-04-17 Listed $200,000 MRED as Distributed by MLS Grid
- 2021-01-28 Sold (Public Records) $216,000 Public Records
- 2020-11-09 Sold (MLS) $216,000 MRED as Distributed by MLS Grid
- 2020-10-30 Pending — MRED as Distributed by MLS Grid
- 2020-10-12 Pending — MRED as Distributed by MLS Grid
- 2020-10-06 Listed $225,000 MRED as Distributed by MLS Grid
- 2018-11-20 Sold (Public Records) $124,000 Public Records
- 1984-09-01 Sold (Public Records) $72,000 Public Records
Property tax history
+1.0%/yrLatest (2024): $2,599 · +17.6% YoY. Source: county tax records.
Cash-flow waterfall
monthlySold comps — $/sqft
last 12 mo · ≤1 miLoading sold comps…