 🏷️ Likely Rental
637 Center St · St. Augustine, FL
Flood risk 1/10 · Minimal
- FEMA flood zone
- X (unshaded)
- Chance of flooding over 30 yrs
- 0.0%
- Est. flood insurance / yr
- $507 – $1,088
Fire risk 3/10 · Minor
- Est. fire insurance / yr
- $947 – $1,759
Heat risk 9/10 · Severe
- Hot days now (above 106°F)
- 7 days/yr
- Hot days in 30 yrs
- 20 days/yr
Wind risk 10/10 · Severe
- Chance of severe wind over 30 yrs
- 99.0%
Air-quality risk 3/10 · Minor
- Unhealthy air days now
- 3 days/yr
- Unhealthy air days in 30 yrs
- 3 days/yr
Risk factors via First Street. Map © Google.
Why this score? — see what drove the D+ grade
The composite is a weighted blend of 9 inputs, each scored 0–100. Each bar is that input's sub-score; the figure is the points it added to the 100-point composite (weight × sub-score).
- ARV discount +15.0/15.0
- Cash flow +13.7/30.0
- Schools +6.4/10.0
- DSCR +4.1/10.0
- 1% rule +2.7/10.0
- Rent growth +2.6/5.0
- Livability +2.5/5.0
- Condition / age +2.5/5.0
- Appreciation +0.0/10.0
$205,000
🖨 Deal sheet 📄 Offer letter ✓ Due diligence
Multi-family units
County records classify this as Multi-Family (2-4 Unit). Listing-text estimate: 1 unit. estimate disagrees with records
Listing remarks MLS
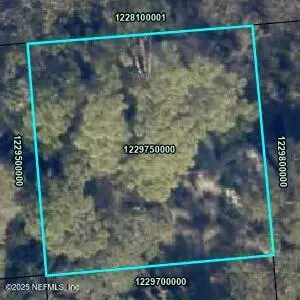
Perfect opportunity to invest in a growing area of St. Johns County! This is 3 lots (1229700000, 1229800000 & 1229750000)(Multi-Family zoning). The largest lot currently has 2 small dwellings on it. There is a tenant in one until (03-31-26) Currently- MtoM. The others are vacant lots. These offer privacy, flexibility, and the potential for future growth. Currently accessible by Center Street or Madeore St. No HOA restrictions! You have the freedom to design and build without unnecessary limitations. Don't miss this chance to own land in one of Florida's most desirable counties! All information pertaining to the property is deemed reliable, but not guaranteed. Information to be verified by the Buyer. Feel free to reach out with any questions.
Key facts
- Multi-family zoning
- Vacant lots
- 2 small dwellings
Tags
Neighborhood map
What this means for you Summary
Snapshot
- This is a 2-bed/1.0-bath multifamily listed at $205k.
Deal economics
- At list price, monthly cash flow is $14 ($166/yr) — positive.
- The deal already cash-flows at list — no discount required.
- To meet the 1% rule (rent ≥ 1% of price), the offer needs to be $158k (23.1% below list).
- Recommended offer: $158k (23.1% below list) — sets the bar for 1% rule.
- Cap rate 6.4% vs local median 3.1% in St. Augustine — top-decile yield for the area; either an underpriced asset or a hidden risk that comps aren't pricing in. Stress-test before assuming the spread holds.
Location & tenants
- Location reads: area grade D — affects rentability + tenant quality, not the cash-flow math above.
- St. Johns (rural): math 75% / reading 73% proficiency, ranked #2 of 73 in FL (top 3%) — strong family-tenant draw, lease renewals of 3-5y typical; only 20% free/reduced lunch — higher-income household profile.
- Market conditions: Rents flat; 631 active listings in the ZIP; 9 comparable units currently listed for rent nearby; rentals at typical pace (median 17d on market — plan ~3-4 weeks tenant-placement turnaround); 5,575 units permitted in St. Johns County in 2024 (584 in 5+ unit buildings).
Forward outlook
- Local home prices are declining (-3.0%/yr); year-one equity from $1k of loan paydown is wiped out by about $6k of value loss. Plan a longer hold.
- St. Johns County population projected at +60% by 2050 — long-run rental-demand tailwind backs the buy-and-hold thesis.
Negotiation context
- It's been on market 125 days — a 12% lower offer ($180k) is reasonable based on typical stale-listing flexibility.
- Current owner paid $145k; 41% above their basis — modest negotiation headroom, anchor on the comps not their cost.
Risks & watch-outs
- Climate carrying-cost: severe wind risk, 99% chance of damaging wind over 30y; extreme-heat days projected 7→20/yr by 2055 (HVAC capex compounding) — expect insurance premiums to compound above CPI over the hold.
Questions for the listing agent
- It's been on market 125 days. Have you received any prior offers? Is the seller open to a 23% concession, seller financing, or rate buy-down credit?
- Built in 1970 — when were the roof, HVAC, electrical panel, plumbing, and water heater last replaced?
- Why hasn't it sold? Are there any deal-killer items the seller is aware of (foundation, flood, title, zoning, code violations)?
- Is there a deadline driving the sale (1031 exchange, divorce, estate, relocation)? That informs how much negotiation room exists.
- The area grade is low — what's the realistic commute time and amenity access for the typical tenant pool here? Any planned neighborhood developments (good or bad) we should know about?
- What's the average days-on-market for RENTAL listings here right now (not sales)? A rising rental-DOM trend means longer vacancies and softer asking-rent achievability than the comps imply.
- What's the recent tenant-quality profile in this submarket — average credit score on applications, eviction rate, late-payment / NSF rate, and stable-employment percentage? A property-management company in the area should have these aggregated.
- How much new apartment / multifamily construction is in the pipeline within 1–3 miles? Heavy new supply (>2% of stock underway) typically softens rents 12–24 months out; light construction supports rent growth.
Investment metrics
- 1% rule
- 0.77% ✗
- Cap rate
- 6.37%
- Cash-on-cash
- 0.29%
- DSCR
- 1.01
- GRM
- 10.8
CMA / ARV
- ARV (median comp)
- $273,124
- List price
- $205,000
- Delta
- -24.94%
- Verdict
- UNDERPRICED
- Comps
- 20 within 1.0 mi
Projected returns pro-forma
-3.0% appreciation · 0.25% rent growth · sell at horizon
- IRR
- -18.6%
- Equity multiple
- 0.36×
- Total profit
- $-36,672
- Equity at exit
- $30,566
- IRR
- -16.8%
- Equity multiple
- 0.17×
- Total profit
- $-47,652
- Equity at exit
- $17,725
Cash invested: $57,400 (down + closing). Projections, not guarantees.
Landlord ↔ Tenant lean methodology
- Overall (STATE)
- 87 Strongly Landlord-Friendly
- State Florida
- 87 Strongly Landlord-Friendly · R+3
- County
- — inherits STATE
- City
- — inherits STATE
ZIP-level market 32084
- Rents YoY
- 0.2%
- Active inventory
- 631
- Price-to-rent
- 10.8×
Monthly cashflow live
- Estimated rent
- $1,577 high interval (Pro) →
- Mortgage (P&I)
- −$1,075
- Tax from tax record
- −$71 /mo · $855/yr
- Insurance
- −$85
- HOA
- −$0
- Vacancy / Maint / Mgmt
- −$331
- Net cashflow
- $14
Break-even live
UW: 25.0% down · 7.5% · 30yr · 1.5% tax · 5.0% vac · 8.0% maint · 8.0% mgmt
Financing live
Cash to close
- Down payment
- $51,250
- Closing costs
- $6,150
- Reserves months
- —
- Total cash needed
- —
Loan-product check · same deal, 3 products live
Conventional
25% down · 7.5% · 30yr
- Down + closing
- —
- Monthly P&I
- —
- Monthly cashflow
- —
- DSCR
- —
- Eligible?
- —
Personal DTI + credit; lowest rate.
DSCR
20% down · 8.5% · 30yr
- Down + closing
- —
- Monthly P&I
- —
- Monthly cashflow
- —
- DSCR
- —
- Eligible?
- —
No personal income docs; deal must DSCR.
Hard money
10% down · 12.0% · 12mo
- Down + closing
- —
- Monthly P&I
- —
- Monthly cashflow
- —
- DSCR
- —
- Eligible?
- —
Short-term bridge; refi at stabilization.
Rent comps 9 comps
| Address | Beds | Baths | Sqft | Rent | $/sqft | DOM | Units | Dist |
|---|---|---|---|---|---|---|---|---|
| 509 Live Oak St Unit 1 St. Augustine, FL | 1.0 | 1.0 | 432 | $1,500 | $3.47 | 23d | 1 | 0.25mi |
| 736 W King St Unit A St. Augustine, FL | 2.0 | 1.0 | 688 | $1,750 | $2.54 | 17d | 1 | 0.33mi |
| 736 W King St Unit B St. Augustine, FL | 1.0 | 1.0 | 450 | $1,200 | $2.67 | 17d | 1 | 0.33mi |
| 25 Florida Ave Unit A St. Augustine, FL | 2.0 | 1.0 | 500 | $1,200 | $2.40 | 14d | 1 | 0.87mi |
| 130 Shipyard Way St. Augustine, FL | 1.0–3.0 | 1.0–2.0 | 1137 | $2,612 | $2.30 | 1d | 68 | 1.05mi |
| 25 Desoto Pl Unit 4 St. Augustine, FL | 1.0 | 1.0 | 430 | $1,150 | $2.67 | 3d | 1 | 1.28mi |
| 260 Saint George St Unit 9 St. Augustine, FL | 1.0 | 1.0 | 475 | $1,395 | $2.94 | 17d | 1 | 1.46mi |
| 260 Saint George St Unit 2 St. Augustine, FL | 1.0 | 1.0 | 750 | $1,599 | $2.13 | 3d | 1 | 1.46mi |
| 260 Saint George St Unit 1 St. Augustine, FL | 1.0 | 1.0 | 550 | $1,495 | $2.72 | 17d | 1 | 1.46mi |
Listing history 16 events
-
2026-06-18days on market $205,000 Active 125 DOM
-
2026-06-17days on market $205,000 Active 124 DOM
-
2026-06-16days on market $205,000 Active 123 DOM
-
2026-06-15days on market $205,000 Active 122 DOM
-
2026-06-13days on market $205,000 Active 120 DOM
-
2026-06-13days on market $205,000 Active 119 DOM
-
2026-06-10days on market $205,000 Active 116 DOM
-
2026-06-08days on market $205,000 Active 115 DOM
-
2026-06-07days on market $205,000 Active 114 DOM
-
2026-06-03days on market $205,000 Active 110 DOM
-
2026-06-02days on market $205,000 Active 109 DOM
-
2026-06-01days on market $205,000 Active 108 DOM
-
2026-05-31days on market $205,000 Active 107 DOM
-
2026-02-13$205,000 Active 757-char remark
Show marketing remark (757 chars)
Perfect opportunity to invest in a growing area of St. Johns County! This is 3 lots (1229700000, 1229800000 & 1229750000)(Multi-Family zoning). The largest lot currently has 2 small dwellings on it. There is a tenant in one until (03-31-26) Currently- MtoM. The others are vacant lots. These offer privacy, flexibility, and the potential for future growth. Currently accessible by Center Street or Madeore St. No HOA restrictions! You have the freedom to design and build without unnecessary limitations. Don't miss this chance to own land in one of Florida's most desirable counties! All information pertaining to the property is deemed reliable, but not guaranteed. Information to be verified by the Buyer. Feel free to reach out with any questions.
-
2024-10-24soldstatus $145,000
-
2024-02-07soldstatus $20,000
ⓘ Source: listings_history table (triggers on properties + properties_extension) + one-shot
backfill from property_details.listing_events for pre-trigger history.
Tax reassessment forecast FL · Resets to sale price
- Current annual tax
- $855 · $71/mo
- Projected year-2 tax
- $1,702 · $142/mo
- Expected delta
- +$847/yr (+$71/mo · 99.1%)
ⓘ Screening estimate from a state-policy table — verify with the county assessor before closing.
Climate risk First Street
- Flood 1/10 Low FEMA zone X (unshaded) · 0% chance over 30 yrs
- Wildfire 3/10 Moderate
- Heat 9/10 Extreme 7 d/yr ≥106°F today · 20 d/yr by 30 yrs out
- Wind 10/10 Extreme 99% chance of damaging wind over 30 yrs
- Air quality 3/10 Moderate 3 unhealthy d/yr today · 3 by 30 yrs out
Nearby sold comps map
Loading sold comps map…
Walkable amenities ~0.75 mi
Loading nearby amenities…
Taxation est. · year 1
- Rental income
- $18,920
- − Mortgage interest
- −$11,483
- − Property taxes
- −$855
- − Insurance
- −$1,025
- − Repairs & maintenance
- −$1,514
- − Management
- −$1,514
- − Depreciation
- −$5,964
- Taxable loss
- −$3,434
- Est. tax savings @ 24.0%
- +$824
- After-tax cash flow
- $990/yr
For passive investors: Depreciation is non-cash, so a rental often shows a tax loss while cash-flowing — sheltering income. Rental losses are passive: they offset passive income freely, and up to $25,000/yr can offset ordinary (W-2) income if you actively participate and your MAGI is under $100k (phasing out to $0 by $150k); unused losses carry forward. On sale, claimed depreciation is recaptured at up to 25%, and gains may owe capital-gains tax (a 1031 exchange can defer both). Figures are a year-1 estimate at your 24.0% rate — not tax advice; consult a CPA.
Schools (NCES district)
- District
- St. Johns
- NCES district ID
- 1201740
- Math proficiency
- 75% ▼ -5.00%
- Reading proficiency
- 73% ▼ -2.00%
- Median HH income
- $66,842
- Composite
- 64.31/100
- National rank
- #556
- State rank
- #2 of 73 in FL
Livability — St. Augustine
No livability data for this city. (Only ~50 U.S. cities are tracked.)
Census & demographics
- County
- Saint Johns County · 301,599 people
- Metro
- Jacksonville, FL
- Population (ZIP)
- 37,291
- Household income
- $73,837
- Rent vs Own
- Severe rent burden
- 1748.0
Population outlook (St. Johns County) Hauer SSP2
- Today (2025)
- 303,941 people
- By 2030
- 342,590 · +12.7%
- By 2040
- 417,328 · +37.3%
- By 2050
- 487,011 · +60.2%
- By 2075
- 635,395 · +109.1%
- By 2100
- 717,469 · +136.1%
Race, ethnicity, and origin ACS 2023
- Neighborhood character
- Predominantly White (73%)
- Race & ethnicity
- White 73% Hispanic / Latino 12% Black 11% Two or more races 8%
- Hispanic origin (detail)
- Mexican 2% Puerto Rican 4% Cuban 1%
- Common ancestry
- Lithuanian 3% Romanian 2% Slovak 2%
- Foreign-born
- 6% · Canada, Jamaica
- Languages at home
- 91% English-only · Spanish 6% Other Indo-European 1%
Political lean MEDSL · St. Johns
- 2024 margin
- Solid R (+31.4) · D 33.9% · R 65.2%
- 2008→2024 swing
- +0.2pp no change · 2008: -31.6pp · 2024: -31.4pp
- All cycles
- 2024: R+31.4 2020: R+26.7 2016: R+33.4 2012: R+37.8 2008: R+31.6
Not yet ingested
- Civics
- —
Market trends
- HPI YoY
- ▼ -287.02%
- Current HPI
- 330.9505
- Rent YoY
- ▲ 0.25%
- Metro
- Jacksonville, FL
- State GDP YoY
- ▲ 3.28%
- F500 in state
- 36
Industry mix (Fortune 500 HQ in FL)
| Industry | F500 HQs | Revenue |
|---|---|---|
| Industrial Technology | 2 | $29B |
|
||
| Insurance | 2 | $17B |
|
||
| Retail | 1 | $60B |
|
||
| Technology Distribution | 1 | $58B |
|
||
| Homebuilding | 1 | $35B |
|
||
| Technology Manufacturing | 1 | $35B |
|
||
Price history
+925.0% since first listed3 events — show timeline
- 2026-02-13 Listed $205,000 realMLS
- 2024-10-24 Sold (Public Records) $145,000 Public Records
- 2024-02-07 Sold (Public Records) $20,000 Public Records
Property tax history
+3.8%/yrLatest (2025): $855 · +3.8% YoY. Source: county tax records.
Cash-flow waterfall
monthlySold comps — $/sqft
last 12 mo · ≤1 miLoading sold comps…