130 Don Miguel Cir · Palm Desert, CA
Flood risk 1/10 · Minimal
- FEMA flood zone
- X
- Chance of flooding over 30 yrs
- 0.0%
- Est. flood insurance / yr
- $507 – $1,088
Fire risk 3/10 · Minor
- Est. fire insurance / yr
- $659 – $1,223
Heat risk 9/10 · Severe
- Hot days now (above 114°F)
- 7 days/yr
- Hot days in 30 yrs
- 20 days/yr
Wind risk 1/10 · Minimal
- Chance of severe wind over 30 yrs
- —
Air-quality risk 4/10 · Minor
- Unhealthy air days now
- 5 days/yr
- Unhealthy air days in 30 yrs
- 6 days/yr
Risk factors via First Street. Map © Google.
Why this score? — see what drove the D+ grade
The composite is a weighted blend of 9 inputs, each scored 0–100. Each bar is that input's sub-score; the figure is the points it added to the 100-point composite (weight × sub-score).
- Cash flow +15.7/30.0
- 1% rule +7.6/10.0
- ARV discount +7.5/15.0
- DSCR +4.8/10.0
- Schools +3.8/10.0
- Rent growth +2.9/5.0
- Livability +2.6/5.0
- Condition / age +2.5/5.0
- Appreciation +0.0/10.0
$379,900
🖨 Deal sheet 📄 Offer letter ✓ Due diligence
Listing remarks
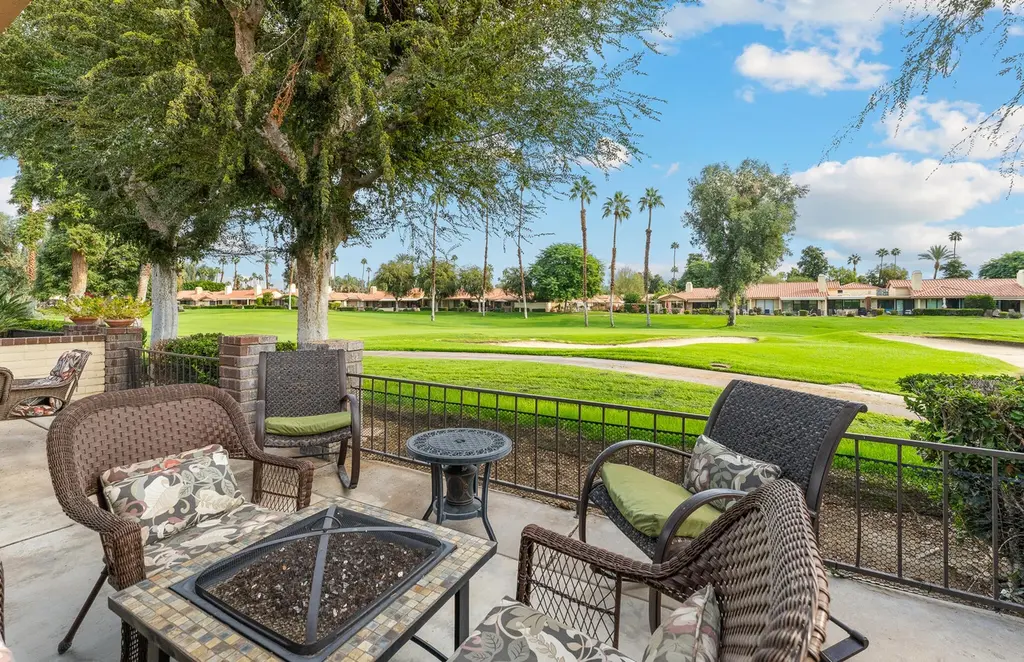
Discover exceptional value and resort style living in this beautifully maintained 2 bedroom, 2 bath 200 Plan residence. Perfectly positioned on the 2nd hole of the West Course at the prestigious Monterey Country Club in Palm Desert. Offering 1,347 sq. ft. of inviting living space, this fully furnished home captures the essence of desert luxury and relaxation. Step inside to a spacious great room featuring vaulted ceilings, a cozy fireplace, and a wet bar ideal for entertaining or unwinding after a day on the course. The open layout seamlessly atrium fills the home with natural light, while the newer A/C system ensures comfort year round. This property is offered fully furnished, making it
Key facts
- $942 HOA
- 2 garage spots
- Community pool
Property features AI
Finance
- Other: Short-term rentals allowed; Refrigerator, washer and dryer included; Property sold as-is; CC&R disclosures apply; Personal belongings excluded from sale
- HOA & community: HOA fees billed monthly; Total monthly association fees $942.00; Association covers building and grounds maintenance and clubhouse; Community amenities include golf course, tennis and sport courts, pickleball, bocce ball court, racquetball, paddle tennis, fitness center, clubhouse, meeting and banquet facilities, recreation room, guest parking, lake/pond, fire pit; management and maintenance provided; pet rules apply
Exterior
- Parking: Attached 2-car garage; Attached carport; Driveway; Garage door opener; Total of 2 parking spaces
- Security: Gated community with automatic gate; 24-hour security
- Utilities: Sewer: in street, paid; PUD: Yes
- Home design: Condominium; Attached property; Single-story (ground level); Front door faces west; leisure area faces east
- Construction: Assessor records used for year built; Ground-level construction
- Exterior features: Community sprinklers; Drip irrigation system; Has view of golf course and mountains; In-ground community pool; In-ground community spa/hot tub (fenced); Community exercise pool area
Interior
- Kitchen: Quartz countertops; Gas range and gas oven; Microwave; Refrigerator; Dishwasher; Disposal; Water purifier and water filter
- Bedrooms: Main floor bedroom
- Flooring: Carpet; Tile
- Bathrooms: 2 full bathrooms; Shower and tub
- Heating & cooling: Central heating; Central air conditioning; Ceiling fans
- Interior features: Ground-level entry with no steps; Sliding doors; Fully furnished; Shutters on windows; Gas fireplace in the living room
- Laundry & utility: Washer and dryer included; Laundry located in closet
Neighborhood map
What this means for you Summary
Snapshot
- This is a 2-bed/2.0-bath condo listed at $380k.
Deal economics
- At list price, monthly cash flow is $166 ($2k/yr) — positive.
- The deal already cash-flows at list — no discount required.
- Meets the 1% rule at list price ($5k rent vs $380k).
- Recommended offer: $369k (3.0% below list) — sets the bar for market timing.
- Cap rate 6.8% vs local median 3.5% in Palm Desert — top-decile yield for the area; either an underpriced asset or a hidden risk that comps aren't pricing in. Stress-test before assuming the spread holds.
Location & tenants
- Location reads 51/100 on livability (#1,050 in CA) — a working-class tenant base; expect higher turnover. Strengths: schools A-, employment B+, housing B; Watch: crime D, amenities F, commute F.
- Desert Sands Unified (suburban): math 31% / reading 56% proficiency, ranked #199 of 517 in CA (top 38%) — families likely to look elsewhere, expect single-tenant / working-renter base with shorter leases.
- Market conditions: Rents rising (+1.6%/yr); 545 active listings in the ZIP; 40 comparable units currently listed for rent nearby; rentals lingering (median 44d on market — plan ~5-8 weeks vacancy on turnover, expect pricing pressure); 78% of comp listings sitting > 30 days — soft ceiling on asking rent; 9,195 units permitted in Riverside County in 2024 (1,512 in 5+ unit buildings).
- At $4,776/mo this rent would consume 82% of the median local household income ($70k/yr) (locally 1734% of renters already pay >50% of income on rent) — very limited rent-growth headroom before tenants either downsize or default.
Forward outlook
- Local home prices are declining (-3.0%/yr); year-one equity from $3k of loan paydown is wiped out by about $11k of value loss. Plan a longer hold.
- Riverside County population projected at +22% by 2050 — long-run rental-demand tailwind backs the buy-and-hold thesis.
Negotiation context
- It's been on market 36 days — a 3% lower offer ($369k) is reasonable based on typical stale-listing flexibility.
- 18 sale attempts since 24y ago with the ask held roughly flat each time — persistent listings suggest the price (not the market) is what's stuck; bring a comps-based counter.
Risks & watch-outs
- Climate carrying-cost: extreme-heat days projected 7→20/yr by 2055 (HVAC capex compounding) — expect insurance premiums to compound above CPI over the hold.
Questions for the listing agent
- It's been on market 36 days. Have you received any prior offers? Is the seller open to a 3% concession, seller financing, or rate buy-down credit?
- Built in 1979 — when were the roof, HVAC, electrical panel, plumbing, and water heater last replaced?
- What does the HOA fee cover, when was the last increase, and are there any pending special assessments or reserve-fund shortfalls?
- Any open or pending special assessments — roof, HVAC, plumbing, elevator, façade? What's the per-unit balance and payoff schedule, and is the seller paying it off at close or rolling it to the buyer?
- Is there a deadline driving the sale (1031 exchange, divorce, estate, relocation)? That informs how much negotiation room exists.
- Schools are A-rated — typically a magnet for longer-tenancy family renters. What's the average tenant stay here, and is there a school-zone premium baked into asking?
- Crime grade is D in this area — have there been break-ins, vandalism, or insurance claims at this property in the last 3 years? What carrier currently insures it and at what premium?
- The area grade is low — what's the realistic commute time and amenity access for the typical tenant pool here? Any planned neighborhood developments (good or bad) we should know about?
- What's the average days-on-market for RENTAL listings here right now (not sales)? A rising rental-DOM trend means longer vacancies and softer asking-rent achievability than the comps imply.
- What's the recent tenant-quality profile in this submarket — average credit score on applications, eviction rate, late-payment / NSF rate, and stable-employment percentage? A property-management company in the area should have these aggregated.
- How much new apartment / multifamily construction is in the pipeline within 1–3 miles? Heavy new supply (>2% of stock underway) typically softens rents 12–24 months out; light construction supports rent growth.
Investment metrics
- 1% rule
- 1.26% ✓
- Cap rate
- 6.82%
- Cash-on-cash
- 1.87%
- DSCR
- 1.08
- GRM
- 6.6
CMA / ARV
No comps found within radius.
Projected returns pro-forma
-3.0% appreciation · 1.6% rent growth · sell at horizon
- IRR
- -15.3%
- Equity multiple
- 0.46×
- Total profit
- $-56,976
- Equity at exit
- $56,644
- IRR
- -9.9%
- Equity multiple
- 0.44×
- Total profit
- $-59,766
- Equity at exit
- $32,847
Cash invested: $106,372 (down + closing). Projections, not guarantees.
Landlord ↔ Tenant lean methodology
- Overall (STATE)
- 18 Strongly Tenant-Friendly
- State California
- 18 Strongly Tenant-Friendly · D+13
- County
- — inherits STATE
- City
- — inherits STATE
ZIP-level market 92260
- Rents YoY
- 1.6%
- Active inventory
- 545
- Price-to-rent
- 6.6×
Monthly cashflow live
- Estimated rent
- $4,776 high interval (Pro) →
- Mortgage (P&I)
- −$1,992
- Tax from tax record
- −$515 /mo · $6,184/yr
- Insurance
- −$158
- HOA
- −$942
- Vacancy / Maint / Mgmt
- −$1,003
- Net cashflow
- $166
Break-even live
UW: 25.0% down · 7.5% · 30yr · 1.5% tax · 5.0% vac · 8.0% maint · 8.0% mgmt
Financing live
Cash to close
- Down payment
- $94,975
- Closing costs
- $11,397
- Reserves months
- —
- Total cash needed
- —
Loan-product check · same deal, 3 products live
Conventional
25% down · 7.5% · 30yr
- Down + closing
- —
- Monthly P&I
- —
- Monthly cashflow
- —
- DSCR
- —
- Eligible?
- —
Personal DTI + credit; lowest rate.
DSCR
20% down · 8.5% · 30yr
- Down + closing
- —
- Monthly P&I
- —
- Monthly cashflow
- —
- DSCR
- —
- Eligible?
- —
No personal income docs; deal must DSCR.
Hard money
10% down · 12.0% · 12mo
- Down + closing
- —
- Monthly P&I
- —
- Monthly cashflow
- —
- DSCR
- —
- Eligible?
- —
Short-term bridge; refi at stabilization.
Rent comps 40 comps
| Address | Beds | Baths | Sqft | Rent | $/sqft | DOM | Units | Dist |
|---|---|---|---|---|---|---|---|---|
| 21 Don Quixote Dr Rancho Mirage, CA | 2.0 | 2.0 | 1270 | $4,000 | $3.15 | 24d | 1 | 0.05mi |
| 223 Serena Dr Palm Desert, CA | 3.0 | 2.0 | 1584 | $4,800 | $3.03 | 44d | 1 | 0.09mi |
| 223 Serena Dr Palm Desert, CA | 3.0 | 2.0 | 1584 | $4,800 | $3.03 | 18d | 1 | 0.09mi |
| 221 Serena Dr Palm Desert, CA | 2.0 | 2.0 | 1347 | $5,500 | $4.08 | 44d | 1 | 0.09mi |
| 68 El Toro Dr Rancho Mirage, CA | 2.0 | 2.0 | 1381 | $4,000 | $2.90 | 24d | 1 | 0.11mi |
| 242 Serena Dr Palm Desert, CA | 2.0 | 2.0 | 1347 | $5,300 | $3.93 | 44d | 1 | 0.12mi |
| 207 Serena Dr Palm Desert, CA | 2.0 | 2.0 | 1584 | $5,900 | $3.72 | 44d | 1 | 0.12mi |
| 203 Serena Dr Palm Desert, CA | 2.0 | 2.0 | 1303 | $3,000 | $2.30 | 3d | 1 | 0.13mi |
| 235 Santa Barbara Cir Palm Desert, CA | 3.0 | 3.0 | 1800 | $7,500 | $4.17 | 44d | 1 | 0.19mi |
| 261 Santa Barbara Cir Palm Desert, CA | 2.0 | 2.0 | 1656 | $5,800 | $3.50 | 44d | 1 | 0.20mi |
| 291 Serena Dr Palm Desert, CA | 2.0 | 1.5 | 1303 | $5,300 | $4.07 | 44d | 1 | 0.21mi |
| 36 El Toro Dr Rancho Mirage, CA | 2.0 | 2.0 | 1270 | $4,000 | $3.15 | 24d | 1 | 0.21mi |
| 293 Serena Dr Palm Desert, CA | 2.0 | 2.0 | 1670 | $5,500 | $3.29 | 44d | 1 | 0.22mi |
| 240 Santa Barbara Cir Palm Desert, CA | 2.0 | 2.0 | 1457 | $6,000 | $4.12 | 24d | 1 | 0.22mi |
| 246 Santa Barbara Cir Palm Desert, CA | 2.0 | 2.0 | 1656 | $9,000 | $5.43 | 44d | 1 | 0.22mi |
| 254 Santa Barbara Cir Palm Desert, CA | 2.0 | 2.0 | 1656 | $8,000 | $4.83 | 44d | 1 | 0.22mi |
| 278 San Vicente Cir Palm Desert, CA | 2.0 | 2.0 | 1656 | $5,200 | $3.14 | 44d | 1 | 0.27mi |
| 134 Las Lomas Palm Desert, CA | 2.0 | 2.0 | 1584 | $7,500 | $4.73 | 44d | 1 | 0.27mi |
| 294 San Vicente Cir Palm Desert, CA | 2.0 | 2.0 | 1584 | $5,300 | $3.35 | 44d | 1 | 0.30mi |
| 144 Las Lomas Palm Desert, CA | 2.0 | 2.0 | 1584 | $6,000 | $3.79 | 24d | 1 | 0.30mi |
| 214 La Paz Way Palm Desert, CA | 2.0 | 1.5 | 1670 | $6,700 | $4.01 | 44d | 1 | 0.31mi |
| 320 Paseo Primavera Palm Desert, CA | 2.0 | 2.0 | 1303 | $3,000 | $2.30 | 44d | 1 | 0.32mi |
| 281 Tolosa Cir Palm Desert, CA | 2.0 | 2.0 | 1303 | $5,500 | $4.22 | 44d | 1 | 0.34mi |
| 110 Giralda Cir Palm Desert, CA | 2.0 | 2.0 | 1584 | $7,000 | $4.42 | 44d | 1 | 0.34mi |
| 114 Giralda Cir Palm Desert, CA | 2.0 | 2.0 | 1303 | $5,500 | $4.22 | 44d | 1 | 0.35mi |
| 280 Tolosa Cir Palm Desert, CA | 2.0 | 2.0 | 1347 | $6,000 | $4.45 | 24d | 1 | 0.36mi |
| 280 Tolosa Cir Palm Desert, CA | 2.0 | 2.0 | 1347 | $6,000 | $4.45 | 44d | 1 | 0.36mi |
| 16 Tortosa Dr Rancho Mirage, CA | 3.0 | 2.0 | 1720 | $7,495 | $4.36 | 44d | 1 | 0.37mi |
| 45 Cueta Dr Rancho Mirage, CA | 2.0 | 2.0 | 1270 | $3,000 | $2.36 | 44d | 1 | 0.37mi |
| 177 Las Lomas Palm Desert, CA | 2.0 | 2.0 | 1800 | $7,500 | $4.17 | 44d | 1 | 0.38mi |
| 347 Gran Via Palm Desert, CA | 2.0 | 2.0 | 1303 | $5,500 | $4.22 | 44d | 1 | 0.39mi |
| 345 Gran Via Palm Desert, CA | 2.0 | 2.0 | 1584 | $5,500 | $3.47 | 44d | 1 | 0.39mi |
| 264 Avenida del Sol Palm Desert, CA | 2.0 | 2.0 | 1800 | $6,000 | $3.33 | 44d | 1 | 0.40mi |
| 138 Gran Via Palm Desert, CA | 2.0 | 2.0 | 1457 | $5,500 | $3.77 | 44d | 1 | 0.42mi |
| 314 Gran Via Ct Palm Desert, CA | 2.0 | 1.5 | 1303 | $4,700 | $3.61 | 44d | 1 | 0.42mi |
| 389 Gran Via Palm Desert, CA | 3.0 | 2.0 | 1670 | $3,750 | $2.25 | 24d | 1 | 0.42mi |
| 205 Las Lomas Palm Desert, CA | 2.0 | 2.0 | 1457 | $6,000 | $4.12 | 44d | 1 | 0.42mi |
| 217 Las Lomas Palm Desert, CA | 2.0 | 2.0 | 1656 | $6,300 | $3.80 | 44d | 1 | 0.45mi |
| 101 Juan Cir Palm Desert, CA | 2.0 | 2.0 | 1600 | $6,500 | $4.06 | 44d | 1 | 0.46mi |
| 186 Madrid Ave Palm Desert, CA | 2.0 | 2.0 | 1800 | $7,100 | $3.94 | 44d | 1 | 0.47mi |
HOA detail condo
- Monthly dues
- $942 · $11,304/yr
- Assessments
- None detected in remarks — confirm with the listing agent.
Listing history 50 events
-
2026-06-13statusdays on market $379,900 Pending 36 DOM
-
2026-06-09days on market $379,900 Active Under Contract 33 DOM
-
2026-06-08days on market $379,900 Active Under Contract 32 DOM
-
2026-06-07days on market $379,900 Active Under Contract 31 DOM
-
2026-06-04days on market $379,900 Active Under Contract 28 DOM
-
2026-06-03days on market $379,900 Active Under Contract 27 DOM
-
2026-06-02days on market $379,900 Active Under Contract 26 DOM
-
2026-06-01days on market $379,900 Active Under Contract 25 DOM
-
2026-05-31days on market $379,900 Active Under Contract 24 DOM
-
2026-05-07historical
-
2026-05-07$379,900 Active 1718-char remark
-
2026-03-30status Active
-
2026-03-23status Pending
-
2026-03-20price $399,900
-
2026-02-20price $415,000
-
2025-11-12$425,000 Active
-
2025-09-22historical
-
2025-09-02$419,000 Active
-
2025-09-01historical
-
2025-08-26price $419,000
-
2025-05-19price $425,000
-
2025-03-11price $455,000
-
2025-02-20$461,000 Active
-
2024-06-18historical $5,300
-
2024-05-31$5,300
-
2024-04-16historical
-
2024-02-29$499,000 Active
-
2023-05-22soldstatus $448,000 Closed
-
2023-05-22soldstatus $448,000
-
2023-05-12status Pending
-
2023-04-05$459,000 Active
-
2015-09-08soldstatus $205,000 Sold
-
2015-09-08soldstatus $205,000
-
2015-08-21historical Contingent
-
2015-07-30price $209,000
-
2015-04-24$219,500 Active
-
2014-07-22historical
-
2014-04-23$219,000 Active
-
2014-04-17historical
-
2014-02-16$219,900 Active
-
2014-02-16historical
-
2013-12-14status Active
-
2013-11-30historical Hold
-
2013-11-13price $219,900
-
2013-09-17status Active
-
2013-08-04historical Hold
-
2013-05-16$229,000 Active
-
2012-07-06historical
-
2012-05-01status Active
-
2012-04-18historical Hold
ⓘ Source: listings_history table (triggers on properties + properties_extension) + one-shot
backfill from property_details.listing_events for pre-trigger history.
Tax reassessment forecast CA · Resets to sale price
- Current annual tax
- $6,184 · $515/mo
- Projected year-2 tax
- $6,184 · $515/mo
- Expected delta
- $0/yr ($0/mo · -0.0%)
ⓘ Screening estimate from a state-policy table — verify with the county assessor before closing.
Climate risk First Street
- Flood 1/10 Low FEMA zone X · 0% chance over 30 yrs
- Wildfire 3/10 Moderate
- Heat 9/10 Extreme 7 d/yr ≥114°F today · 20 d/yr by 30 yrs out
- Wind 1/10 Low
- Air quality 4/10 Moderate 5 unhealthy d/yr today · 6 by 30 yrs out
Nearby sold comps map
Loading sold comps map…
Walkable amenities ~0.75 mi
Loading nearby amenities…
Taxation est. · year 1
- Rental income
- $57,317
- − Mortgage interest
- −$21,280
- − Property taxes
- −$6,184
- − Insurance
- −$1,900
- − Repairs & maintenance
- −$4,585
- − Management
- −$4,585
- − HOA
- −$11,304
- − Depreciation
- −$11,052
- Taxable loss
- −$3,573
- Est. tax savings @ 24.0%
- +$857
- After-tax cash flow
- $2,844/yr
For passive investors: Depreciation is non-cash, so a rental often shows a tax loss while cash-flowing — sheltering income. Rental losses are passive: they offset passive income freely, and up to $25,000/yr can offset ordinary (W-2) income if you actively participate and your MAGI is under $100k (phasing out to $0 by $150k); unused losses carry forward. On sale, claimed depreciation is recaptured at up to 25%, and gains may owe capital-gains tax (a 1031 exchange can defer both). Figures are a year-1 estimate at your 24.0% rate — not tax advice; consult a CPA.
Schools (NCES district)
- District
- Desert Sands Unified
- NCES district ID
- 0611110
- Math proficiency
- 31% ▼ -4.00%
- Reading proficiency
- 56% ▲ 7.00%
- Median HH income
- $54,957
- Composite
- 37.77/100
- National rank
- #4346
- State rank
- #199 of 517 in CA
Livability — Palm Desert
- Score
- 51/100
- State rank
- #1050
- US rank
- #25164
Category grades
Schools grade is shown separately in the Schools card above.
Census & demographics
- Census place
- Palm Desert, CA
- County
- Riverside County · 2,287,001 people
- City population
- 58,615
- Metro
- Riverside-San Bernardino-Ontario, CA
- Population (ZIP)
- 30,523
- Household income
- $70,091
- Rent vs Own
- Severe rent burden
- 1734.0
Population outlook (Riverside County) Hauer SSP2
- Today (2025)
- 2,664,475 people
- By 2030
- 2,802,692 · +5.2%
- By 2040
- 3,050,904 · +14.5%
- By 2050
- 3,256,783 · +22.2%
- By 2075
- 3,655,058 · +37.2%
- By 2100
- 3,766,594 · +41.4%
Race, ethnicity, and origin ACS 2023
- Neighborhood character
- Majority White (61%)
- Race & ethnicity
- White 61% Hispanic / Latino 31% Two or more races 20% Asian 4% Black 2%
- Hispanic origin (detail)
- Mexican 25%
- Common ancestry
- Italian 4% Lithuanian 3% Slovak 2%
- Foreign-born
- 18% · Canada, South Korea, Vietnam
- Languages at home
- 73% English-only · Spanish 22% French/Haitian/Cajun 1% Other Indo-European 1%
Political lean MEDSL · Riverside
- 2024 margin
- Toss-up / Even · D 48.0% · R 49.3% · Other 2.6%
- 2008→2024 swing
- -3.6pp toward R · 2008: 2.3pp · 2024: -1.3pp
- All cycles
- 2024: R+1.3 2020: D+8.0 2016: D+4.3 2012: R+0.4 2008: D+2.3
Not yet ingested
- Civics
- —
Market trends
- HPI YoY
- ▼ -364.94%
- Current HPI
- 294.9425
- Rent YoY
- ▲ 1.60%
- Metro
- Riverside-San Bernardino-Ontario, CA
- State GDP YoY
- ▲ 3.21%
- F500 in state
- 116
Industry mix (Fortune 500 HQ in CA)
| Industry | F500 HQs | Revenue |
|---|---|---|
| Technology | 27 | $1,492B |
|
||
| Financial Services | 3 | $174B |
|
||
| Retail | 3 | $44B |
|
||
| Insurance | 3 | $26B |
|
||
| Media / Entertainment | 2 | $115B |
|
||
| Pharmaceuticals / Biotech | 2 | $62B |
|
||
Price history
+123.5% since first listed55 events — show timeline
- 2026-06-15 Sold (MLS) $379,900 GPSMLS
- 2026-06-12 Pending — GPSMLS
- 2026-05-22 Contingent — GPSMLS
- 2026-05-07 Listing Removed — GPSMLS
- 2026-05-07 Listed $379,900 GPSMLS
- 2026-03-30 Relisted — GPSMLS
- 2026-03-23 Pending — GPSMLS
- 2026-03-20 Price Changed $399,900 GPSMLS
- 2026-02-20 Price Changed $415,000 GPSMLS
- 2025-11-12 Listed $425,000 GPSMLS
- 2025-09-22 Listing Removed — GPSMLS
- 2025-09-02 Listed $419,000 GPSMLS
- 2025-09-01 Listing Removed — GPSMLS
- 2025-08-26 Price Changed $419,000 GPSMLS
- 2025-05-19 Price Changed $425,000 GPSMLS
- 2025-03-11 Price Changed $455,000 GPSMLS
- 2025-02-20 Listed $461,000 GPSMLS
- 2024-06-18 Rental Removed $5,300 CRMLS
- 2024-05-31 Listed for Rent $5,300 CRMLS
- 2024-04-16 Listing Removed — GPSMLS
- 2024-02-29 Listed $499,000 GPSMLS
- 2023-05-22 Sold (Public Records) $448,000 Public Records
- 2023-05-22 Sold (MLS) $448,000 GPSMLS
- 2023-05-12 Pending — GPSMLS
- 2023-04-05 Listed $459,000 GPSMLS
- 2015-09-08 Sold (Public Records) $205,000 Public Records
- 2015-09-08 Sold (MLS) $205,000 GPSMLS
- 2015-08-21 Contingent — GPSMLS
- 2015-07-30 Price Changed $209,000 GPSMLS
- 2015-04-24 Listed $219,500 GPSMLS
- 2014-07-22 Listing Removed — GPSMLS
- 2014-04-23 Listed $219,000 GPSMLS
- 2014-04-17 Listing Removed — GPSMLS
- 2014-02-16 Listed $219,900 GPSMLS
- 2014-02-16 Listing Removed — GPSMLS
- 2013-12-14 Relisted — GPSMLS
- 2013-11-30 Delisted — GPSMLS
- 2013-11-13 Price Changed $219,900 GPSMLS
- 2013-09-17 Relisted — GPSMLS
- 2013-08-04 Delisted — GPSMLS
- 2013-05-16 Listed $229,000 GPSMLS
- 2012-07-06 Listing Removed — GPSMLS
- 2012-05-01 Relisted — GPSMLS
- 2012-04-18 Delisted — GPSMLS
- 2012-01-06 Listed $210,000 GPSMLS
- 2011-10-03 Listing Removed — GPSMLS
- 2011-06-25 Price Changed $194,500 GPSMLS
- 2011-01-08 Listed $199,000 GPSMLS
- 2003-01-10 Sold (Public Records) $205,000 Public Records
- 2002-12-26 Listing Removed — GPSMLS
- 2002-10-04 Listed $224,500 GPSMLS
- 1998-07-02 Sold (Public Records) $121,000 Public Records
- 1995-02-07 Sold (Public Records) $147,000 Public Records
- 1993-08-20 Sold (Public Records) $145,000 Public Records
- 1991-08-30 Sold (Public Records) $170,000 Public Records
Property tax history
+4.8%/yrLatest (2025): $6,184 · +2.4% YoY. Source: county tax records.
Cash-flow waterfall
monthlySold comps — $/sqft
last 12 mo · ≤1 miLoading sold comps…