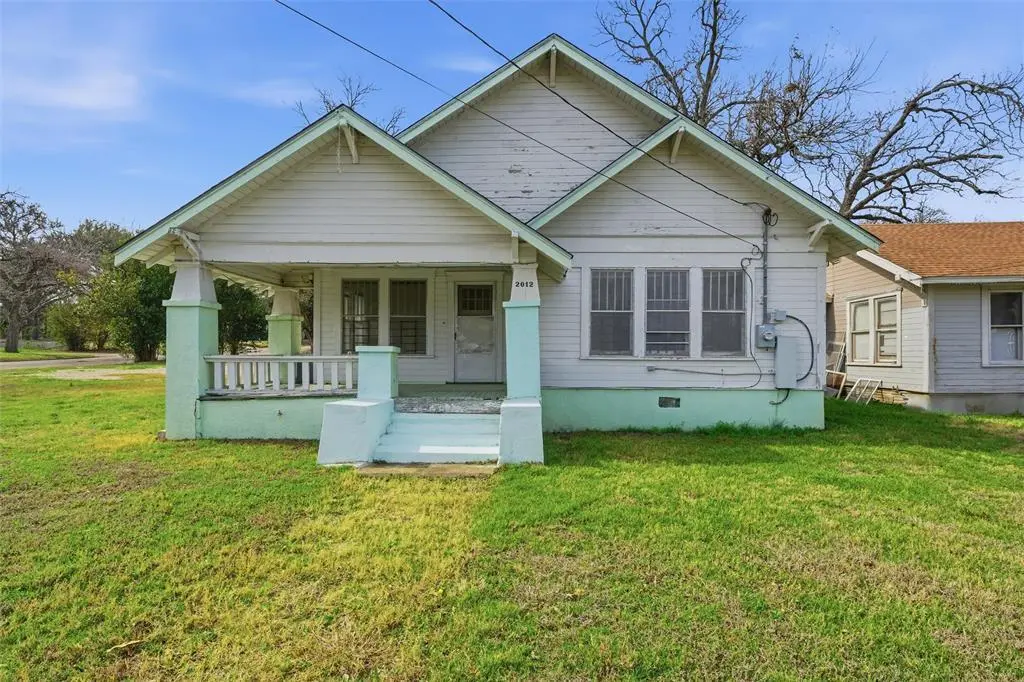
2012 N 5th St · Waco, TX
Flood risk No data
- FEMA flood zone
- —
- Chance of flooding over 30 yrs
- —
- Est. flood insurance / yr
- —
Fire risk No data
- Est. fire insurance / yr
- —
Heat risk No data
- Hot days now (above threshold)
- —
- Hot days in 30 yrs
- —
Wind risk No data
- Chance of severe wind over 30 yrs
- —
Air-quality risk No data
- Unhealthy air days now
- —
- Unhealthy air days in 30 yrs
- —
Risk factors via First Street. Map © Google.
Why this score? — see what drove the D grade
The composite is a weighted blend of 9 inputs, each scored 0–100. Each bar is that input's sub-score; the figure is the points it added to the 100-point composite (weight × sub-score).
- ARV discount +15.0/15.0
- Cash flow +10.1/30.0
- 1% rule +4.1/10.0
- Livability +3.7/5.0
- DSCR +2.9/10.0
- Condition / age +2.5/5.0
- Rent growth +2.3/5.0
- Schools +1.8/10.0
- Appreciation +0.0/10.0
$175,000
🖨 Deal sheet (PDF) 📄 Offer letter ✓ Due diligence
Listing remarks MLS
Zoned O-3 for short-term rental use and located less than a mile from Cameron Park, this 3-bedroom, 2-bath home offers a compelling opportunity in a fast-improving area near Downtown Waco. A spacious covered front porch sets the stage for relaxing evenings and adds real curb appeal. Inside, the living room is anchored by a fireplace with built-in shelving, giving the space character and a clear focal point. The home flows easily from the dining area into the kitchen, making it functional for everyday living and entertaining. The kitchen features updated cabinets, countertops, and appliances, along with ample storage and workspace. With alley access and a location just minutes from Downtown and Baylor, this is a great chance to come make this home something special. The surrounding area continues to see new development and investment, adding to the long-term appeal. Whether you’re a homeowner or an investor, this property offers the kind of location and potential that’s getting harder to find.
Key facts
- Covered front porch
- Alley access
- Updated cabinets
Tags
Neighborhood map
What this means for you Summary
Snapshot
- This is a 3-bed/2.0-bath single-family listed at $175k.
Deal economics
- At list price, monthly cash flow is $-103 ($-1k/yr) — negative.
- To cash-flow at today's rent, offer at most $157k (10.4% below list).
- To meet the 1% rule (rent ≥ 1% of price), the offer needs to be $159k (9.0% below list).
- Recommended offer: $154k (12.0% below list) — sets the bar for market timing.
- Cap rate 5.6% vs local median 3.9% in Waco — top-decile yield for the area; either an underpriced asset or a hidden risk that comps aren't pricing in. Stress-test before assuming the spread holds.
Location & tenants
- Location reads 74/100 on livability (#166 in TX, #4,378 nationally) — a middle-class / working-renter tenant base. Strengths: cost of living A+, housing A+, health & safety A+; Watch: crime D, commute F, employment D-.
- Waco ISD (urban): math 20% / reading 24% proficiency, ranked #773 of 826 in TX (top 94%) — low school quality limits family demand, transient renter base, plan for 1-2y turnover; 81% free/reduced lunch — lower-income household profile, screen leases tightly.
- Zoned schools: J H Hines El (math 8% / reading 12%, grade F, #4,259 of 4,322 statewide, top 99%, 406 students, 98% FRL, charter); G W Carver Middle (math 9% / reading 13%, grade F, #1,634 of 1,662 statewide, top 99%, 393 students, 96% FRL, charter); Waco H S (math 26% / reading 24%, grade F, #1,250 of 1,632 statewide, top 77%, 2,011 students, 88% FRL).
- Market conditions: Rents soft (-0.8%/yr); 378 active listings in the ZIP; 40 comparable units currently listed for rent nearby; rentals at typical pace (median 23d on market — plan ~3-4 weeks tenant-placement turnaround); 1,014 units permitted in McLennan County in 2024 (200 in 5+ unit buildings).
Forward outlook
- Local home prices are declining (-3.0%/yr); year-one equity from $1k of loan paydown is wiped out by about $5k of value loss. Plan a longer hold.
- McLennan County population projected at +17% by 2050 — long-run rental-demand tailwind backs the buy-and-hold thesis.
Negotiation context
- It's been on market 123 days — a 12% lower offer ($154k) is reasonable based on typical stale-listing flexibility.
- 4 sale attempts since 2y ago with the ask held roughly flat each time — persistent listings suggest the price (not the market) is what's stuck; bring a comps-based counter.
Risks & watch-outs
- Watch-outs: property tax is 2.5% of price; built in 1920 — expect roof / HVAC / electrical / plumbing capex.
Questions for the listing agent
- What do current leases actually rent for vs. the listed asking? Can we see a recent rent roll and the last 12 months of T-12 income?
- It's been on market 123 days. Have you received any prior offers? Is the seller open to a 12% concession, seller financing, or rate buy-down credit?
- Built in 1920 — when were the roof, HVAC, electrical panel, plumbing, and water heater last replaced?
- Property tax is high relative to price — has the assessment been appealed recently, and will the sale trigger a re-assessment?
- Why hasn't it sold? Are there any deal-killer items the seller is aware of (foundation, flood, title, zoning, code violations)?
- Is there a deadline driving the sale (1031 exchange, divorce, estate, relocation)? That informs how much negotiation room exists.
- Schools are D-rated, which usually means shorter tenancies and higher turnover. Who's the typical renter profile here, and what's been the actual vacancy rate?
- Crime grade is D in this area — have there been break-ins, vandalism, or insurance claims at this property in the last 3 years? What carrier currently insures it and at what premium?
- The area grade is low — what's the realistic commute time and amenity access for the typical tenant pool here? Any planned neighborhood developments (good or bad) we should know about?
- What's the average days-on-market for RENTAL listings here right now (not sales)? A rising rental-DOM trend means longer vacancies and softer asking-rent achievability than the comps imply.
- What's the recent tenant-quality profile in this submarket — average credit score on applications, eviction rate, late-payment / NSF rate, and stable-employment percentage? A property-management company in the area should have these aggregated.
- How much new for-sale + rental construction is in the pipeline within 1–3 miles? Heavy new supply typically softens prices + rents 12–24 months out; constrained supply supports both.
Investment metrics
- 1% rule
- 0.91% ✗
- Cap rate
- 5.59%
- Cash-on-cash
- -2.52%
- DSCR
- 0.89
- GRM
- 9.2
CMA / ARV
- ARV (median comp)
- $231,270
- List price
- $175,000
- Delta
- -24.33%
- Verdict
- UNDERPRICED
- Comps
- 20 within 1.0 mi
Show comp detail 12 sales within ~0.75 mi
| Address | Dist | Beds/Ba | Sqft | Sold | Price | $/sf | Match |
|---|---|---|---|---|---|---|---|
| 1610 N 6th St | 0.33mi | 3/2.0 | 1,407 (+0%) | 3mo | $250,000 | $178 | 82 |
| 528 Sedwick Ave | 0.07mi | 2/2.0 (-1) | 1,352 (-4%) | 11mo | $219,900 | $163 | 77 |
| 1618 N 6th St | 0.31mi | 2/2.0 (-1) | 1,451 (+4%) | 2mo | $217,000 | $150 | 73 |
| 1525 N 6th St | 0.36mi | 3/2.0 | 1,322 (-6%) | 11mo | $200,000 | $151 | 65 |
| 2016 N 7th St | 0.19mi | 3/2.5 | 1,500 (+7%) | 16mo | $337,500 | $225 | 64 |
| 1819 N 10th | 0.30mi | 3/2.0 | 1,274 (-9%) | 9mo | $144,500 | $113 | 63 |
| 1509 Cumberland Ave | 0.56mi | 3/2.0 | 1,394 (-1%) | 14mo | $150,000 | $108 | 62 |
| 1512 Live Oak Ave | 0.49mi | 3/2.0 | 1,432 (+2%) | 15mo | $225,000 | $157 | 61 |
| 1519 N 5th St N | 0.36mi | 3/2.0 | 1,317 (-6%) | 16mo | $329,500 | $250 | 60 |
| 401 Carver St | 0.73mi | 3/2.0 | 1,381 (-2%) | 11mo | $130,000 | $94 | 54 |
| 1322 N 11th St | 0.71mi | 3/2.5 | 1,528 (+9%) | 2mo | $269,000 | $176 | 48 |
| 208 Dearborn St | 0.68mi | 2/2.0 (-1) | 1,263 (-10%) | 14mo | $215,000 | $170 | 35 |
Match score weights: distance 35% · size 25% · config 20% · recency 20%. Top-matched comps best support the ARV.
Projected returns pro-forma
-3.0% appreciation · 0.0% rent growth · sell at horizon
- IRR
- -24.3%
- Equity multiple
- 0.19×
- Total profit
- $-39,461
- Equity at exit
- $26,093
- IRR
- -33.9%
- Equity multiple
- -0.23×
- Total profit
- $-60,359
- Equity at exit
- $15,131
Cash invested: $49,000 (down + closing). Projections, not guarantees.
Landlord ↔ Tenant lean methodology
- Overall (STATE)
- 87 Strongly Landlord-Friendly
- State Texas
- 87 Strongly Landlord-Friendly · R+5
- County
- — inherits STATE
- City
- — inherits STATE
ZIP-level market 76708
- Home prices YoY
- -26.5%
- Rents YoY
- -0.8%
- Active inventory
- 378
- Price-to-rent
- 9.2×
Monthly cashflow live
- Estimated rent
- $1,592 high interval (Pro) →
- Mortgage (P&I)
- −$918
- Tax from tax record
- −$370 /mo · $4,441/yr
- Insurance
- −$73
- HOA
- −$0
- Vacancy / Maint / Mgmt
- −$334
- Net cashflow
- $-103
Break-even live
Sensitivity live
| Price | -10% $-4 | -5% $-53 | +0% $-103 | +5% $-152 | +10% $-202 |
|---|---|---|---|---|---|
| Rent | -10% $-229 | -5% $-166 | +0% $-103 | +5% $-40 | +10% $23 |
| Rate | -1.0pp $-15 | -0.5pp $-58 | base $-103 | +0.5pp $-148 | +1.0pp $-194 |
UW: 25.0% down · 7.5% · 30yr · 1.5% tax · 5.0% vac · 8.0% maint · 8.0% mgmt
Financing live
Cash to close
- Down payment
- $43,750
- Closing costs
- $5,250
- Reserves months
- —
- Total cash needed
- —
Loan-product check · same deal, 3 products live
Conventional
25% down · 7.5% · 30yr
- Down + closing
- —
- Monthly P&I
- —
- Monthly cashflow
- —
- DSCR
- —
- Eligible?
- —
Personal DTI + credit; lowest rate.
DSCR
20% down · 8.5% · 30yr
- Down + closing
- —
- Monthly P&I
- —
- Monthly cashflow
- —
- DSCR
- —
- Eligible?
- —
No personal income docs; deal must DSCR.
Hard money
10% down · 12.0% · 12mo
- Down + closing
- —
- Monthly P&I
- —
- Monthly cashflow
- —
- DSCR
- —
- Eligible?
- —
Short-term bridge; refi at stabilization.
Rent comps 40 comps
| Address | Beds | Baths | Sqft | Rent | $/sqft | DOM | Units | Dist |
|---|---|---|---|---|---|---|---|---|
| 712 Proctor Ave Waco, TX | 4.0 | 2.0 | 1184 | $1,450 | $1.22 | 22d | 1 | 0.20mi |
| 1606 N 9th St Waco, TX | 4.0 | 2.0 | 1392 | $1,525 | $1.10 | 22d | 1 | 0.42mi |
| 1600 N 11th St Unit A Waco, TX | 3.0 | 2.0 | 1217 | $1,750 | $1.44 | 45d | 1 | 0.57mi |
| 1511 Maple Ave Waco, TX | 3.0 | 2.0 | 1487 | $1,450 | $0.98 | 45d | 1 | 0.57mi |
| 1621 Alexander Ave Unit A Waco, TX | 3.0 | 2.0 | 1400 | $1,695 | $1.21 | 22d | 1 | 0.74mi |
| 1818 Windsor Ave Waco, TX | 4.0 | 2.0 | 1112 | $1,625 | $1.46 | 22d | 1 | 0.77mi |
| 412 Dearborn St Waco, TX | 3.0 | 2.0 | 1572 | $2,000 | $1.27 | 22d | 1 | 0.79mi |
| 1825 Cumberland Ave Waco, TX | 3.0 | 1.0 | 1400 | $1,325 | $0.95 | 15d | 1 | 0.80mi |
| 1110 N 11th St Waco, TX | 3.0 | 2.0 | 1172 | $1,495 | $1.28 | 22d | 1 | 0.82mi |
| 1104 N 11th St Waco, TX | 3.0 | 2.0 | 1231 | $1,650 | $1.34 | 22d | 1 | 0.83mi |
| 1920 Windsor Ave Waco, TX | 3.0 | 1.0 | 1216 | $1,200 | $0.99 | 45d | 1 | 0.86mi |
| 1920 Lyle Ave Waco, TX | 2.0 | 1.0 | 1519 | $1,200 | $0.79 | 45d | 1 | 0.86mi |
| 1920 Lyle Ave Waco, TX | 2.0 | 1.0 | 1519 | $1,200 | $0.79 | 22d | 1 | 0.86mi |
| 1815 Seneca Ave Waco, TX | 3.0 | 2.0 | 1471 | $1,650 | $1.12 | 22d | 1 | 0.89mi |
| 2000 Windsor Ave Waco, TX | 4.0 | 2.5 | 1450 | $1,800 | $1.24 | 45d | 1 | 0.89mi |
| 1821 Algonquin St Waco, TX | 2.0 | 1.0 | 930 | $1,150 | $1.24 | 45d | 1 | 0.92mi |
| 3400 Adeline Dr Waco, TX | 2.0 | 1.0 | 1232 | $1,150 | $0.93 | 45d | 1 | 0.96mi |
| 804 N 11th St Waco, TX | 1.0–2.0 | 1.0 | 838 | $1,200 | $1.43 | 22d | 1 | 0.98mi |
| 1104 Sherman St Waco, TX | 2.0 | 1.0 | 1120 | $1,500 | $1.34 | 45d | 1 | 1.03mi |
| 2121 Lyle Ave Waco, TX | 2.0 | 1.0 | 1080 | $1,000 | $0.93 | 15d | 1 | 1.03mi |
| 716 N 13th St Waco, TX | 4.0 | 2.0 | 1349 | $1,675 | $1.24 | 22d | 1 | 1.09mi |
| 2017 Broadway St Waco, TX | 3.0 | 1.0 | 1247 | $1,800 | $1.44 | 45d | 1 | 1.09mi |
| 108 Choctaw Ct Waco, TX | 3.0 | 2.0 | 1273 | $1,600 | $1.26 | 15d | 1 | 1.09mi |
| 2001 Bosque Blvd Waco, TX | 3.0 | 1.0 | 1628 | $1,100 | $0.68 | 45d | 1 | 1.21mi |
| 1000 N 19th St Waco, TX | 3.0 | 1.5 | 1800 | $2,050 | $1.14 | 22d | 1 | 1.22mi |
| 609 Sherman St Waco, TX | 3.0 | 2.0 | 1028 | $1,449 | $1.41 | 22d | 1 | 1.26mi |
| 2505 Proctor Ave Waco, TX | 3.0 | 2.0 | 1588 | $1,550 | $0.98 | 22d | 1 | 1.27mi |
| 2401 McKenzie Ave Waco, TX | 3.0 | 1.5 | 1288 | $1,300 | $1.01 | 22d | 1 | 1.28mi |
| 1400 N 23rd St Waco, TX | 4.0 | 2.0 | 1650 | $1,575 | $0.95 | 15d | 1 | 1.29mi |
| 215 Washington Ave Waco, TX | 1.0–4.0 | 1.0–4.0 | 919 | $1,737 | $1.89 | 22d | 1 | 1.29mi |
| 2504 Lyle Ave Waco, TX | 3.0 | 2.0 | 1028 | $1,475 | $1.43 | 22d | 1 | 1.29mi |
| 2400 Reuter Ave Waco, TX | 4.0 | 2.0 | 1426 | $1,650 | $1.16 | 22d | 1 | 1.30mi |
| 1500 E James St Unit A Waco, TX | 4.0 | 4.0 | 1764 | $2,750 | $1.56 | 45d | 1 | 1.33mi |
| 2601 Herring Ave Unit 1 Waco, TX | 3.0 | 1.0 | 989 | $1,295 | $1.31 | 45d | 1 | 1.34mi |
| 2621 Windsor Ave Waco, TX | 2.0 | 1.0 | 1108 | $1,175 | $1.06 | 22d | 1 | 1.36mi |
| 2511 Parrott Ave Waco, TX | 3.0 | 2.0 | 1463 | $1,695 | $1.16 | 45d | 1 | 1.36mi |
| 2600 McKenzie Ave Waco, TX | 3.0 | 1.0 | 1096 | $1,395 | $1.27 | 22d | 1 | 1.41mi |
| 2704 Herring Ave Waco, TX | 2.0 | 2.0 | 1286 | $1,750 | $1.36 | 22d | 1 | 1.41mi |
| 2714 Windsor Ave Waco, TX | 2.0 | 1.0 | 979 | $1,300 | $1.33 | 45d | 1 | 1.44mi |
| 2712 Lyle Ave Waco, TX | 3.0 | 1.0 | 1100 | $1,500 | $1.36 | 22d | 1 | 1.44mi |
Listing history 26 events
-
2026-06-21days on market $175,000 Active 123 DOM
-
2026-06-18days on market $175,000 Active 120 DOM
-
2026-06-17days on market $175,000 Active 119 DOM
-
2026-06-16days on market $175,000 Active 118 DOM
-
2026-06-15days on market $175,000 Active 117 DOM
-
2026-06-14days on market $175,000 Active 115 DOM
-
2026-06-13days on market $175,000 Active 114 DOM
-
2026-06-10days on market $175,000 Active 112 DOM
-
2026-06-09days on market $175,000 Active 111 DOM
-
2026-06-08days on market $175,000 Active 110 DOM
-
2026-06-07days on market $175,000 Active 109 DOM
-
2026-06-05days on market $175,000 Active 106 DOM
-
2026-06-03days on market $175,000 Active 105 DOM
-
2026-06-02days on market $175,000 Active 104 DOM
-
2026-06-01days on market $175,000 Active 103 DOM
-
2026-05-31days on market $175,000 Active 102 DOM
-
2026-05-30days on market $175,000 Active 101 DOM
-
2026-02-18$175,000 Active 1019-char remark
Show marketing remark (1019 chars)
Zoned O-3 for short-term rental use and located less than a mile from Cameron Park, this 3-bedroom, 2-bath home offers a compelling opportunity in a fast-improving area near Downtown Waco. A spacious covered front porch sets the stage for relaxing evenings and adds real curb appeal. Inside, the living room is anchored by a fireplace with built-in shelving, giving the space character and a clear focal point. The home flows easily from the dining area into the kitchen, making it functional for everyday living and entertaining. The kitchen features updated cabinets, countertops, and appliances, along with ample storage and workspace. With alley access and a location just minutes from Downtown and Baylor, this is a great chance to come make this home something special. The surrounding area continues to see new development and investment, adding to the long-term appeal. Whether you’re a homeowner or an investor, this property offers the kind of location and potential that’s getting harder to find.
-
2026-01-03historical
-
2025-07-16$199,000 Active
-
2025-06-30historical
-
2024-12-20$205,000 Active
-
2024-09-17soldstatus
-
2024-09-16soldstatus
-
2024-08-06$260,000
-
2003-10-08soldstatus
ⓘ Source: listings_history table (triggers on properties + properties_extension) + one-shot
backfill from property_details.listing_events for pre-trigger history.
Tax reassessment forecast TX · Resets to sale price
- Current annual tax
- $4,441 · $370/mo
- Projected year-2 tax
- $4,441 · $370/mo
- Expected delta
- $0/yr ($0/mo · 0.0%)
ⓘ Screening estimate from a state-policy table — verify with the county assessor before closing.
Nearby sold comps map
Loading sold comps map…
Walkable amenities ~0.75 mi
Loading nearby amenities…
Taxation est. · year 1
- Rental income
- $19,106
- − Mortgage interest
- −$9,803
- − Property taxes
- −$4,441
- − Insurance
- −$875
- − Repairs & maintenance
- −$1,528
- − Management
- −$1,528
- − Depreciation
- −$5,091
- Taxable loss
- −$4,161
- Est. tax savings @ 24.0%
- +$999
- After-tax cash flow
- $-236/yr
For passive investors: Depreciation is non-cash, so a rental often shows a tax loss while cash-flowing — sheltering income. Rental losses are passive: they offset passive income freely, and up to $25,000/yr can offset ordinary (W-2) income if you actively participate and your MAGI is under $100k (phasing out to $0 by $150k); unused losses carry forward. On sale, claimed depreciation is recaptured at up to 25%, and gains may owe capital-gains tax (a 1031 exchange can defer both). Figures are a year-1 estimate at your 24.0% rate — not tax advice; consult a CPA.
Schools (NCES district)
- District
- Waco ISD
- NCES district ID
- 4844280
- Math proficiency
- 20% ▼ -14.00%
- Reading proficiency
- 24% ▼ -6.00%
- Median HH income
- $29,208
- Composite
- 17.57/100
- National rank
- #9043
- State rank
- #773 of 826 in TX
Livability — Waco
- Score
- 74/100
- State rank
- #166
- US rank
- #4378
Category grades
Schools grade is shown separately in the Schools card above.
Census & demographics
- Census place
- Waco, TX
- County
- McLennan County · 213,088 people
- City population
- 125,319
- Metro
- Waco, TX
- Population (ZIP)
- 27,790
- Household income
- $68,856
- Rent vs Own
- Severe rent burden
- 583.0
Population outlook (McLennan County) Hauer SSP2
- Today (2025)
- 264,191 people
- By 2030
- 273,578 · +3.6%
- By 2040
- 291,506 · +10.3%
- By 2050
- 308,044 · +16.6%
- By 2075
- 349,648 · +32.3%
- By 2100
- 364,779 · +38.1%
Race, ethnicity, and origin ACS 2023
- Neighborhood character
- Diverse neighborhood (Simpson 0.63)
- Race & ethnicity
- White 50% Hispanic / Latino 31% Two or more races 20% Black 13% Asian 2%
- Hispanic origin (detail)
- Mexican 28%
- Common ancestry
- Slovak 2% Lithuanian 1% Italian 1%
- Foreign-born
- 11% · Canada, Vietnam
- Languages at home
- 76% English-only · Spanish 21% Other Asian/Pacific 1%
Political lean MEDSL · McLennan
- 2024 margin
- Solid R (+30.9) · D 34.0% · R 64.9% · Other 1.0%
- 2008→2024 swing
- -7.0pp toward R · 2008: -23.9pp · 2024: -30.9pp
- All cycles
- 2024: R+30.9 2020: R+23.4 2016: R+27.1 2012: R+29.8 2008: R+23.9
Not yet ingested
- Civics
- —
Market trends
- HPI YoY
- ▼ -78.80%
- Current HPI
- 218.9643
- Rent YoY
- ▼ -0.80%
- Metro
- Waco, TX
- State GDP YoY
- ▲ 3.95%
- F500 in state
- 110
Industry mix (Fortune 500 HQ in TX)
| Industry | F500 HQs | Revenue |
|---|---|---|
| Energy | 16 | $1,198B |
|
||
| Technology | 5 | $198B |
|
||
| Engineering / Construction | 4 | $72B |
|
||
| Energy Services | 3 | $60B |
|
||
| Utilities | 3 | $41B |
|
||
| Healthcare | 2 | $330B |
|
||
Price history
-32.7% since first listed9 events — show timeline
- 2026-02-18 Listed $175,000 NTREIS
- 2026-01-03 Listing Removed — NTREIS
- 2025-07-16 Listed $199,000 NTREIS
- 2025-06-30 Listing Removed — NTREIS
- 2024-12-20 Listed $205,000 NTREIS
- 2024-09-17 Sold (Public Records) — Public Records
- 2024-09-16 Sold (MLS) — NTREIS
- 2024-08-06 Listed $260,000 NTREIS
- 2003-10-08 Sold (Public Records) — Public Records
Property tax history
+14.7%/yrLatest (2025): $4,441 · +95.4% YoY. Source: county tax records.
Cash-flow waterfall
monthlySold comps — $/sqft
last 12 mo · ≤1 miLoading sold comps…