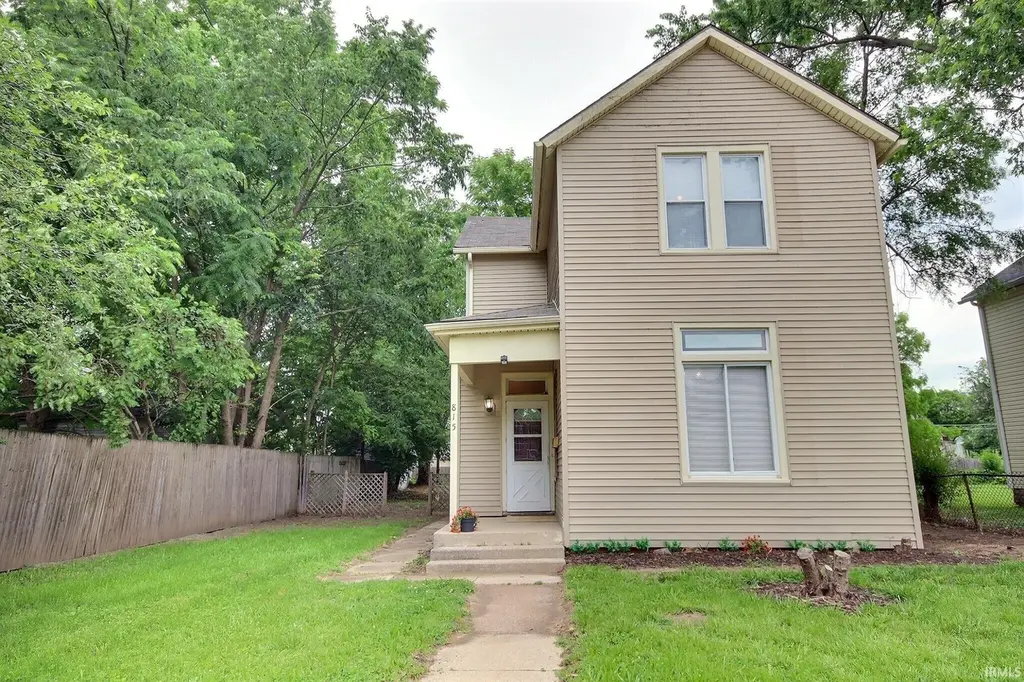
815 Eckart St · Fort Wayne, IN
Flood risk 1/10 · Minimal
- FEMA flood zone
- X (unshaded)
- Chance of flooding over 30 yrs
- 0.0%
- Est. flood insurance / yr
- $473 – $860
Fire risk 1/10 · Minimal
- Est. fire insurance / yr
- $717 – $1,331
Heat risk 3/10 · Minor
- Hot days now (above 100°F)
- 7 days/yr
- Hot days in 30 yrs
- 17 days/yr
Wind risk 2/10 · Minimal
- Chance of severe wind over 30 yrs
- —
Air-quality risk 3/10 · Minor
- Unhealthy air days now
- 2 days/yr
- Unhealthy air days in 30 yrs
- 3 days/yr
Risk factors via First Street. Map © Google.
Why this score? — see what drove the D- grade
The composite is a weighted blend of 9 inputs, each scored 0–100. Each bar is that input's sub-score; the figure is the points it added to the 100-point composite (weight × sub-score).
- Cash flow +14.5/30.0
- DSCR +4.4/10.0
- Livability +4.2/5.0
- Rent growth +3.7/5.0
- 1% rule +3.0/10.0
- ARV discount +3.0/15.0
- Condition / age +2.5/5.0
- Schools +2.2/10.0
- Appreciation +0.0/10.0
$169,900
🖨 Deal sheet (PDF) 📄 Offer letter ✓ Due diligence
Listing remarks MLS
Big 5 bedroom 2 bath handyman special! Selling as is, cash only!
Key facts
- Updated electrical
- Fresh paint
- New flooring
Tags
Property features AI
Finance
- Other: Zoning: R1
Exterior
- Utilities: Public water; Public sewer
- Home design: Single-family residence; Site-built home; Two stories
- Construction: Vinyl siding
- Exterior features: Level lot; Lot dimensions approx. 39 x 130; Lot size about 0.17 acres; Asphalt roof
Interior
- Kitchen: Dishwasher; Refrigerator; Gas oven; Gas range
- Bedrooms: Total rooms: 8
- Bathrooms: Two full bathrooms; One main-level bathroom
- Heating & cooling: Forced air heating; Central air conditioning; Ceiling fans
- Interior features: Ceiling fans throughout; One fireplace
- Laundry & utility: Laundry on main level; Gas water heater
Neighborhood map
What this means for you Summary
Snapshot
- This is a 4-bed/1.0-bath single-family listed at $170k.
Deal economics
- At list price, monthly cash flow is $37 ($449/yr) — positive.
- The deal already cash-flows at list — no discount required.
- To meet the 1% rule (rent ≥ 1% of price), the offer needs to be $135k (20.3% below list).
- Recommended offer: $135k (20.3% below list) — sets the bar for 1% rule.
- Cap rate 6.6% vs local median 4.7% in Fort Wayne — top-decile yield for the area; either an underpriced asset or a hidden risk that comps aren't pricing in. Stress-test before assuming the spread holds.
Location & tenants
- Location reads 84/100 on livability (#6 in IN, #676 nationally) — a professional / high-income tenant draw. Strengths: amenities A+, commute A+, cost of living A+; Watch: crime C-, employment D+.
- Fort Wayne Community Schools (urban): math 22% / reading 29% proficiency, ranked #263 of 301 in IN (top 87%) — low school quality limits family demand, transient renter base, plan for 1-2y turnover; 60% free/reduced lunch — lower-income household profile, screen leases tightly.
- Zoned schools: Merle J Abbett Elementary School (math 4% / reading 10%, grade F, #962 of 994 statewide, top 97%, 498 students, 86% FRL); Lane Middle School (math 9% / reading 20%, grade F, #300 of 330 statewide, top 91%, 710 students, 74% FRL); South Side High School (math 12% / reading 39%, grade F, #322 of 369 statewide, top 87%, 1,423 students, 73% FRL) — zoned schools average 78% FRL vs 60% district-wide (18 pts higher); higher-poverty schools than district average — tighter screening recommended.
- Market conditions: Rents rising fast (+4.9%/yr); 133 active listings in the ZIP; 22 comparable units currently listed for rent nearby; rentals at typical pace (median 23d on market — plan ~3-4 weeks tenant-placement turnaround); 41% of comp listings sitting > 30 days — soft ceiling on asking rent; 1,861 units permitted in Allen County in 2024 (576 in 5+ unit buildings).
- This rent runs 34% of the median local income ($48k/yr) — at the standard rent-burdened threshold; future hikes will face affordability resistance.
Forward outlook
- Local home prices are declining (-3.0%/yr); year-one equity from $1k of loan paydown is wiped out by about $5k of value loss. Plan a longer hold.
- Allen County population projected at +10% by 2050 — modest demand growth; plan on rents tracking national, not racing it.
Negotiation context
- Only 13 days on market — expect competitive offers; lowballing is unlikely to land.
- 2 sale attempts with the ask held roughly flat each time — persistent listings suggest the price (not the market) is what's stuck; bring a comps-based counter.
- Current owner paid $75k; list at $170k implies a 127% gain — meaningful room to come down on a strong offer.
Risks & watch-outs
- Watch-outs: built in 1925 — expect roof / HVAC / electrical / plumbing capex.
Questions for the listing agent
- Built in 1925 — when were the roof, HVAC, electrical panel, plumbing, and water heater last replaced?
- Is there a deadline driving the sale (1031 exchange, divorce, estate, relocation)? That informs how much negotiation room exists.
- Schools are D-rated, which usually means shorter tenancies and higher turnover. Who's the typical renter profile here, and what's been the actual vacancy rate?
- The area grade is low — what's the realistic commute time and amenity access for the typical tenant pool here? Any planned neighborhood developments (good or bad) we should know about?
- What's the average days-on-market for RENTAL listings here right now (not sales)? A rising rental-DOM trend means longer vacancies and softer asking-rent achievability than the comps imply.
- What's the recent tenant-quality profile in this submarket — average credit score on applications, eviction rate, late-payment / NSF rate, and stable-employment percentage? A property-management company in the area should have these aggregated.
- How much new for-sale + rental construction is in the pipeline within 1–3 miles? Heavy new supply typically softens prices + rents 12–24 months out; constrained supply supports both.
Investment metrics
- 1% rule
- 0.80% ✗
- Cap rate
- 6.56%
- Cash-on-cash
- 0.94%
- DSCR
- 1.04
- GRM
- 10.5
CMA / ARV
- ARV (on-the-fly)
- $154,386
- Comps found
- 12
Show comp detail 12 sales within ~0.75 mi
| Address | Dist | Beds/Ba | Sqft | Sold | Price | $/sf | Match |
|---|---|---|---|---|---|---|---|
| 815 Eckart St | 0.00mi | 5/2.0 (+1) | 1,906 (0%) | 7mo | $74,900 | $39 | 85 |
| 2917 John St | 0.13mi | 4/2.0 | 1,632 (-14%) | 3mo | $55,000 | $34 | 64 |
| 2809 S Anthony Blvd | 0.68mi | 3/1.5 (-1) | 1,860 (-2%) | 2mo | $149,900 | $81 | 56 |
| 918 Hamilton Ave | 0.35mi | 4/2.0 | 1,696 (-11%) | 7mo | $115,000 | $68 | 56 |
| 909 Mckinnie Ave | 0.73mi | 4/2.0 | 1,814 (-5%) | 3mo | $135,000 | $74 | 51 |
| 2906 Smith St | 0.21mi | 3/2.5 (-1) | 1,638 (-14%) | 6mo | $234,000 | $143 | 50 |
| 2909 Bowser Ave | 0.36mi | 3/1.5 (-1) | 1,672 (-12%) | 7mo | $55,000 | $33 | 50 |
| 2335 Smith St | 0.51mi | 4/1.5 | 1,680 (-12%) | 7mo | $160,700 | $96 | 48 |
| 204 E Suttenfield St | 0.63mi | 3/1.5 (-1) | 2,138 (+12%) | 3mo | $184,900 | $86 | 41 |
| 2910 S Harrison St | 0.69mi | 3/1.5 (-1) | 1,696 (-11%) | 4mo | $172,500 | $102 | 40 |
| 2316 Warsaw St | 0.55mi | 3/1.5 (-1) | 1,632 (-14%) | 8mo | $42,000 | $26 | 37 |
| 2504 Lillie St | 0.68mi | 3/2.5 (-1) | 1,638 (-14%) | 1mo | $235,000 | $143 | 33 |
Match score weights: distance 35% · size 25% · config 20% · recency 20%. Top-matched comps best support the ARV.
Projected returns pro-forma
-3.0% appreciation · 4.93% rent growth · sell at horizon
- IRR
- -12.9%
- Equity multiple
- 0.53×
- Total profit
- $-22,531
- Equity at exit
- $25,333
- IRR
- -1.5%
- Equity multiple
- 0.89×
- Total profit
- $-5,374
- Equity at exit
- $14,690
Cash invested: $47,572 (down + closing). Projections, not guarantees.
Landlord ↔ Tenant lean methodology
- Overall (STATE)
- 90 Strongly Landlord-Friendly
- State Indiana
- 90 Strongly Landlord-Friendly · R+11
- County
- — inherits STATE
- City
- — inherits STATE
ZIP-level market 46806
- Home prices YoY
- -33.6%
- Rents YoY
- 4.9%
- Active inventory
- 133
- Price-to-rent
- 10.5×
Monthly cashflow live
- Estimated rent
- $1,355 high interval (Pro) →
- Mortgage (P&I)
- −$891
- Tax from tax record
- −$71 /mo · $851/yr
- Insurance
- −$71
- HOA
- −$0
- Vacancy / Maint / Mgmt
- −$284
- Net cashflow
- $37
Break-even live
Sensitivity live
| Price | -10% $134 | -5% $86 | +0% $37 | +5% $-11 | +10% $-59 |
|---|---|---|---|---|---|
| Rent | -10% $-70 | -5% $-16 | +0% $37 | +5% $91 | +10% $144 |
| Rate | -1.0pp $123 | -0.5pp $81 | base $37 | +0.5pp $-7 | +1.0pp $-51 |
UW: 25.0% down · 7.5% · 30yr · 1.5% tax · 5.0% vac · 8.0% maint · 8.0% mgmt
Financing live
Cash to close
- Down payment
- $42,475
- Closing costs
- $5,097
- Reserves months
- —
- Total cash needed
- —
Loan-product check · same deal, 3 products live
Conventional
25% down · 7.5% · 30yr
- Down + closing
- —
- Monthly P&I
- —
- Monthly cashflow
- —
- DSCR
- —
- Eligible?
- —
Personal DTI + credit; lowest rate.
DSCR
20% down · 8.5% · 30yr
- Down + closing
- —
- Monthly P&I
- —
- Monthly cashflow
- —
- DSCR
- —
- Eligible?
- —
No personal income docs; deal must DSCR.
Hard money
10% down · 12.0% · 12mo
- Down + closing
- —
- Monthly P&I
- —
- Monthly cashflow
- —
- DSCR
- —
- Eligible?
- —
Short-term bridge; refi at stabilization.
Rent comps 22 comps
| Address | Beds | Baths | Sqft | Rent | $/sqft | DOM | Units | Dist |
|---|---|---|---|---|---|---|---|---|
| 1024 Colerick St Fort Wayne, IN | 4.0 | 1.0 | 1388 | $1,065 | $0.77 | 23d | 1 | 0.15mi |
| 451 E Pontiac St Fort Wayne, IN | 3.0 | 1.0 | 1308 | $1,050 | $0.80 | 45d | 1 | 0.38mi |
| 2627 Holton Ave Fort Wayne, IN | 3.0 | 2.0 | 1936 | $1,500 | $0.77 | 15d | 1 | 0.49mi |
| 2530 Lafayette St Fort Wayne, IN | 4.0 | 1.0 | 1816 | $1,500 | $0.83 | 45d | 1 | 0.50mi |
| 116 E Pontiac St Fort Wayne, IN | 3.0 | 1.5 | 1400 | $1,175 | $0.84 | 23d | 1 | 0.63mi |
| 420 E Dewald St Fort Wayne, IN | 3.0 | 1.5 | 1472 | $1,300 | $0.88 | 45d | 1 | 0.66mi |
| 3221 S Harrison St Fort Wayne, IN | 5.0 | 2.0 | 2062 | $1,650 | $0.80 | 23d | 1 | 0.67mi |
| 3221 Webster St Fort Wayne, IN | 5.0 | 2.0 | 1885 | $1,575 | $0.84 | 15d | 1 | 0.73mi |
| 3510 S Harrison St Fort Wayne, IN | 3.0 | 1.0 | 1248 | $975 | $0.78 | 15d | 1 | 0.74mi |
| 2616 S Harrison St Fort Wayne, IN | 4.0 | 2.0 | 1908 | $1,500 | $0.79 | 45d | 1 | 0.74mi |
| 3008 Webster St Fort Wayne, IN | 3.0 | 1.0 | 1344 | $1,449 | $1.08 | 23d | 1 | 0.75mi |
| 4133 Lafayette St Fort Wayne, IN | 4.0 | 2.0 | 1640 | $1,400 | $0.85 | 23d | 1 | 0.75mi |
| 2118 Webster St Fort Wayne, IN | 4.0 | 1.0 | 2200 | $1,175 | $0.53 | 45d | 1 | 0.98mi |
| 2720 Queen St Fort Wayne, IN | 3.0 | 2.0 | 1316 | $1,395 | $1.06 | 15d | 1 | 1.03mi |
| 2903 Queen St Fort Wayne, IN | 3.0 | 2.0 | 1460 | $1,200 | $0.82 | 45d | 1 | 1.05mi |
| 724 Kinnaird Ave Fort Wayne, IN | 3.0 | 1.5 | 1880 | $1,450 | $0.77 | 45d | 1 | 1.16mi |
| 2431 Fox Ave Fort Wayne, IN | 3.0 | 1.5 | 1522 | $1,550 | $1.02 | 15d | 1 | 1.24mi |
| 1131 E Lewis St Fort Wayne, IN | 4.0 | 2.0 | 1476 | $1,950 | $1.32 | 15d | 1 | 1.28mi |
| 4201 S Wayne Ave Fort Wayne, IN | 3.0 | 1.5 | 1252 | $1,400 | $1.12 | 23d | 1 | 1.31mi |
| 1501 E Lewis St Fort Wayne, IN | 4.0 | 1.0 | 2000 | $1,450 | $0.72 | 45d | 1 | 1.34mi |
| 1132 S Hanna St Unit 1 Fort Wayne, IN | 4.0 | 1.5 | 1656 | $1,600 | $0.97 | 45d | 1 | 1.36mi |
| 2806 New Haven Ave Fort Wayne, IN | 3.0 | 1.0 | 1410 | $1,125 | $0.80 | 23d | 1 | 1.48mi |
Listing history 9 events
-
2026-06-22days on market $169,900 Active 13 DOM
-
2026-06-18days on market $169,900 Active 10 DOM
-
2026-06-17days on market $169,900 Active 9 DOM
-
2026-06-16days on market $169,900 Active 8 DOM
-
2026-06-15days on market $169,900 Active 7 DOM
-
2026-06-14days on market $169,900 Active 5 DOM
-
2026-06-10days on market $169,900 Active 2 DOM
-
2026-06-09remarks 345-char remark
-
2026-06-09$169,900 Active 1 DOM
ⓘ Source: listings_history table (triggers on properties + properties_extension) + one-shot
backfill from property_details.listing_events for pre-trigger history.
Tax reassessment forecast IN · Partial reset (capped growth)
- Current annual tax
- $851 · $71/mo
- Projected year-2 tax
- $1,148 · $96/mo
- Expected delta
- +$297/yr (+$25/mo · 34.9%)
ⓘ Screening estimate from a state-policy table — verify with the county assessor before closing.
Climate risk First Street
- Flood 1/10 Low FEMA zone X (unshaded) · 0% chance over 30 yrs
- Wildfire 1/10 Low
- Heat 3/10 Moderate 7 d/yr ≥100°F today · 17 d/yr by 30 yrs out
- Wind 2/10 Low
- Air quality 3/10 Moderate 2 unhealthy d/yr today · 3 by 30 yrs out
Nearby sold comps map
Loading sold comps map…
Walkable amenities ~0.75 mi
Loading nearby amenities…
Taxation est. · year 1
- Rental income
- $16,255
- − Mortgage interest
- −$9,517
- − Property taxes
- −$851
- − Insurance
- −$850
- − Repairs & maintenance
- −$1,300
- − Management
- −$1,300
- − Depreciation
- −$4,943
- Taxable loss
- −$2,506
- Est. tax savings @ 24.0%
- +$601
- After-tax cash flow
- $1,051/yr
For passive investors: Depreciation is non-cash, so a rental often shows a tax loss while cash-flowing — sheltering income. Rental losses are passive: they offset passive income freely, and up to $25,000/yr can offset ordinary (W-2) income if you actively participate and your MAGI is under $100k (phasing out to $0 by $150k); unused losses carry forward. On sale, claimed depreciation is recaptured at up to 25%, and gains may owe capital-gains tax (a 1031 exchange can defer both). Figures are a year-1 estimate at your 24.0% rate — not tax advice; consult a CPA.
Schools (NCES district)
- District
- Fort Wayne Community Schools
- NCES district ID
- 1803630
- Math proficiency
- 22% ▼ -11.00%
- Reading proficiency
- 29% ▼ -7.00%
- Median HH income
- $41,951
- Composite
- 21.68/100
- National rank
- #8275
- State rank
- #263 of 301 in IN
Livability — Fort Wayne
- Score
- 84/100
- State rank
- #6
- US rank
- #676
Category grades
Schools grade is shown separately in the Schools card above.
Census & demographics
- Census place
- Fort Wayne, IN
- County
- Allen County · 326,813 people
- City population
- 326,813
- Metro
- Fort Wayne, IN
- Population (ZIP)
- 26,425
- Household income
- $47,895
- Rent vs Own
- Severe rent burden
- 1184.0
Population outlook (Allen County) Hauer SSP2
- Today (2025)
- 394,020 people
- By 2030
- 405,128 · +2.8%
- By 2040
- 423,476 · +7.5%
- By 2050
- 435,137 · +10.4%
- By 2075
- 450,293 · +14.3%
- By 2100
- 424,101 · +7.6%
Race, ethnicity, and origin ACS 2023
- Neighborhood character
- Highly diverse neighborhood (Simpson 0.74)
- Race & ethnicity
- Black 37% Hispanic / Latino 26% White 21% Asian 12% Two or more races 11% Native American 2%
- Hispanic origin (detail)
- Mexican 18% Puerto Rican 1%
- Common ancestry
- Italian 1% Romanian 1% Lithuanian 1%
- Foreign-born
- 19% · Canada, Philippines, South Korea
- Languages at home
- 71% English-only · Spanish 19% Other Asian/Pacific 9%
Political lean MEDSL · Allen
- 2024 margin
- R (+12.5) · D 42.9% · R 55.4% · Other 1.7%
- 2008→2024 swing
- -8.1pp toward R · 2008: -4.3pp · 2024: -12.5pp
- All cycles
- 2024: R+12.5 2020: R+11.2 2016: R+19.6 2012: R+16.8 2008: R+4.3
Not yet ingested
- Civics
- —
Market trends
- HPI YoY
- ▼ -148.00%
- Current HPI
- 291.8198
- Rent YoY
- ▲ 4.93%
- Metro
- Fort Wayne, IN
- State GDP YoY
- ▲ 2.90%
- F500 in state
- 18
Industry mix (Fortune 500 HQ in IN)
| Industry | F500 HQs | Revenue |
|---|---|---|
| Industrial Machinery | 2 | $37B |
|
||
| Healthcare | 1 | $177B |
|
||
| Pharmaceuticals | 1 | $45B |
|
||
| Metals / Steel | 1 | $18B |
|
||
| Agriculture | 1 | $17B |
|
||
| Packaging | 1 | $12B |
|
||
Price history
+126.8% since first listed4 events — show timeline
- 2026-06-05 Listed $169,900 IRMLS
- 2025-11-20 Sold (MLS) $74,900 IRMLS
- 2025-11-01 Pending — IRMLS
- 2025-10-24 Listed $74,900 IRMLS
Property tax history
+21.4%/yrLatest (2024): $851 · +27.1% YoY. Source: county tax records.
Cash-flow waterfall
monthlySold comps — $/sqft
last 12 mo · ≤1 miLoading sold comps…