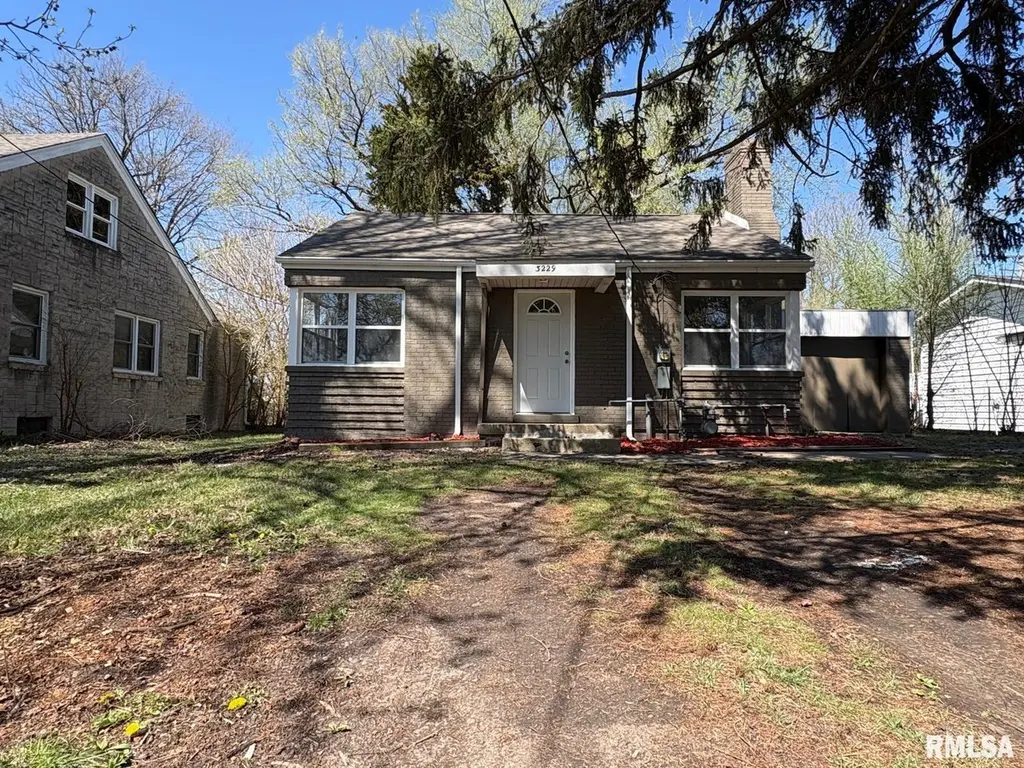
3229 E Enos Ave · Springfield, IL
Flood risk 1/10 · Minimal
- FEMA flood zone
- X (unshaded)
- Chance of flooding over 30 yrs
- 0.0%
- Est. flood insurance / yr
- $473 – $860
Fire risk 1/10 · Minimal
- Est. fire insurance / yr
- $804 – $1,492
Heat risk 4/10 · Minor
- Hot days now (above 105°F)
- 7 days/yr
- Hot days in 30 yrs
- 20 days/yr
Wind risk 2/10 · Minimal
- Chance of severe wind over 30 yrs
- 2.0%
Air-quality risk 2/10 · Minimal
- Unhealthy air days now
- 1 days/yr
- Unhealthy air days in 30 yrs
- 1 days/yr
Risk factors via First Street. Map © Google.
Why this score? — see what drove the C+ grade
The composite is a weighted blend of 9 inputs, each scored 0–100. Each bar is that input's sub-score; the figure is the points it added to the 100-point composite (weight × sub-score).
- Cash flow +28.7/30.0
- DSCR +10.0/10.0
- 1% rule +7.5/10.0
- ARV discount +6.0/15.0
- Livability +4.0/5.0
- Rent growth +3.7/5.0
- Condition / age +2.5/5.0
- Schools +1.7/10.0
- Appreciation +0.0/10.0
$99,900
🖨 Deal sheet (PDF) 📄 Offer letter ✓ Due diligence
Listing remarks MLS
Beautifully updated ranch-style home featuring 3 bedrooms and 1 full bathroom. This move-in-ready property offers a fresh, modern feel with new exterior paint and new windows for excellent curb appeal. Step inside to enjoy fresh interior paint, luxury vinyl plank flooring, and an updated kitchen complete with refreshed cabinets, new countertops, ceramic tile flooring, backsplash, and stainless steel appliances. The home is filled with natural light, highlighted by double windows in the living room and two bedrooms, along with well-positioned windows in the third bedroom. Major updates include new HVAC ductwork, with a new AC unit and coil to be installed prior to closing. The bathroom has been tastefully updated with new ceramic tile flooring and a tiled shower surround. Additional improvements include new water lines and an upgraded electrical panel. Enjoy the warmth and character of two fireplaces, along with two new exterior doors. A great opportunity for a turnkey home combining modern updates with classic charm.
Key facts
- New exterior paint
- Updated kitchen
- New windows
Tags
Neighborhood map
What this means for you Summary
Snapshot
- This is a 3-bed/1.0-bath single-family listed at $100k.
Deal economics
- At list price, monthly cash flow is $331 ($4k/yr) — positive.
- The deal already cash-flows at list — no discount required.
- Meets the 1% rule at list price ($1k rent vs $100k).
- Recommended offer: $94k (6.0% below list) — sets the bar for market timing.
- Cap rate 10.3% vs local median 4.9% in Springfield — top-decile yield for the area; either an underpriced asset or a hidden risk that comps aren't pricing in. Stress-test before assuming the spread holds.
Location & tenants
- Location reads 79/100 on livability (#122 in IL, #2,138 nationally) — a middle-class / working-renter tenant base. Strengths: amenities A+, commute A+, cost of living A+; Watch: crime F.
- Springfield SD 186 (urban): math 17% / reading 22% proficiency, ranked #438 of 620 in IL (top 71%) — low school quality limits family demand, transient renter base, plan for 1-2y turnover; 64% free/reduced lunch — lower-income household profile, screen leases tightly.
- Zoned schools: Feitshans Elem Sch (math 2% / reading 2%, grade F, #1,927 of 2,056 statewide, top 100%, 296 students, 0% FRL); Jefferson Middle School (math 3% / reading 8%, grade F, #635 of 665 statewide, top 95%, 539 students, 0% FRL); Lanphier High School (math 10% / reading 16%, grade F, #501 of 693 statewide, top 73%, 1,058 students, 0% FRL) — zoned schools average 0% FRL vs 64% district-wide (64 pts lower); this property's tenant base skews higher-income than the district average.
- Zoned-school proficiency averages 7% at this address vs 20% district-wide (-12 pts) — the specific schools serving this property underperform the Springfield SD 186 average; the district grade overstates school quality for this exact location.
- Market conditions: Rents rising fast (+5.0%/yr); 137 active listings in the ZIP; 8 comparable units currently listed for rent nearby; rentals lingering (median 46d on market — plan ~5-8 weeks vacancy on turnover, expect pricing pressure); 50% of comp listings sitting > 30 days — soft ceiling on asking rent; 225 units permitted in Sangamon County in 2024 (48 in 5+ unit buildings).
Forward outlook
- Local home prices are declining (-3.0%/yr); year-one equity from $691 of loan paydown is wiped out by about $3k of value loss. Plan a longer hold.
- Sangamon County population projected to shrink 9% by 2050 — rents likely to lag national; underwrite the cash flow, not the appreciation.
- At projected returns (-3.0% appreciation + 5.0% rent growth), your $28k cash investment doubles in ~8 years — after that, you're playing with house money.
Negotiation context
- It's been on market 73 days — a 6% lower offer ($94k) is reasonable based on typical stale-listing flexibility.
- Current owner paid $50k; list at $100k implies a 100% gain — meaningful room to come down on a strong offer.
Questions for the listing agent
- It's been on market 73 days. Have you received any prior offers? Is the seller open to a 6% concession, seller financing, or rate buy-down credit?
- Why hasn't it sold? Are there any deal-killer items the seller is aware of (foundation, flood, title, zoning, code violations)?
- Is there a deadline driving the sale (1031 exchange, divorce, estate, relocation)? That informs how much negotiation room exists.
- Schools are D-rated, which usually means shorter tenancies and higher turnover. Who's the typical renter profile here, and what's been the actual vacancy rate?
- Crime grade is F in this area — have there been break-ins, vandalism, or insurance claims at this property in the last 3 years? What carrier currently insures it and at what premium?
- What's the average days-on-market for RENTAL listings here right now (not sales)? A rising rental-DOM trend means longer vacancies and softer asking-rent achievability than the comps imply.
- What's the recent tenant-quality profile in this submarket — average credit score on applications, eviction rate, late-payment / NSF rate, and stable-employment percentage? A property-management company in the area should have these aggregated.
- How much new for-sale + rental construction is in the pipeline within 1–3 miles? Heavy new supply typically softens prices + rents 12–24 months out; constrained supply supports both.
Investment metrics
- 1% rule
- 1.25% ✓
- Cap rate
- 10.27%
- Cash-on-cash
- 14.21%
- DSCR
- 1.63
- GRM
- 6.6
CMA / ARV
- ARV (median comp)
- $96,657
- List price
- $99,900
- Delta
- 3.36%
- Verdict
- FAIR
- Comps
- 20 within 1.0 mi
Show comp detail 12 sales within ~0.75 mi
| Address | Dist | Beds/Ba | Sqft | Sold | Price | $/sf | Match |
|---|---|---|---|---|---|---|---|
| 3208 E Elm St | 0.22mi | 3/1.0 | 1,037 (+1%) | 10mo | $33,000 | $32 | 79 |
| 29 Melody Ln | 0.18mi | 3/1.0 | 900 (-12%) | 2mo | $115,000 | $128 | 70 |
| 8 Melody Ln | 0.23mi | 2/2.0 (-1) | 1,061 (+4%) | 11mo | $121,000 | $114 | 65 |
| 2912 E Enos Ave | 0.40mi | 2/1.0 (-1) | 998 (-2%) | 9mo | $94,500 | $95 | 65 |
| 417 N Stephens Ave | 0.52mi | 3/1.0 | 1,054 (+3%) | 11mo | $65,000 | $62 | 62 |
| 3033 Louise Ln | 0.50mi | 3/1.0 | 982 (-4%) | 14mo | $70,000 | $71 | 58 |
| 428 N Stephens Ave | 0.49mi | 3/1.0 | 1,102 (+8%) | 15mo | $129,900 | $118 | 52 |
| 404 N Daniel Ave | 0.44mi | 2/1.0 (-1) | 913 (-11%) | 6mo | $10,000 | $11 | 51 |
| 872 N Wesley St | 0.57mi | 3/1.0 | 1,148 (+12%) | 7mo | $65,000 | $57 | 47 |
| 1037 N Wesley St | 0.67mi | 3/1.0 | 1,161 (+14%) | 2mo | $45,000 | $39 | 45 |
| 1025 N Daniel St | 0.56mi | 2/1.0 (-1) | 950 (-7%) | 16mo | $20,000 | $21 | 44 |
| 143 S Wesley St | 0.75mi | 2/1.0 (-1) | 895 (-12%) | 7mo | $30,000 | $34 | 34 |
Match score weights: distance 35% · size 25% · config 20% · recency 20%. Top-matched comps best support the ARV.
Projected returns pro-forma
-3.0% appreciation · 4.95% rent growth · sell at horizon
- IRR
- 6.7%
- Equity multiple
- 1.26×
- Total profit
- $7,412
- Equity at exit
- $14,895
- IRR
- 17.6%
- Equity multiple
- 2.58×
- Total profit
- $44,313
- Equity at exit
- $8,638
Cash invested: $27,972 (down + closing). Projections, not guarantees.
Landlord ↔ Tenant lean methodology
- Overall (STATE)
- 43 Moderately Tenant-Leaning
- State Illinois
- 43 Moderately Tenant-Leaning · D+7
- County
- — inherits STATE
- City
- — inherits STATE
ZIP-level market 62702
- Home prices YoY
- -34.9%
- Rents YoY
- 5.0%
- Active inventory
- 137
- Price-to-rent
- 6.6×
Monthly cashflow live
- Estimated rent
- $1,252 high interval (Pro) →
- Mortgage (P&I)
- −$524
- Tax from tax record
- −$93 /mo · $1,113/yr
- Insurance
- −$42
- HOA
- −$0
- Vacancy / Maint / Mgmt
- −$263
- Net cashflow
- $331
Break-even live
Sensitivity live
| Price | -10% $388 | -5% $360 | +0% $331 | +5% $303 | +10% $275 |
|---|---|---|---|---|---|
| Rent | -10% $232 | -5% $282 | +0% $331 | +5% $381 | +10% $430 |
| Rate | -1.0pp $382 | -0.5pp $357 | base $331 | +0.5pp $305 | +1.0pp $279 |
UW: 25.0% down · 7.5% · 30yr · 1.5% tax · 5.0% vac · 8.0% maint · 8.0% mgmt
Financing live
Cash to close
- Down payment
- $24,975
- Closing costs
- $2,997
- Reserves months
- —
- Total cash needed
- —
Loan-product check · same deal, 3 products live
Conventional
25% down · 7.5% · 30yr
- Down + closing
- —
- Monthly P&I
- —
- Monthly cashflow
- —
- DSCR
- —
- Eligible?
- —
Personal DTI + credit; lowest rate.
DSCR
20% down · 8.5% · 30yr
- Down + closing
- —
- Monthly P&I
- —
- Monthly cashflow
- —
- DSCR
- —
- Eligible?
- —
No personal income docs; deal must DSCR.
Hard money
10% down · 12.0% · 12mo
- Down + closing
- —
- Monthly P&I
- —
- Monthly cashflow
- —
- DSCR
- —
- Eligible?
- —
Short-term bridge; refi at stabilization.
Rent comps 8 comps
| Address | Beds | Baths | Sqft | Rent | $/sqft | DOM | Units | Dist |
|---|---|---|---|---|---|---|---|---|
| 3064 Louise Ln Springfield, IL | 3.0 | 1.0 | 1100 | $1,350 | $1.23 | 22d | 1 | 0.41mi |
| 302 Forrest Ave Springfield, IL | 3.0 | 2.0 | 924 | $1,069 | $1.16 | 22d | 1 | 0.69mi |
| 3617 N Grand Ave E Springfield, IL | 3.0 | 2.0 | 1056 | $1,179 | $1.12 | 22d | 1 | 0.94mi |
| 507 S Wesley St Springfield, IL | 2.0 | 1.0 | 800 | $975 | $1.22 | 45d | 1 | 0.95mi |
| 2213 E Adams St Springfield, IL | 3.0 | 1.0 | 1200 | $1,100 | $0.92 | 45d | 1 | 1.03mi |
| 2281 E Keys Ave Springfield, IL | 2.0 | 1.0 | 800 | $1,200 | $1.50 | 45d | 1 | 1.09mi |
| 3319 Ridgewood Ave Springfield, IL | 3.0 | 2.0 | 1248 | $1,094 | $0.88 | 45d | 1 | 1.21mi |
| 920 N 19th St Springfield, IL | 3.0 | 1.0 | 1000 | $1,100 | $1.10 | 22d | 1 | 1.34mi |
Listing history 23 events
-
2026-06-22days on market $99,900 Active 73 DOM
-
2026-06-19days on market $99,900 Active 71 DOM
-
2026-06-18price $99,900 Active 70 DOM
-
2026-06-18days on market $104,900 Active 70 DOM
-
2026-06-17days on market $104,900 Active 69 DOM
-
2026-06-16days on market $104,900 Active 68 DOM
-
2026-06-15days on market $104,900 Active 67 DOM
-
2026-06-14days on market $104,900 Active 65 DOM
-
2026-06-13days on market $104,900 Active 64 DOM
-
2026-06-10days on market $104,900 Active 62 DOM
-
2026-06-09days on market $104,900 Active 61 DOM
-
2026-06-08days on market $104,900 Active 60 DOM
-
2026-06-07days on market $104,900 Active 59 DOM
-
2026-06-05days on market $104,900 Active 56 DOM
-
2026-06-03days on market $104,900 Active 55 DOM
-
2026-06-03price $104,900 Active 54 DOM
-
2026-06-02days on market $107,000 Active 54 DOM
-
2026-06-01days on market $107,000 Active 53 DOM
-
2026-05-31days on market $107,000 Active 52 DOM
-
2026-05-30days on market $107,000 Active 51 DOM
-
2026-05-14price $107,000 1036-char remark
Show marketing remark (1036 chars)
Beautifully updated ranch-style home featuring 3 bedrooms and 1 full bathroom. This move-in-ready property offers a fresh, modern feel with new exterior paint and new windows for excellent curb appeal. Step inside to enjoy fresh interior paint, luxury vinyl plank flooring, and an updated kitchen complete with refreshed cabinets, new countertops, ceramic tile flooring, backsplash, and stainless steel appliances. The home is filled with natural light, highlighted by double windows in the living room and two bedrooms, along with well-positioned windows in the third bedroom. Major updates include new HVAC ductwork, with a new AC unit and coil to be installed prior to closing. The bathroom has been tastefully updated with new ceramic tile flooring and a tiled shower surround. Additional improvements include new water lines and an upgraded electrical panel. Enjoy the warmth and character of two fireplaces, along with two new exterior doors. A great opportunity for a turnkey home combining modern updates with classic charm.
-
2026-04-08$109,900 Active 1036-char remark
Show marketing remark (1036 chars)
Beautifully updated ranch-style home featuring 3 bedrooms and 1 full bathroom. This move-in-ready property offers a fresh, modern feel with new exterior paint and new windows for excellent curb appeal. Step inside to enjoy fresh interior paint, luxury vinyl plank flooring, and an updated kitchen complete with refreshed cabinets, new countertops, ceramic tile flooring, backsplash, and stainless steel appliances. The home is filled with natural light, highlighted by double windows in the living room and two bedrooms, along with well-positioned windows in the third bedroom. Major updates include new HVAC ductwork, with a new AC unit and coil to be installed prior to closing. The bathroom has been tastefully updated with new ceramic tile flooring and a tiled shower surround. Additional improvements include new water lines and an upgraded electrical panel. Enjoy the warmth and character of two fireplaces, along with two new exterior doors. A great opportunity for a turnkey home combining modern updates with classic charm.
-
2014-06-03soldstatus $50,000
ⓘ Source: listings_history table (triggers on properties + properties_extension) + one-shot
backfill from property_details.listing_events for pre-trigger history.
Tax reassessment forecast IL · Partial reset (capped growth)
- Current annual tax
- $1,113 · $93/mo
- Projected year-2 tax
- $1,690 · $141/mo
- Expected delta
- +$578/yr (+$48/mo · 51.9%)
ⓘ Screening estimate from a state-policy table — verify with the county assessor before closing.
Climate risk First Street
- Flood 1/10 Low FEMA zone X (unshaded) · 0% chance over 30 yrs
- Wildfire 1/10 Low
- Heat 4/10 Moderate 7 d/yr ≥105°F today · 20 d/yr by 30 yrs out
- Wind 2/10 Low 2% chance of damaging wind over 30 yrs
- Air quality 2/10 Low 1 unhealthy d/yr today · 1 by 30 yrs out
Nearby sold comps map
Loading sold comps map…
Walkable amenities ~0.75 mi
Loading nearby amenities…
Taxation est. · year 1
- Rental income
- $15,030
- − Mortgage interest
- −$5,596
- − Property taxes
- −$1,113
- − Insurance
- −$500
- − Repairs & maintenance
- −$1,202
- − Management
- −$1,202
- − Depreciation
- −$2,906
- Taxable income
- $2,511
- Est. tax owed @ 24.0%
- −$603
- After-tax cash flow
- $3,372/yr
For passive investors: Depreciation is non-cash, so a rental often shows a tax loss while cash-flowing — sheltering income. Rental losses are passive: they offset passive income freely, and up to $25,000/yr can offset ordinary (W-2) income if you actively participate and your MAGI is under $100k (phasing out to $0 by $150k); unused losses carry forward. On sale, claimed depreciation is recaptured at up to 25%, and gains may owe capital-gains tax (a 1031 exchange can defer both). Figures are a year-1 estimate at your 24.0% rate — not tax advice; consult a CPA.
Schools (NCES district)
- District
- Springfield SD 186
- NCES district ID
- 1737080
- Math proficiency
- 17% ▼ -7.00%
- Reading proficiency
- 22% ▼ -5.00%
- Median HH income
- $43,744
- Composite
- 16.89/100
- National rank
- #9142
- State rank
- #438 of 620 in IL
Livability — Springfield
- Score
- 79/100
- State rank
- #122
- US rank
- #2138
Category grades
Schools grade is shown separately in the Schools card above.
Census & demographics
- County
- Sangamon County · 115,414 people
- City population
- 59,955
- Metro
- Springfield, IL
- Population (ZIP)
- 31,033
- Household income
- $51,136
- Rent vs Own
- Severe rent burden
- 1230.0
Population outlook (Sangamon County) Hauer SSP2
- Today (2025)
- 198,317 people
- By 2030
- 196,127 · -1.1%
- By 2040
- 188,664 · -4.9%
- By 2050
- 179,624 · -9.4%
- By 2075
- 155,027 · -21.8%
- By 2100
- 122,588 · -38.2%
Race, ethnicity, and origin ACS 2023
- Neighborhood character
- Predominantly White (72%)
- Race & ethnicity
- White 72% Black 17% Two or more races 8% Hispanic / Latino 3%
- Common ancestry
- Romanian 2% Slovak 2% Serbian 1%
- Foreign-born
- 2% · Canada
- Languages at home
- 96% English-only · Spanish 1% French/Haitian/Cajun 1% Other Indo-European 1%
Political lean MEDSL · Sangamon
- 2024 margin
- Toss-up / Even · D 46.6% · R 51.6% · Other 1.8%
- 2008→2024 swing
- -9.3pp toward R · 2008: 4.4pp · 2024: -5.0pp
- All cycles
- 2024: R+5.0 2020: R+4.4 2016: R+9.4 2012: R+8.7 2008: D+4.4
Not yet ingested
- Civics
- —
Market trends
- HPI YoY
- ▼ -79.98%
- Current HPI
- 149.1926
- Rent YoY
- ▲ 4.95%
- Metro
- Springfield, IL
- State GDP YoY
- ▲ 1.59%
- F500 in state
- 60
Industry mix (Fortune 500 HQ in IL)
| Industry | F500 HQs | Revenue |
|---|---|---|
| Insurance | 4 | $201B |
|
||
| Consumer Goods | 4 | $87B |
|
||
| Industrial Machinery | 3 | $64B |
|
||
| Healthcare | 2 | $55B |
|
||
| Retail / Pharmacy | 1 | $148B |
|
||
| Agriculture / Food | 1 | $86B |
|
||
Price history
+114.0% since first listed3 events — show timeline
- 2026-05-14 Price Changed $107,000 RMLSA as Distributed by MLS Grid
- 2026-04-08 Listed $109,900 RMLSA as Distributed by MLS Grid
- 2014-06-03 Sold (Public Records) $50,000 Public Records
Property tax history
-0.9%/yrLatest (2024): $1,113 · +9.2% YoY. Source: county tax records.
Cash-flow waterfall
monthlySold comps — $/sqft
last 12 mo · ≤1 miLoading sold comps…