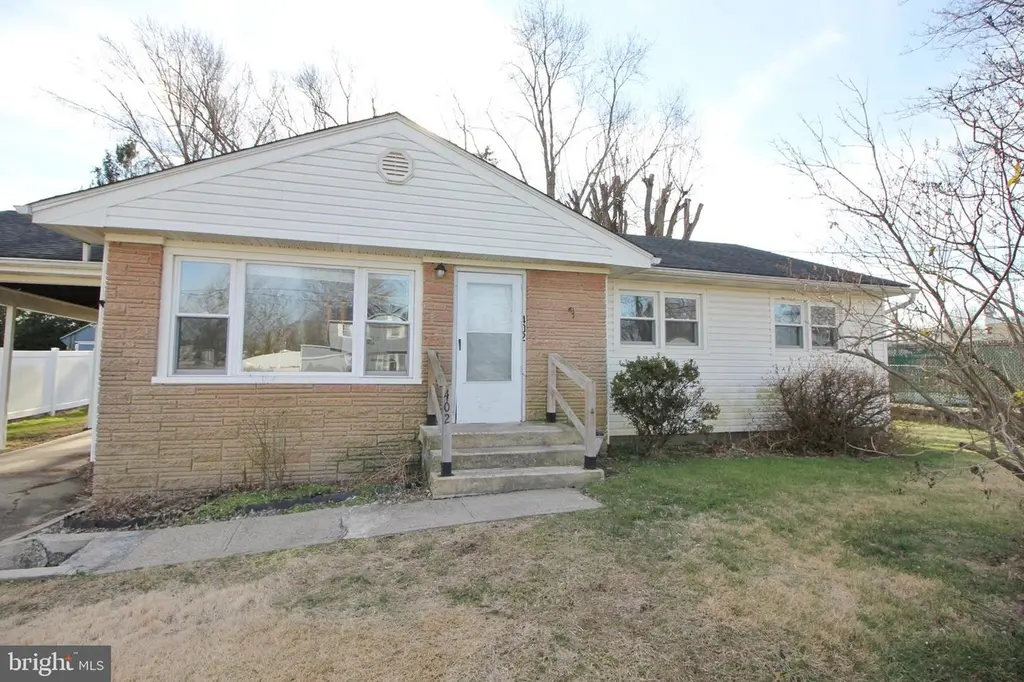
402 Pennington Dr #200 · Westampton, NJ
Flood risk 1/10 · Minimal
- FEMA flood zone
- X (unshaded)
- Chance of flooding over 30 yrs
- 0.0%
- Est. flood insurance / yr
- $507 – $1,088
Fire risk 1/10 · Minimal
- Est. fire insurance / yr
- $526 – $976
Heat risk 6/10 · Moderate
- Hot days now (above 104°F)
- 7 days/yr
- Hot days in 30 yrs
- 15 days/yr
Wind risk 6/10 · Moderate
- Chance of severe wind over 30 yrs
- 54.0%
Air-quality risk 4/10 · Minor
- Unhealthy air days now
- 5 days/yr
- Unhealthy air days in 30 yrs
- 7 days/yr
Risk factors via First Street. Map © Google.
Why this score? — see what drove the D grade
The composite is a weighted blend of 9 inputs, each scored 0–100. Each bar is that input's sub-score; the figure is the points it added to the 100-point composite (weight × sub-score).
- Cash flow +13.9/30.0
- ARV discount +11.7/15.0
- DSCR +4.2/10.0
- 1% rule +3.9/10.0
- Schools +3.1/10.0
- Rent growth +2.9/5.0
- Livability +2.5/5.0
- Condition / age +2.2/5.0
- Appreciation +0.0/10.0
$411,000
🖨 Deal sheet 📄 Offer letter ✓ Due diligence
Listing remarks MLS
Opportunity knocks! This ranch-style home offers potential for buyers ready to add their personal touch. Featuring 3 bedrooms and 1.5 baths, the property sits on a generously sized lot with plenty of room to grow. Inside, you’ll find a spacious living and dining room combination. The kitchen has been previously updated with classic white Shaker-style cabinetry and includes gas cooking. The primary bedroom features a convenient ensuite half bath, while two additional bedrooms share a full bath with a tub/shower combination. The unfinished basement provides excellent potential for future expansion, a workshop, or abundant storage space. Step outside to a large backyard with an open patio—ideal for relaxing, gardening, or hosting gatherings. Bring your vision and creativity to transform this promising property into your dream home or a rewarding investment opportunity!
Key facts
- Updated kitchen
- Spacious living room
- 0.23 acre lot
Tags
Property features AI
Finance
- Financial info: Fee simple ownership; Property condition listed as very good; Lease not considered
Exterior
- Parking: Attached carport (1 space); total garage/parking spaces: 1
- Utilities: Public water; Public sewer; Natural gas available
- Home design: Detached single-family home; Main entrance faces northeast; Effective year of major renovation: 2026
- Construction: Frame construction with vinyl siding and brick veneer; Block foundation; Structure not winterized
- Exterior features: Patio(s); Not in a federal flood zone; Lot dimensions approximately 75 x 134
Interior
- Kitchen: Built-in microwave; Gas oven/range; Refrigerator; Dishwasher
- Bedrooms: Three bedrooms on the main level
- Flooring: Luxury vinyl plank; Ceramic tile; Carpet
- Bathrooms: One full bathroom and two half bathrooms (main level: one full, one half; lower level: one half)
- Heating & cooling: Central heating (natural gas); Central air conditioning; 100 amp electric service; Natural gas hot water
- Interior features: Traditional floor plan with combined dining and living area; Eat-in kitchen; Tub/shower; Ceiling fans; Fully finished basement; Estimated living area
- Laundry & utility: Laundry in the basement; Utility room
Neighborhood map
What this means for you Summary
Snapshot
- This is a 3-bed/2.0-bath single-family listed at $411k. Condition is rated fair.
Deal economics
- At list price, monthly cash flow is $42 ($510/yr) — positive.
- The deal already cash-flows at list — no discount required.
- To meet the 1% rule (rent ≥ 1% of price), the offer needs to be $365k (11.2% below list).
- Recommended offer: $365k (11.2% below list) — sets the bar for 1% rule.
Location & tenants
- Location reads: area grade D — affects rentability + tenant quality, not the cash-flow math above.
- Westampton Township Public School District (suburban): math 17% / reading 44% proficiency, ranked #288 of 472 in NJ (top 61%) — families likely to look elsewhere, expect single-tenant / working-renter base with shorter leases; only 15% free/reduced lunch — higher-income household profile.
- Market conditions: Rents rising (+1.4%/yr); 134 active listings in the ZIP; 10 comparable units currently listed for rent nearby; rentals leasing fast (median 2d on market — plan ~1-2 weeks tenant-placement turnaround); solid renter incomes; 2,161 units permitted in Burlington County in 2024 (988 in 5+ unit buildings).
- This rent runs 40% of the median local income ($109k/yr) — at the standard rent-burdened threshold; future hikes will face affordability resistance.
Forward outlook
- Local home prices are declining (-3.0%/yr); year-one equity from $3k of loan paydown is wiped out by about $12k of value loss. Plan a longer hold.
- Burlington County population projected to shrink 5% by 2050 — rents likely to lag national; underwrite the cash flow, not the appreciation.
Negotiation context
- Only 1 days on market — expect competitive offers; lowballing is unlikely to land.
- Current owner paid $281k; 46% above their basis — modest negotiation headroom, anchor on the comps not their cost.
Risks & watch-outs
- Watch-outs: built in 1958 — expect roof / HVAC / electrical / plumbing capex.
- Climate carrying-cost: major wind risk, 54% chance of damaging wind over 30y; extreme-heat days projected 7→15/yr by 2055 (HVAC capex compounding) — expect insurance premiums to compound above CPI over the hold.
Questions for the listing agent
- Have any recent inspections been done? Can we get a copy of the seller's disclosures and any deferred-maintenance estimates?
- Built in 1958 — when were the roof, HVAC, electrical panel, plumbing, and water heater last replaced?
- Is there a deadline driving the sale (1031 exchange, divorce, estate, relocation)? That informs how much negotiation room exists.
- The area grade is low — what's the realistic commute time and amenity access for the typical tenant pool here? Any planned neighborhood developments (good or bad) we should know about?
- What's the average days-on-market for RENTAL listings here right now (not sales)? A rising rental-DOM trend means longer vacancies and softer asking-rent achievability than the comps imply.
- What's the recent tenant-quality profile in this submarket — average credit score on applications, eviction rate, late-payment / NSF rate, and stable-employment percentage? A property-management company in the area should have these aggregated.
- How much new for-sale + rental construction is in the pipeline within 1–3 miles? Heavy new supply typically softens prices + rents 12–24 months out; constrained supply supports both.
Investment metrics
- 1% rule
- 0.89% ✗
- Cap rate
- 6.42%
- Cash-on-cash
- 0.44%
- DSCR
- 1.02
- GRM
- 9.4
CMA / ARV
- ARV (on-the-fly)
- $452,824
- Comps found
- 12
Show comp detail 12 sales within ~0.75 mi
| Address | Dist | Beds/Ba | Sqft | Sold | Price | $/sf | Match |
|---|---|---|---|---|---|---|---|
| 14 Lancaster Ct | 0.39mi | 3/2.5 | 2,128 (+1%) | 2mo | $450,000 | $211 | 78 |
| 30 Dover Rd | 0.25mi | 4/2.0 (+1) | 2,183 (+3%) | 6mo | $485,000 | $222 | 73 |
| 603 Bloomfield Dr | 0.21mi | 3/3.0 | 2,188 (+3%) | 10mo | $460,000 | $210 | 72 |
| 204 Woodpecker Ln | 0.50mi | 3/2.0 | 1,987 (-6%) | 1mo | $407,360 | $205 | 66 |
| 13 Tarnsfield Rd | 0.42mi | 4/2.5 (+1) | 2,178 (+3%) | 6mo | $380,000 | $174 | 63 |
| 15 Lancaster Dr | 0.54mi | 3/2.5 | 2,044 (-3%) | 8mo | $510,000 | $250 | 61 |
| 65 Dover Rd | 0.21mi | 3/1.5 | 1,860 (-12%) | 11mo | $445,555 | $240 | 59 |
| 207 Canary Ln | 0.38mi | 3/1.5 | 1,802 (-15%) | 1mo | $369,900 | $205 | 55 |
| 16 Lancaster Ct | 0.38mi | 4/2.5 (+1) | 1,858 (-12%) | 0mo | $485,000 | $261 | 54 |
| 50 Brighton Rd | 0.48mi | 4/2.0 (+1) | 2,335 (+10%) | 4mo | $500,000 | $214 | 52 |
| 1010 Holly Ln | 0.46mi | 4/1.5 (+1) | 1,938 (-8%) | 11mo | $435,000 | $224 | 48 |
| 503 Emma St | 0.70mi | 3/2.0 | 1,897 (-10%) | 9mo | $406,000 | $214 | 42 |
Match score weights: distance 35% · size 25% · config 20% · recency 20%. Top-matched comps best support the ARV.
Projected returns pro-forma
-3.0% appreciation · 1.42% rent growth · sell at horizon
- IRR
- -17.4%
- Equity multiple
- 0.40×
- Total profit
- $-69,550
- Equity at exit
- $61,281
- IRR
- -12.6%
- Equity multiple
- 0.31×
- Total profit
- $-79,559
- Equity at exit
- $35,536
Cash invested: $115,080 (down + closing). Projections, not guarantees.
Landlord ↔ Tenant lean methodology
- Overall (STATE)
- 21 Tenant-Leaning
- State New Jersey
- 21 Tenant-Leaning · D+6
- County
- — inherits STATE
- City
- — inherits STATE
ZIP-level market 08060
- Home prices YoY
- -34.5%
- Rents YoY
- 1.4%
- Active inventory
- 134
- Price-to-rent
- 9.4×
Monthly cashflow live
- Estimated rent
- $3,649 high interval (Pro) →
- Mortgage (P&I)
- −$2,155
- Tax est. 1.5%
- −$514 /mo · $6,165/yr
- Insurance
- −$171
- HOA
- −$0
- Vacancy / Maint / Mgmt
- −$766
- Net cashflow
- $42
Break-even live
UW: 25.0% down · 7.5% · 30yr · 1.5% tax · 5.0% vac · 8.0% maint · 8.0% mgmt
Financing live
Cash to close
- Down payment
- $102,750
- Closing costs
- $12,330
- Reserves months
- —
- Total cash needed
- —
Loan-product check · same deal, 3 products live
Conventional
25% down · 7.5% · 30yr
- Down + closing
- —
- Monthly P&I
- —
- Monthly cashflow
- —
- DSCR
- —
- Eligible?
- —
Personal DTI + credit; lowest rate.
DSCR
20% down · 8.5% · 30yr
- Down + closing
- —
- Monthly P&I
- —
- Monthly cashflow
- —
- DSCR
- —
- Eligible?
- —
No personal income docs; deal must DSCR.
Hard money
10% down · 12.0% · 12mo
- Down + closing
- —
- Monthly P&I
- —
- Monthly cashflow
- —
- DSCR
- —
- Eligible?
- —
Short-term bridge; refi at stabilization.
Rent comps 10 comps
| Address | Beds | Baths | Sqft | Rent | $/sqft | DOM | Units | Dist |
|---|---|---|---|---|---|---|---|---|
| 501 Bloomfield Dr Westampton, NJ | 4.0 | 2.0 | 1975 | $4,950 | $2.51 | 1d | 1 | 0.25mi |
| 1 Kirby Ct Mt Holly, NJ | 1.0–3.0 | 1.0–2.5 | 1349 | $3,125 | $2.32 | 1d | 12 | 0.26mi |
| 502 Bloomfield Dr Westampton, NJ | 4.0 | 3.0 | 1666 | $4,950 | $2.97 | 1d | 1 | 0.27mi |
| 64 Regency Dr Mt Holly, NJ | 1.0–3.0 | 1.0–2.0 | 1066 | $2,800 | $2.63 | 1d | 1 | 0.35mi |
| 610 Ogden Dr Westampton, NJ | 4.0 | 2.0 | 2370 | $4,200 | $1.77 | 22d | 1 | 0.39mi |
| 302 Barrington Ct Mt Holly, NJ | 1.0–3.0 | 1.0–2.5 | 1226 | $2,959 | $2.41 | 1d | 9 | 0.41mi |
| 10 Stanton Rd Mount Holly, NJ | 3.0 | 2.5 | 2208 | $3,300 | $1.49 | 1d | 1 | 0.43mi |
| 209 Front St Mount Holly, NJ | 4.0 | 2.5 | 1500 | $4,950 | $3.30 | 1d | 1 | 0.90mi |
| 144 Washington St Unit C Mt Holly, NJ | 3.0 | 1.0 | 1450 | $2,370 | $1.63 | 15d | 1 | 1.06mi |
| 37 Church St Mount Holly, NJ | 3.0 | 1.5 | 1900 | $2,370 | $1.25 | 10d | 1 | 1.21mi |
Listing history 3 events
-
2026-04-08soldstatus $280,759 Closed 890-char remark
Show marketing remark (890 chars)
Opportunity knocks! This ranch-style home offers potential for buyers ready to add their personal touch. Featuring 3 bedrooms and 1.5 baths, the property sits on a generously sized lot with plenty of room to grow. Inside, you’ll find a spacious living and dining room combination. The kitchen has been previously updated with classic white Shaker-style cabinetry and includes gas cooking. The primary bedroom features a convenient ensuite half bath, while two additional bedrooms share a full bath with a tub/shower combination. The unfinished basement provides excellent potential for future expansion, a workshop, or abundant storage space. Step outside to a large backyard with an open patio—ideal for relaxing, gardening, or hosting gatherings. Bring your vision and creativity to transform this promising property into your dream home or a rewarding investment opportunity!
-
2026-03-06historical 890-char remark
Show marketing remark (890 chars)
Opportunity knocks! This ranch-style home offers potential for buyers ready to add their personal touch. Featuring 3 bedrooms and 1.5 baths, the property sits on a generously sized lot with plenty of room to grow. Inside, you’ll find a spacious living and dining room combination. The kitchen has been previously updated with classic white Shaker-style cabinetry and includes gas cooking. The primary bedroom features a convenient ensuite half bath, while two additional bedrooms share a full bath with a tub/shower combination. The unfinished basement provides excellent potential for future expansion, a workshop, or abundant storage space. Step outside to a large backyard with an open patio—ideal for relaxing, gardening, or hosting gatherings. Bring your vision and creativity to transform this promising property into your dream home or a rewarding investment opportunity!
-
2026-02-23$254,900 Active 890-char remark
Show marketing remark (890 chars)
Opportunity knocks! This ranch-style home offers potential for buyers ready to add their personal touch. Featuring 3 bedrooms and 1.5 baths, the property sits on a generously sized lot with plenty of room to grow. Inside, you’ll find a spacious living and dining room combination. The kitchen has been previously updated with classic white Shaker-style cabinetry and includes gas cooking. The primary bedroom features a convenient ensuite half bath, while two additional bedrooms share a full bath with a tub/shower combination. The unfinished basement provides excellent potential for future expansion, a workshop, or abundant storage space. Step outside to a large backyard with an open patio—ideal for relaxing, gardening, or hosting gatherings. Bring your vision and creativity to transform this promising property into your dream home or a rewarding investment opportunity!
ⓘ Source: listings_history table (triggers on properties + properties_extension) + one-shot
backfill from property_details.listing_events for pre-trigger history.
Climate risk First Street
- Flood 1/10 Low FEMA zone X (unshaded) · 0% chance over 30 yrs
- Wildfire 1/10 Low
- Heat 6/10 Major 7 d/yr ≥104°F today · 15 d/yr by 30 yrs out
- Wind 6/10 Major 54% chance of damaging wind over 30 yrs
- Air quality 4/10 Moderate 5 unhealthy d/yr today · 7 by 30 yrs out
Nearby sold comps map
Loading sold comps map…
Walkable amenities ~0.75 mi
Loading nearby amenities…
Taxation est. · year 1
- Rental income
- $43,790
- − Mortgage interest
- −$23,022
- − Property taxes
- −$6,165
- − Insurance
- −$2,055
- − Repairs & maintenance
- −$3,503
- − Management
- −$3,503
- − Depreciation
- −$11,956
- Taxable loss
- −$6,416
- Est. tax savings @ 24.0%
- +$1,540
- After-tax cash flow
- $2,050/yr
For passive investors: Depreciation is non-cash, so a rental often shows a tax loss while cash-flowing — sheltering income. Rental losses are passive: they offset passive income freely, and up to $25,000/yr can offset ordinary (W-2) income if you actively participate and your MAGI is under $100k (phasing out to $0 by $150k); unused losses carry forward. On sale, claimed depreciation is recaptured at up to 25%, and gains may owe capital-gains tax (a 1031 exchange can defer both). Figures are a year-1 estimate at your 24.0% rate — not tax advice; consult a CPA.
Condition & rehab AI · 12 photos
This home requires moderate renovations, including new flooring, countertops, and landscaping, to improve its condition and value.
Repairs flagged
- Major Exposed subfloor in kitchen and bath — Structural damage
- Major Missing countertops and fixtures — Aesthetic and functional issues
- Major Missing flooring — Safety hazard and aesthetic issue
Value-add opportunities
- Resale New countertops and fixtures in kitchen and bath — Enhances aesthetic and functionality
- Resale New flooring and paint — Improves overall appearance
- Both Landscaping and exterior maintenance — Enhances curb appeal and property value
Renovation cost estimate screening
| Repair item | Severity | Est. cost |
|---|---|---|
| Exposed subfloor in kitchen and bath · Structural damage | Major | $15,000–50,000 |
| Missing countertops and fixtures · Aesthetic and functional issues | Major | $15,000–50,000 |
| Missing flooring · Safety hazard and aesthetic issue | Major | $15,000–50,000 |
| Total estimated repair cost · 3 items | $45,000–150,000 |
Value-add ROI direction
- Resale New countertops and fixtures in kitchen and bath — Enhances aesthetic and functionality ↑
- Resale New flooring and paint — Improves overall appearance ↑
- Both Landscaping and exterior maintenance — Enhances curb appeal and property value ↑
ⓘ Cost ranges are severity-bucket heuristics (US national rule-of-thumb). Get contractor quotes + a written scope before underwriting a rehab budget.
Schools (NCES district)
- District
- Westampton Township Public School District
- NCES district ID
- 3417730
- Math proficiency
- 17% ▼ -21.00%
- Reading proficiency
- 44% ▼ -12.00%
- Median HH income
- $97,154
- Composite
- 31.02/100
- National rank
- #6090
- State rank
- #288 of 472 in NJ
Livability — Westampton
No livability data for this city. (Only ~50 U.S. cities are tracked.)
Census & demographics
- County
- Burlington County · 323,710 people
- Metro
- Philadelphia-Camden-Wilmington, PA-NJ-DE-MD
- Population (ZIP)
- 25,835
- Household income
- $109,292
- Rent vs Own
- Severe rent burden
- 562.0
Population outlook (Burlington County) Hauer SSP2
- Today (2025)
- 453,425 people
- By 2030
- 452,359 · -0.2%
- By 2040
- 445,033 · -1.9%
- By 2050
- 431,760 · -4.8%
- By 2075
- 406,277 · -10.4%
- By 2100
- 364,732 · -19.6%
Race, ethnicity, and origin ACS 2023
- Neighborhood character
- Diverse neighborhood (Simpson 0.68)
- Race & ethnicity
- White 49% Black 25% Two or more races 15% Hispanic / Latino 13% Asian 4%
- Hispanic origin (detail)
- Mexican 2% Puerto Rican 7%
- Common ancestry
- Romanian 4% Lithuanian 2% Italian 1%
- Foreign-born
- 11% · Canada, Dominican Republic, China
- Languages at home
- 87% English-only · Spanish 7% Other Indo-European 2% French/Haitian/Cajun 1%
Political lean MEDSL · Burlington
- 2024 margin
- D (+16.6) · D 57.6% · R 41.0% · Other 1.3%
- 2008→2024 swing
- -2.0pp toward R · 2008: 18.6pp · 2024: 16.6pp
- All cycles
- 2024: D+16.6 2020: D+19.5 2016: D+14.8 2012: D+18.7 2008: D+18.6
Not yet ingested
- Civics
- —
Market trends
- HPI YoY
- ▼ -156.50%
- Current HPI
- 296.564
- Rent YoY
- ▲ 1.42%
- Metro
- Philadelphia-Camden-Wilmington, PA-NJ-DE-MD
- State GDP YoY
- ▲ 2.05%
- F500 in state
- 34
Industry mix (Fortune 500 HQ in NJ)
| Industry | F500 HQs | Revenue |
|---|---|---|
| Consumer Goods | 3 | $31B |
|
||
| Pharmaceuticals | 2 | $153B |
|
||
| Technology | 2 | $21B |
|
||
| Insurance | 2 | $20B |
|
||
| Healthcare | 2 | $19B |
|
||
| Financial Services | 1 | $70B |
|
||
Price history
+10.1% since first listed3 events — show timeline
- 2026-04-08 Sold (MLS) $280,759 BRIGHT MLS
- 2026-03-06 Listing Removed — BRIGHT MLS
- 2026-02-23 Listed $254,900 BRIGHT MLS
Cash-flow waterfall
monthlySold comps — $/sqft
last 12 mo · ≤1 miLoading sold comps…