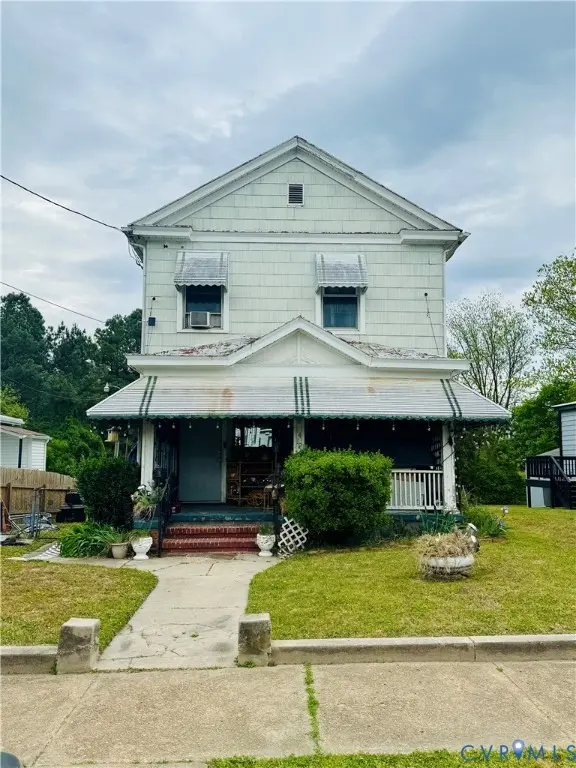
1419 Custer St · Petersburg, VA
Flood risk 1/10 · Minimal
- FEMA flood zone
- X (unshaded)
- Chance of flooding over 30 yrs
- 0.0%
- Est. flood insurance / yr
- $507 – $1,088
Fire risk 3/10 · Minor
- Est. fire insurance / yr
- $666 – $1,236
Heat risk 7/10 · Major
- Hot days now (above 109°F)
- 7 days/yr
- Hot days in 30 yrs
- 16 days/yr
Wind risk 6/10 · Moderate
- Chance of severe wind over 30 yrs
- 45.0%
Air-quality risk 2/10 · Minimal
- Unhealthy air days now
- 0 days/yr
- Unhealthy air days in 30 yrs
- 1 days/yr
Risk factors via First Street. Map © Google.
Why this score? — see what drove the B+ grade
The composite is a weighted blend of 9 inputs, each scored 0–100. Each bar is that input's sub-score; the figure is the points it added to the 100-point composite (weight × sub-score).
- Cash flow +30.0/30.0
- 1% rule +10.0/10.0
- DSCR +10.0/10.0
- ARV discount +7.5/15.0
- Appreciation +5.7/10.0
- Rent growth +4.0/5.0
- Livability +3.1/5.0
- Schools +2.9/10.0
- Condition / age +2.5/5.0
$85,000
🖨 Deal sheet 📄 Offer letter ✓ Due diligence
Listing remarks
INVESTOR SPECIAL! Great opportunity to invest in this 2 bedroom, 1 bath home. Inquire today!
Key facts
- 7,649 sq ft lot
- Built 1900
Neighborhood map
What this means for you Summary
Snapshot
- This is a 2-bed/1.0-bath single-family listed at $85k.
Deal economics
- At list price, monthly cash flow is $637 ($8k/yr) — positive.
- The deal already cash-flows at list — no discount required.
- Meets the 1% rule at list price ($2k rent vs $85k).
- Cap rate 15.3% vs local median 4.5% in Petersburg — top-decile yield for the area; either an underpriced asset or a hidden risk that comps aren't pricing in. Stress-test before assuming the spread holds.
Location & tenants
- Location reads 61/100 on livability (#413 in VA) — a middle-class / working-renter tenant base. Strengths: cost of living A+, housing A; Watch: schools D+, crime F, amenities F.
- Petersburg City Public School District (suburban): math 26% / reading 44% proficiency, ranked #131 of 131 in VA (top 100%) — families likely to look elsewhere, expect single-tenant / working-renter base with shorter leases; 79% free/reduced lunch — lower-income household profile, screen leases tightly.
- Market conditions: Rents rising fast (+5.9%/yr); 290 active listings in the ZIP; 10 comparable units currently listed for rent nearby; rentals at typical pace (median 18d on market — plan ~3-4 weeks tenant-placement turnaround); 118 units permitted in Petersburg city in 2024 (84 in 5+ unit buildings).
- This rent runs 31% of the median local income ($58k/yr) — at the standard rent-burdened threshold; future hikes will face affordability resistance.
Forward outlook
- In year one you build about $2k of equity ($588 loan paydown + $1k appreciation (1.4% local appreciation)).
- Petersburg County population projected at -10% by 2050 — secular population decline; favor cash flow + early exit over multi-decade hold.
- At projected returns (1.4% appreciation + 5.9% rent growth), your $24k cash investment doubles in ~3 years — after that, you're playing with house money.
Negotiation context
- Only 1 days on market — expect competitive offers; lowballing is unlikely to land.
Risks & watch-outs
- Watch-outs: built in 1900 — expect roof / HVAC / electrical / plumbing capex.
- Climate carrying-cost: major wind risk, 45% chance of damaging wind over 30y; extreme-heat days projected 7→16/yr by 2055 (HVAC capex compounding) — expect insurance premiums to compound above CPI over the hold.
Questions for the listing agent
- Built in 1900 — when were the roof, HVAC, electrical panel, plumbing, and water heater last replaced?
- Is there a deadline driving the sale (1031 exchange, divorce, estate, relocation)? That informs how much negotiation room exists.
- Schools are D-rated, which usually means shorter tenancies and higher turnover. Who's the typical renter profile here, and what's been the actual vacancy rate?
- Crime grade is F in this area — have there been break-ins, vandalism, or insurance claims at this property in the last 3 years? What carrier currently insures it and at what premium?
- What's the average days-on-market for RENTAL listings here right now (not sales)? A rising rental-DOM trend means longer vacancies and softer asking-rent achievability than the comps imply.
- What's the recent tenant-quality profile in this submarket — average credit score on applications, eviction rate, late-payment / NSF rate, and stable-employment percentage? A property-management company in the area should have these aggregated.
- How much new for-sale + rental construction is in the pipeline within 1–3 miles? Heavy new supply typically softens prices + rents 12–24 months out; constrained supply supports both.
Investment metrics
- 1% rule
- 1.77% ✓
- Cap rate
- 15.28%
- Cash-on-cash
- 32.11%
- DSCR
- 2.43
- GRM
- 4.7
CMA / ARV
- ARV (on-the-fly)
- $259,200
- Comps found
- 12
Show comp detail 12 sales within ~0.75 mi
| Address | Dist | Beds/Ba | Sqft | Sold | Price | $/sf | Match |
|---|---|---|---|---|---|---|---|
| 742 Kirkham St | 0.39mi | 3/2.0 (+1) | 1,621 (+1%) | 2mo | $263,000 | $162 | 69 |
| 936 Weaver Ave | 0.28mi | 3/2.0 (+1) | 1,584 (-1%) | 9mo | $192,500 | $122 | 69 |
| 38 Spring Ct | 0.21mi | 3/1.5 (+1) | 1,673 (+5%) | 11mo | $240,000 | $143 | 67 |
| 688 Pegram St | 0.57mi | 3/1.0 (+1) | 1,665 (+4%) | 3mo | $95,000 | $57 | 59 |
| 1330 Halifax St | 0.21mi | 3/2.0 (+1) | 1,732 (+8%) | 11mo | $254,500 | $147 | 58 |
| 1232 Halifax St | 0.28mi | 3/2.0 (+1) | 1,487 (-7%) | 13mo | $285,000 | $192 | 56 |
| 1217 Arlington St | 0.44mi | 3/2.0 (+1) | 1,408 (-12%) | 4mo | $225,000 | $160 | 48 |
| 751 Jones St | 0.65mi | 3/2.0 (+1) | 1,450 (-9%) | 3mo | $240,000 | $166 | 43 |
| 746 St John St | 0.38mi | 3/2.5 (+1) | 1,824 (+14%) | 6mo | $290,000 | $159 | 43 |
| 710 Wesley St | 0.73mi | 3/2.0 (+1) | 1,450 (-9%) | 6mo | $242,000 | $167 | 36 |
| 1748 Youngs Rd | 0.64mi | 3/2.0 (+1) | 1,383 (-14%) | 4mo | $235,000 | $170 | 35 |
| 623 Pegram St | 0.70mi | 3/2.0 (+1) | 1,360 (-15%) | 8mo | $265,000 | $195 | 26 |
Match score weights: distance 35% · size 25% · config 20% · recency 20%. Top-matched comps best support the ARV.
Projected returns pro-forma
1.45% appreciation · 5.89% rent growth · sell at horizon
- IRR
- 37.8%
- Equity multiple
- 3.04×
- Total profit
- $48,527
- Equity at exit
- $31,020
- IRR
- 40.8%
- Equity multiple
- 6.56×
- Total profit
- $132,365
- Equity at exit
- $42,818
Cash invested: $23,800 (down + closing). Projections, not guarantees.
Landlord ↔ Tenant lean methodology
- Overall (STATE)
- 55 Moderately Landlord-Leaning
- State Virginia
- 55 Moderately Landlord-Leaning · D+2
- County
- — inherits STATE
- City
- — inherits STATE
ZIP-level market 23803
- Home prices YoY
- 0.3%
- Rents YoY
- 5.9%
- Active inventory
- 290
- Price-to-rent
- 4.7×
Monthly cashflow live
- Estimated rent
- $1,501 high interval (Pro) →
- Mortgage (P&I)
- −$446
- Tax from tax record
- −$68 /mo · $813/yr
- Insurance
- −$35
- HOA
- −$0
- Vacancy / Maint / Mgmt
- −$315
- Net cashflow
- $637
Break-even live
UW: 25.0% down · 7.5% · 30yr · 1.5% tax · 5.0% vac · 8.0% maint · 8.0% mgmt
Financing live
Cash to close
- Down payment
- $21,250
- Closing costs
- $2,550
- Reserves months
- —
- Total cash needed
- —
Loan-product check · same deal, 3 products live
Conventional
25% down · 7.5% · 30yr
- Down + closing
- —
- Monthly P&I
- —
- Monthly cashflow
- —
- DSCR
- —
- Eligible?
- —
Personal DTI + credit; lowest rate.
DSCR
20% down · 8.5% · 30yr
- Down + closing
- —
- Monthly P&I
- —
- Monthly cashflow
- —
- DSCR
- —
- Eligible?
- —
No personal income docs; deal must DSCR.
Hard money
10% down · 12.0% · 12mo
- Down + closing
- —
- Monthly P&I
- —
- Monthly cashflow
- —
- DSCR
- —
- Eligible?
- —
Short-term bridge; refi at stabilization.
Rent comps 10 comps
| Address | Beds | Baths | Sqft | Rent | $/sqft | DOM | Units | Dist |
|---|---|---|---|---|---|---|---|---|
| 1131 Hawk St Petersburg, VA | 3.0 | 2.0 | 1100 | $1,800 | $1.64 | 44d | 1 | 0.20mi |
| 838 S Jones St Unit B Petersburg, VA | 2.0 | 1.0 | 1296 | $1,100 | $0.85 | 44d | 1 | 0.59mi |
| 1640 Johnson Rd Petersburg, VA | 1.0–3.0 | 1.0–1.5 | 972 | $1,289 | $1.33 | 2d | 11 | 0.79mi |
| 1649 Delmar Ave Petersburg, VA | 3.0 | 1.5 | 1248 | $1,700 | $1.36 | 2d | 1 | 0.86mi |
| 2125 Dupuy Rd Petersburg, VA | 3.0 | 1.0 | 1063 | $1,299 | $1.22 | 2d | 1 | 1.11mi |
| 115 Pine St Unit 115 Petersburg, VA | 3.0 | 1.5 | 1400 | $1,462 | $1.04 | 44d | 1 | 1.18mi |
| 712 W Washington St Unit B Petersburg, VA | 2.0 | 1.0 | 1209 | $1,250 | $1.03 | 24d | 1 | 1.26mi |
| 2350 Hill St Unit H Petersburg, VA | 3.0 | 1.5 | 1193 | $1,775 | $1.49 | 2d | 1 | 1.28mi |
| 110 Grigg St Petersburg, VA | 3.0 | 1.5 | 1200 | $1,600 | $1.33 | 2d | 1 | 1.34mi |
| 1823 Brandon Ave Petersburg, VA | 3.0 | 1.0 | 1153 | $1,600 | $1.39 | 17d | 1 | 1.36mi |
Listing history 2 events
-
2026-04-16status Pending
-
2026-04-15$85,000 Active
ⓘ Source: listings_history table (triggers on properties + properties_extension) + one-shot
backfill from property_details.listing_events for pre-trigger history.
Tax reassessment forecast VA · Resets to sale price
- Current annual tax
- $813 · $68/mo
- Projected year-2 tax
- $813 · $68/mo
- Expected delta
- $0/yr ($0/mo · 0.0%)
ⓘ Screening estimate from a state-policy table — verify with the county assessor before closing.
Climate risk First Street
- Flood 1/10 Low FEMA zone X (unshaded) · 0% chance over 30 yrs
- Wildfire 3/10 Moderate
- Heat 7/10 Severe 7 d/yr ≥109°F today · 16 d/yr by 30 yrs out
- Wind 6/10 Major 45% chance of damaging wind over 30 yrs
- Air quality 2/10 Low 0 unhealthy d/yr today · 1 by 30 yrs out
Nearby sold comps map
Loading sold comps map…
Walkable amenities ~0.75 mi
Loading nearby amenities…
Taxation est. · year 1
- Rental income
- $18,012
- − Mortgage interest
- −$4,761
- − Property taxes
- −$813
- − Insurance
- −$425
- − Repairs & maintenance
- −$1,441
- − Management
- −$1,441
- − Depreciation
- −$2,473
- Taxable income
- $6,659
- Est. tax owed @ 24.0%
- −$1,598
- After-tax cash flow
- $6,045/yr
For passive investors: Depreciation is non-cash, so a rental often shows a tax loss while cash-flowing — sheltering income. Rental losses are passive: they offset passive income freely, and up to $25,000/yr can offset ordinary (W-2) income if you actively participate and your MAGI is under $100k (phasing out to $0 by $150k); unused losses carry forward. On sale, claimed depreciation is recaptured at up to 25%, and gains may owe capital-gains tax (a 1031 exchange can defer both). Figures are a year-1 estimate at your 24.0% rate — not tax advice; consult a CPA.
Schools (NCES district)
- District
- Petersburg City Public School District
- NCES district ID
- 5102910
- Math proficiency
- 26% ▼ -27.00%
- Reading proficiency
- 44% ▼ -8.00%
- Median HH income
- $34,362
- Composite
- 28.78/100
- National rank
- #6670
- State rank
- #131 of 131 in VA
Livability — Petersburg
- Score
- 61/100
- State rank
- #413
- US rank
- #17309
Category grades
Schools grade is shown separately in the Schools card above.
Census & demographics
- Census place
- Petersburg, VA
- County
- Chesterfield County · 406,988 people
- City population
- 63,420
- Metro
- Richmond, VA
- Population (ZIP)
- 42,012
- Household income
- $57,813
- Rent vs Own
- Severe rent burden
- 2485.0
Population outlook (Petersburg County) Hauer SSP2
- Today (2025)
- 30,488 people
- By 2030
- 29,771 · -2.4%
- By 2040
- 28,401 · -6.8%
- By 2050
- 27,279 · -10.5%
- By 2075
- 25,877 · -15.1%
- By 2100
- 24,288 · -20.3%
Race, ethnicity, and origin ACS 2023
- Neighborhood character
- Diverse neighborhood (Simpson 0.57)
- Race & ethnicity
- Black 58% White 31% Hispanic / Latino 6% Two or more races 5%
- Hispanic origin (detail)
- Mexican 1% Puerto Rican 2%
- Common ancestry
- Italian 1% Romanian 1% Slovak 1%
- Foreign-born
- 4% · Canada
- Languages at home
- 93% English-only · Spanish 5%
Political lean MEDSL · Petersburg
- 2024 margin
- Solid D (+72.8) · D 85.8% · R 13.0% · Other 1.2%
- 2008→2024 swing
- -5.7pp toward R · 2008: 78.5pp · 2024: 72.8pp
- All cycles
- 2024: D+72.8 2020: D+76.5 2016: D+77.0 2012: D+80.4 2008: D+78.5
Not yet ingested
- Civics
- —
Market trends
- HPI YoY
- ▲ 1.45%
- Current HPI
- 480.5365
- Rent YoY
- ▲ 5.89%
- Metro
- Richmond, VA
- State GDP YoY
- ▲ 2.40%
- F500 in state
- 50
Industry mix (Fortune 500 HQ in VA)
| Industry | F500 HQs | Revenue |
|---|---|---|
| Aerospace / Defense | 4 | $236B |
|
||
| Technology / Defense | 3 | $32B |
|
||
| Financial Services | 2 | $176B |
|
||
| Utilities | 2 | $27B |
|
||
| Insurance | 2 | $25B |
|
||
| Technology | 2 | $15B |
|
||
Price history
2 events — show timeline
- 2026-04-16 Pending — CVRMLS
- 2026-04-15 Listed $85,000 CVRMLS
Property tax history
+2.0%/yrLatest (2025): $813 · +32.5% YoY. Source: county tax records.
Cash-flow waterfall
monthlySold comps — $/sqft
last 12 mo · ≤1 miLoading sold comps…