 Duplex
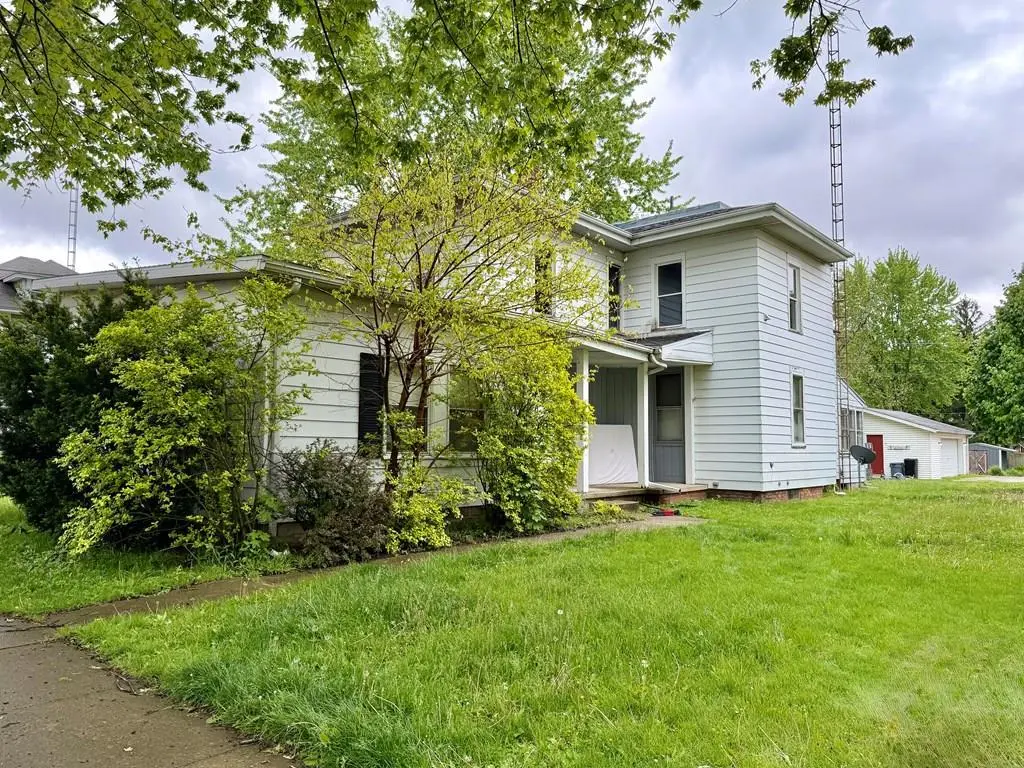
413 &1/2 Woodlawn Ave · Bucyrus, OH
Flood risk No data
- FEMA flood zone
- —
- Chance of flooding over 30 yrs
- —
- Est. flood insurance / yr
- —
Fire risk No data
- Est. fire insurance / yr
- —
Heat risk No data
- Hot days now (above threshold)
- —
- Hot days in 30 yrs
- —
Wind risk No data
- Chance of severe wind over 30 yrs
- —
Air-quality risk No data
- Unhealthy air days now
- —
- Unhealthy air days in 30 yrs
- —
Risk factors via First Street. Map © Google.
Why this score? — see what drove the B- grade
The composite is a weighted blend of 9 inputs, each scored 0–100. Each bar is that input's sub-score; the figure is the points it added to the 100-point composite (weight × sub-score).
- Cash flow +30.0/30.0
- DSCR +10.0/10.0
- 1% rule +9.0/10.0
- ARV discount +7.5/15.0
- Livability +3.9/5.0
- Schools +3.4/10.0
- Rent growth +2.5/5.0
- Condition / age +2.2/5.0
- Appreciation +0.0/10.0
$132,000
🖨 Deal sheet (PDF) 📄 Offer letter ✓ Due diligence
Multi-family units
County records classify this as Multi-Family (2-4 Unit). Listing-text estimate: 2 units. confirmed
Listing remarks
Terrific investment opportunity for you with this 2,526sf duplex close to amenities in Bucyrus SD. This large two-unit property has had steady tenant demand and good cash-flow. Utilities are separate and tenants pay all of their own costs, including lawn and snow maintenance. The lower unit is 1,492sf and has 3 (or 4) beds, 1 bath, eat-in kitchen w/ breakfast bar, gas FA furnace, rear deck, and use of the 2-car garage (driveway off of East St). It also includes the refrigerator, stove, and has laundry hookups. The upper unit is 1,034sf and features 2 beds, 1 bath, refrigerator, and available parking off of the driveway. It has been recently remodeled in 2026 w/ new vinyl plank flooring, pai
Key facts
- 8,276 sq ft lot
- 4 parking spots
- Built 1880
Property features AI
Exterior
- Parking: 4 parking spaces
- Utilities: Public water; Public sewer
- Home design: Multi-family residential income property; Single-story
- Construction: Aluminum siding
- Exterior features: Deck
Interior
- Heating & cooling: Baseboard heating; Electric heating; Forced air heating; Natural gas heating
- Interior features: Full walk-out basement
- Laundry & utility: Gas water heater
Neighborhood map
What this means for you Summary
Snapshot
- This is a 2 × 2-bed/1.0-bath units multifamily listed at $132k. Condition is rated fair.
Deal economics
- At list price, monthly cash flow is $549 ($7k/yr) — positive. Per door: $275/mo.
- The deal already cash-flows at list — no discount required.
- Meets the 1% rule at list price ($2k rent vs $132k).
- Recommended offer: $128k (3.0% below list) — sets the bar for market timing.
- Cap rate 11.3% vs local median 4.4% in Bucyrus — top-decile yield for the area; either an underpriced asset or a hidden risk that comps aren't pricing in. Stress-test before assuming the spread holds.
Location & tenants
- Location reads 78/100 on livability (#158 in OH, #2,388 nationally) — a middle-class / working-renter tenant base. Strengths: cost of living A+, housing A+, health & safety A+; Watch: employment D, amenities F, commute F.
- Bucyrus City (town): math 37% / reading 46% proficiency, ranked #537 of 656 in OH (top 82%) — families likely to look elsewhere, expect single-tenant / working-renter base with shorter leases.
- Market conditions: 81 active listings in the ZIP; 8 units permitted in Crawford County in 2024 (0 in 5+ unit buildings).
- This rent runs 39% of the median local income ($57k/yr) — at the standard rent-burdened threshold; future hikes will face affordability resistance.
Forward outlook
- Local home prices are declining (-3.0%/yr); year-one equity from $913 of loan paydown is wiped out by about $4k of value loss. Plan a longer hold.
- Crawford County population projected at -22% by 2050 — secular population decline; favor cash flow + early exit over multi-decade hold.
- At projected returns (-3.0% appreciation + 3.0% rent growth), your $37k cash investment doubles in ~7 years — after that, you're playing with house money.
Negotiation context
- It's been on market 42 days — a 3% lower offer ($128k) is reasonable based on typical stale-listing flexibility.
- 7 sale attempts since 14y ago with the ask held roughly flat each time — persistent listings suggest the price (not the market) is what's stuck; bring a comps-based counter.
Risks & watch-outs
- Watch-outs: built in 1880 — expect roof / HVAC / electrical / plumbing capex.
Questions for the listing agent
- It's been on market 42 days. Have you received any prior offers? Is the seller open to a 3% concession, seller financing, or rate buy-down credit?
- Can we see the unit-by-unit rent roll, current vacancy, and any below-market leases? What's the average tenancy length?
- What capital expenditures (roof, boiler, parking lot, exteriors) have been made in the last 5 years, and what's planned in the next 2?
- Have any recent inspections been done? Can we get a copy of the seller's disclosures and any deferred-maintenance estimates?
- Built in 1880 — when were the roof, HVAC, electrical panel, plumbing, and water heater last replaced?
- Is there a deadline driving the sale (1031 exchange, divorce, estate, relocation)? That informs how much negotiation room exists.
- What's the average days-on-market for RENTAL listings here right now (not sales)? A rising rental-DOM trend means longer vacancies and softer asking-rent achievability than the comps imply.
- What's the recent tenant-quality profile in this submarket — average credit score on applications, eviction rate, late-payment / NSF rate, and stable-employment percentage? A property-management company in the area should have these aggregated.
- How much new apartment / multifamily construction is in the pipeline within 1–3 miles? Heavy new supply (>2% of stock underway) typically softens rents 12–24 months out; light construction supports rent growth.
Investment metrics
- 1% rule
- 1.40% ✓
- Cap rate
- 11.29%
- Cash-on-cash
- 17.83%
- DSCR
- 1.79
- GRM
- 5.9
CMA / ARV
- ARV (median comp)
- $74,515
- List price
- $132,000
- Delta
- 77.15%
- Verdict
- OVERPRICED
- Comps
- 3 within 1.0 mi
Projected returns pro-forma
-3.0% appreciation · 3.0% rent growth · sell at horizon
- IRR
- 9.4%
- Equity multiple
- 1.37×
- Total profit
- $13,622
- Equity at exit
- $19,682
- IRR
- 18.5%
- Equity multiple
- 2.54×
- Total profit
- $57,022
- Equity at exit
- $11,413
Cash invested: $36,960 (down + closing). Projections, not guarantees.
Landlord ↔ Tenant lean methodology
- Overall (STATE)
- 73 Landlord-Friendly
- State Ohio
- 73 Landlord-Friendly · R+6
- County
- — inherits STATE
- City
- — inherits STATE
ZIP-level market 44820
- Home prices YoY
- -27.1%
- Active inventory
- 81
- Price-to-rent
- 11.9×
Monthly cashflow live
- Estimated rent
- $1,850 medium interval (Pro) →
- Mortgage (P&I)
- −$692
- Tax est. 1.5%
- −$165 /mo · $1,980/yr
- Insurance
- −$55
- HOA
- −$0
- Vacancy / Maint / Mgmt
- −$388
- Net cashflow
- $549
Break-even live
Sensitivity live
| Price | -10% $640 | -5% $595 | +0% $549 | +5% $504 | +10% $458 |
|---|---|---|---|---|---|
| Rent | -10% $403 | -5% $476 | +0% $549 | +5% $622 | +10% $695 |
| Rate | -1.0pp $616 | -0.5pp $583 | base $549 | +0.5pp $515 | +1.0pp $480 |
2-unit breakdown (identical units grouped — click to expand)
| Units | Beds | Baths | Est. rent |
|---|---|---|---|
| 2× units | 2 | 1 | $1,850 |
| #1 | 2 | 1 | $925 |
| #2 | 2 | 1 | $925 |
| Total (2 units) | $1,850 | ||
UW: 25.0% down · 7.5% · 30yr · 1.5% tax · 5.0% vac · 8.0% maint · 8.0% mgmt
Financing live
Cash to close
- Down payment
- $33,000
- Closing costs
- $3,960
- Reserves months
- —
- Total cash needed
- —
Loan-product check · same deal, 3 products live
Conventional
25% down · 7.5% · 30yr
- Down + closing
- —
- Monthly P&I
- —
- Monthly cashflow
- —
- DSCR
- —
- Eligible?
- —
Personal DTI + credit; lowest rate.
DSCR
20% down · 8.5% · 30yr
- Down + closing
- —
- Monthly P&I
- —
- Monthly cashflow
- —
- DSCR
- —
- Eligible?
- —
No personal income docs; deal must DSCR.
Hard money
10% down · 12.0% · 12mo
- Down + closing
- —
- Monthly P&I
- —
- Monthly cashflow
- —
- DSCR
- —
- Eligible?
- —
Short-term bridge; refi at stabilization.
Listing history 28 events
-
2026-06-21days on market $132,000 Active 42 DOM
-
2026-06-18days on market $132,000 Active 40 DOM
-
2026-06-17days on market $132,000 Active 39 DOM
-
2026-06-16days on market $132,000 Active 38 DOM
-
2026-06-15days on market $132,000 Active 37 DOM
-
2026-06-13days on market $132,000 Active 35 DOM
-
2026-06-12days on market $132,000 Active 34 DOM
-
2026-06-09days on market $132,000 Active 31 DOM
-
2026-06-08days on market $132,000 Active 30 DOM
-
2026-06-07pricedays on market $132,000 Active 29 DOM
-
2026-06-05days on market $137,000 Active 27 DOM
-
2026-06-04days on market $137,000 Active 25 DOM
-
2026-06-02days on market $137,000 Active 24 DOM
-
2026-06-01days on market $137,000 Active 23 DOM
-
2026-05-31days on market $137,000 Active 22 DOM
-
2026-05-09$137,000 Active 833-char remark
-
2025-10-14historical
-
2016-06-30historical
-
2016-06-30historical
-
2015-06-05$69,900
-
2015-06-05$69,900
-
2013-09-06historical
-
2013-03-26$69,900
-
2013-03-26$69,900
-
2012-08-16historical
-
2012-08-16historical
-
2012-05-16$69,900
-
2012-05-16$69,900
ⓘ Source: listings_history table (triggers on properties + properties_extension) + one-shot
backfill from property_details.listing_events for pre-trigger history.
Nearby sold comps map
Loading sold comps map…
Walkable amenities ~0.75 mi
Loading nearby amenities…
Taxation est. · year 1
- Rental income
- $22,200
- − Mortgage interest
- −$7,394
- − Property taxes
- −$1,980
- − Insurance
- −$660
- − Repairs & maintenance
- −$1,776
- − Management
- −$1,776
- − Depreciation
- −$3,840
- Taxable income
- $4,774
- Est. tax owed @ 24.0%
- −$1,146
- After-tax cash flow
- $5,446/yr
For passive investors: Depreciation is non-cash, so a rental often shows a tax loss while cash-flowing — sheltering income. Rental losses are passive: they offset passive income freely, and up to $25,000/yr can offset ordinary (W-2) income if you actively participate and your MAGI is under $100k (phasing out to $0 by $150k); unused losses carry forward. On sale, claimed depreciation is recaptured at up to 25%, and gains may owe capital-gains tax (a 1031 exchange can defer both). Figures are a year-1 estimate at your 24.0% rate — not tax advice; consult a CPA.
Condition & rehab AI · 2 photos
This 2-unit property requires moderate repairs to exterior siding and roof inspection. Painting and roof repair would significantly enhance its curb appeal and value.
Repairs flagged
- Moderate exterior siding — Weathered and discolored
- Moderate roof inspection — No visible damage, but could use inspection
Value-add opportunities
- Both paint exterior — Enhances curb appeal and value
- Both roof inspection and repair — Ensures structural integrity and prevents future issues
Renovation cost estimate screening
| Repair item | Severity | Est. cost |
|---|---|---|
| exterior siding · Weathered and discolored | Moderate | $3,000–15,000 |
| roof inspection · No visible damage, but could use inspection | Moderate | $3,000–15,000 |
| Total estimated repair cost · 2 items | $6,000–30,000 |
Value-add ROI direction
- Both paint exterior — Enhances curb appeal and value ↑
- Both roof inspection and repair — Ensures structural integrity and prevents future issues ↑
ⓘ Cost ranges are severity-bucket heuristics (US national rule-of-thumb). Get contractor quotes + a written scope before underwriting a rehab budget.
Schools (NCES district)
- District
- Bucyrus City
- NCES district ID
- 3904368
- Math proficiency
- 37% ▼ -15.00%
- Reading proficiency
- 46% ▼ -5.00%
- Median HH income
- $36,819
- Composite
- 34.45/100
- National rank
- #5196
- State rank
- #537 of 656 in OH
Livability — Bucyrus
- Score
- 78/100
- State rank
- #158
- US rank
- #2388
Category grades
Schools grade is shown separately in the Schools card above.
Census & demographics
- Census place
- Bucyrus, OH
- County
- Crawford · 26,873 people
- City population
- 17,265
- Population (ZIP)
- 17,265
- Household income
- $56,942
- Rent vs Own
- Severe rent burden
- 8.2
Population outlook (Crawford County) Hauer SSP2
- Today (2025)
- 39,421 people
- By 2030
- 37,656 · -4.5%
- By 2040
- 34,043 · -13.6%
- By 2050
- 30,617 · -22.3%
- By 2075
- 23,652 · -40.0%
- By 2100
- 17,786 · -54.9%
Race, ethnicity, and origin ACS 2023
- Neighborhood character
- Predominantly White (93%)
- Race & ethnicity
- White 93% Two or more races 3% Hispanic / Latino 2% Asian 1% Black 1%
- Common ancestry
- Iranian 2% Lithuanian 2% Slovak 1%
- Foreign-born
- 1%
- Languages at home
- 97% English-only · Other Asian/Pacific 1% Spanish 1%
Political lean MEDSL · Crawford
- 2024 margin
- Solid R (+53.0) · D 23.1% · R 76.1%
- 2008→2024 swing
- -33.9pp toward R · 2008: -19.0pp · 2024: -53.0pp
- All cycles
- 2024: R+53.0 2020: R+50.9 2016: R+46.8 2012: R+22.7 2008: R+19.0
Not yet ingested
- Civics
- —
Market trends
- HPI YoY
- ▼ -65.64%
- Current HPI
- 176.3548
- Rent YoY
- —
- Metro
- —
- State GDP YoY
- ▲ 1.98%
- F500 in state
- 48
Industry mix (Fortune 500 HQ in OH)
| Industry | F500 HQs | Revenue |
|---|---|---|
| Insurance | 3 | $145B |
|
||
| Industrial Machinery | 3 | $49B |
|
||
| Financial Services | 3 | $24B |
|
||
| Consumer Goods | 2 | $93B |
|
||
| Aerospace / Defense | 2 | $47B |
|
||
| Utilities | 2 | $33B |
|
||
Price history
+88.8% since first listed14 events — show timeline
- 2026-06-06 Price Changed $132,000 ABOR
- 2026-05-09 Listed $137,000 ABOR
- 2025-10-14 Listing Removed — NORIS
- 2016-06-30 Listing Removed — NORIS
- 2016-06-30 Listing Removed — NORIS
- 2015-06-05 Listed $69,900 NORIS
- 2015-06-05 Listed $69,900 NORIS
- 2013-09-06 Listing Removed — NORIS
- 2013-03-26 Listed $69,900 NORIS
- 2013-03-26 Listed $69,900 NORIS
- 2012-08-16 Listing Removed — NORIS
- 2012-08-16 Listing Removed — NORIS
- 2012-05-16 Listed $69,900 NORIS
- 2012-05-16 Listed $69,900 NORIS
Cash-flow waterfall
monthlySold comps — $/sqft
last 12 mo · ≤1 miLoading sold comps…