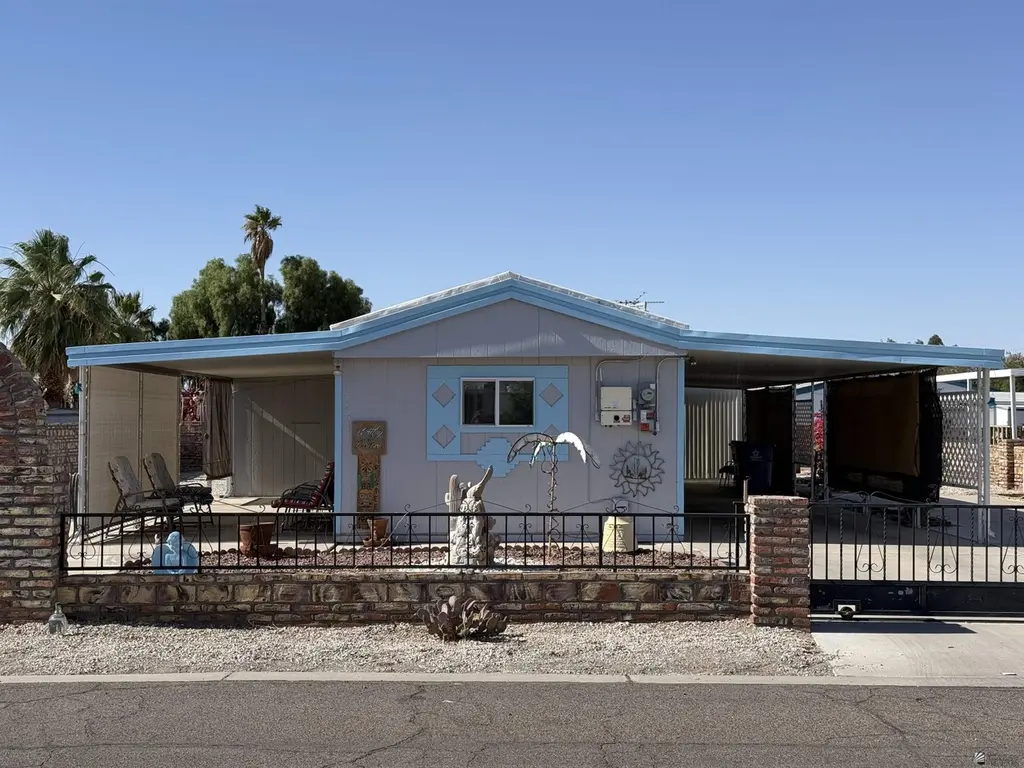
12367 E 35 Pl · Fortuna Foothills, AZ
Flood risk 1/10 · Minimal
- FEMA flood zone
- X (shaded)
- Chance of flooding over 30 yrs
- 0.0%
- Est. flood insurance / yr
- $507 – $1,088
Fire risk 4/10 · Minor
- Est. fire insurance / yr
- $610 – $1,132
Heat risk 9/10 · Severe
- Hot days now (above 113°F)
- 5 days/yr
- Hot days in 30 yrs
- 15 days/yr
Wind risk 1/10 · Minimal
- Chance of severe wind over 30 yrs
- —
Air-quality risk 1/10 · Minimal
- Unhealthy air days now
- 0 days/yr
- Unhealthy air days in 30 yrs
- 0 days/yr
Risk factors via First Street. Map © Google.
Why this score? — see what drove the B- grade
The composite is a weighted blend of 9 inputs, each scored 0–100. Each bar is that input's sub-score; the figure is the points it added to the 100-point composite (weight × sub-score).
- Cash flow +25.7/30.0
- ARV discount +15.0/15.0
- DSCR +8.5/10.0
- 1% rule +6.8/10.0
- Rent growth +3.6/5.0
- Livability +3.0/5.0
- Condition / age +2.5/5.0
- Schools +1.3/10.0
- Appreciation +0.0/10.0
$119,950
🖨 Deal sheet 📄 Offer letter ✓ Due diligence
Listing remarks
Charming and well-maintained 2 bedroom, 1 bathroom manufactured home offering comfort, convenience, and extra space for all your needs. This property features leased solar for added energy efficiency, spacious RV parking with full hook-ups, and two storage sheds providing plenty of room for tools, hobbies, or seasonal storage. Inside, you’ll find a cozy and functional layout with comfortable living spaces and an inviting atmosphere perfect for full-time living, a winter retreat, or rental potential. The outdoor space offers plenty of parking and flexibility for RV owners, guests, or additional recreational vehicles. Located in a desirable area, this home combines affordability with pr
Key facts
- Leased solar
- Two storage sheds
- Spacious rv parking
Tags
Property features AI
Exterior
- Parking: One total parking space; One covered space; Attached garage; Attached carport with one carport space; RV access/parking
- Utilities: Public water; Septic sewer
- Home design: Manufactured home (residential); Single-story mobile/manufactured
- Construction: Mobile/manufactured construction
- Exterior features: RV hookup; Covered patio; French doors; Shed(s)
Interior
- Kitchen: Refrigerator; Microwave; Electric range; Water purifier
- Flooring: Laminate flooring
- Bathrooms: One three-quarter bathroom
- Heating & cooling: Heating; Cooling
- Interior features: Drapes; No fireplace listed
Neighborhood map
What this means for you Summary
Snapshot
- This is a 2-bed/1.0-bath manufactured listed at $120k.
Deal economics
- At list price, monthly cash flow is $286 ($3k/yr) — positive.
- The deal already cash-flows at list — no discount required.
- Meets the 1% rule at list price ($1k rent vs $120k).
- Cap rate 9.2% vs local median 4.2% in Fortuna Foothills — top-decile yield for the area; either an underpriced asset or a hidden risk that comps aren't pricing in. Stress-test before assuming the spread holds.
Location & tenants
- Location reads 60/100 on livability (#174 in AZ) — a middle-class / working-renter tenant base. Strengths: cost of living A+, housing A+; Watch: employment C-, schools F, crime F.
- Yuma Union High School District (4507) (urban): math 14% / reading 16% proficiency, ranked #212 of 249 in AZ (top 85%) — low school quality limits family demand, transient renter base, plan for 1-2y turnover.
- Market conditions: Rents rising fast (+4.5%/yr); 413 active listings in the ZIP; 3 comparable units currently listed for rent nearby; rentals leasing fast (median 14d on market — plan ~1-2 weeks tenant-placement turnaround); 1,399 units permitted in Yuma County in 2024 (180 in 5+ unit buildings).
Forward outlook
- Local home prices are declining (-3.0%/yr); year-one equity from $830 of loan paydown is wiped out by about $4k of value loss. Plan a longer hold.
- Yuma County population projected at +4% by 2050 — modest demand growth; plan on rents tracking national, not racing it.
- At projected returns (-3.0% appreciation + 4.5% rent growth), your $34k cash investment doubles in ~9 years — after that, you're playing with house money.
Negotiation context
- Only 4 days on market — expect competitive offers; lowballing is unlikely to land.
- Current owner paid $49k; list at $120k implies a 144% gain — meaningful room to come down on a strong offer.
Risks & watch-outs
- Climate carrying-cost: extreme-heat days projected 5→15/yr by 2055 (HVAC capex compounding) — expect insurance premiums to compound above CPI over the hold.
Questions for the listing agent
- Is there a deadline driving the sale (1031 exchange, divorce, estate, relocation)? That informs how much negotiation room exists.
- Schools are F-rated, which usually means shorter tenancies and higher turnover. Who's the typical renter profile here, and what's been the actual vacancy rate?
- Crime grade is F in this area — have there been break-ins, vandalism, or insurance claims at this property in the last 3 years? What carrier currently insures it and at what premium?
- What's the average days-on-market for RENTAL listings here right now (not sales)? A rising rental-DOM trend means longer vacancies and softer asking-rent achievability than the comps imply.
- What's the recent tenant-quality profile in this submarket — average credit score on applications, eviction rate, late-payment / NSF rate, and stable-employment percentage? A property-management company in the area should have these aggregated.
- How much new for-sale + rental construction is in the pipeline within 1–3 miles? Heavy new supply typically softens prices + rents 12–24 months out; constrained supply supports both.
Investment metrics
- 1% rule
- 1.18% ✓
- Cap rate
- 9.15%
- Cash-on-cash
- 10.21%
- DSCR
- 1.45
- GRM
- 7.1
CMA / ARV
- ARV (on-the-fly)
- $157,380
- Comps found
- 12
Show comp detail 12 sales within ~0.75 mi
| Address | Dist | Beds/Ba | Sqft | Sold | Price | $/sf | Match |
|---|---|---|---|---|---|---|---|
| 11444 S Bonnie Ave | 0.08mi | 2/1.0 | 731 (-0%) | 12mo | $143,000 | $196 | 86 |
| 11326 S Far West Ave | 0.12mi | 2/1.0 | 784 (+7%) | 10mo | $168,000 | $214 | 74 |
| 12275 E 37 St | 0.31mi | 1/1.5 (-1) | 710 (-3%) | 2mo | $180,000 | $254 | 71 |
| 12184 E 36 Way | 0.31mi | 2/2.0 | 780 (+7%) | 2mo | $185,000 | $237 | 69 |
| 12461 E Tanja Dr | 0.32mi | 1/1.0 (-1) | 704 (-4%) | 9mo | $126,500 | $180 | 66 |
| 12273 E 38 St | 0.40mi | 2/1.0 | 672 (-8%) | 5mo | $143,000 | $213 | 63 |
| 12244 E 36 Way | 0.26mi | 1/1.5 (-1) | 800 (+9%) | 4mo | $175,000 | $219 | 62 |
| 11832 S Pamela Ln | 0.54mi | 2/1.0 | 768 (+5%) | 9mo | $200,000 | $260 | 59 |
| 12372 E 37 Pl | 0.27mi | 2/1.5 | 840 (+15%) | 4mo | $173,500 | $207 | 58 |
| 12245 E 39 St | 0.50mi | 2/1.5 | 790 (+8%) | 10mo | $170,000 | $215 | 53 |
| 12478 E 39 St | 0.46mi | 2/1.0 | 840 (+15%) | 2mo | $157,900 | $188 | 52 |
| 12475 E 39 Way | 0.57mi | 2/2.0 | 666 (-9%) | 4mo | $150,000 | $225 | 51 |
Match score weights: distance 35% · size 25% · config 20% · recency 20%. Top-matched comps best support the ARV.
Projected returns pro-forma
-3.0% appreciation · 4.46% rent growth · sell at horizon
- IRR
- 0.7%
- Equity multiple
- 1.03×
- Total profit
- $888
- Equity at exit
- $17,885
- IRR
- 11.8%
- Equity multiple
- 1.99×
- Total profit
- $33,186
- Equity at exit
- $10,371
Cash invested: $33,586 (down + closing). Projections, not guarantees.
Landlord ↔ Tenant lean methodology
- Overall (STATE)
- 87 Strongly Landlord-Friendly
- State Arizona
- 87 Strongly Landlord-Friendly · R+3
- County
- — inherits STATE
- City
- — inherits STATE
ZIP-level market 85367
- Home prices YoY
- -26.2%
- Rents YoY
- 4.5%
- Active inventory
- 413
- Price-to-rent
- 7.1×
Monthly cashflow live
- Estimated rent
- $1,411 medium interval (Pro) →
- Mortgage (P&I)
- −$629
- Tax est. 1.5%
- −$150 /mo · $1,799/yr
- Insurance
- −$50
- HOA
- −$0
- Vacancy / Maint / Mgmt
- −$296
- Net cashflow
- $286
Break-even live
UW: 25.0% down · 7.5% · 30yr · 1.5% tax · 5.0% vac · 8.0% maint · 8.0% mgmt
Financing live
Cash to close
- Down payment
- $29,988
- Closing costs
- $3,598
- Reserves months
- —
- Total cash needed
- —
Loan-product check · same deal, 3 products live
Conventional
25% down · 7.5% · 30yr
- Down + closing
- —
- Monthly P&I
- —
- Monthly cashflow
- —
- DSCR
- —
- Eligible?
- —
Personal DTI + credit; lowest rate.
DSCR
20% down · 8.5% · 30yr
- Down + closing
- —
- Monthly P&I
- —
- Monthly cashflow
- —
- DSCR
- —
- Eligible?
- —
No personal income docs; deal must DSCR.
Hard money
10% down · 12.0% · 12mo
- Down + closing
- —
- Monthly P&I
- —
- Monthly cashflow
- —
- DSCR
- —
- Eligible?
- —
Short-term bridge; refi at stabilization.
Rent comps 3 comps
| Address | Beds | Baths | Sqft | Rent | $/sqft | DOM | Units | Dist |
|---|---|---|---|---|---|---|---|---|
| 12338 E 34th Pl Yuma, AZ | 1.0 | 1.0 | 396 | $1,500 | $3.79 | 13d | 1 | 0.10mi |
| 11436 S Clara Anita Dr Yuma, AZ | 1.0 | 1.0 | 407 | $975 | $2.40 | 13d | 1 | 0.16mi |
| 13292 E 41st St Yuma, AZ | 1.0 | 1.0 | 700 | $1,195 | $1.71 | 13d | 1 | 1.15mi |
Listing history 6 events
-
2026-06-03status $119,950 Pending 4 DOM
-
2026-06-02days on market $119,950 Active 4 DOM
-
2026-06-01days on market $119,950 Active 3 DOM
-
2026-05-31days on market $119,950 Active 2 DOM
-
2026-05-30remarks 693-char remark
-
2026-05-30$119,950 Active 1 DOM
ⓘ Source: listings_history table (triggers on properties + properties_extension) + one-shot
backfill from property_details.listing_events for pre-trigger history.
Climate risk First Street
- Flood 1/10 Low FEMA zone X (shaded) · 0% chance over 30 yrs
- Wildfire 4/10 Moderate
- Heat 9/10 Extreme 5 d/yr ≥113°F today · 15 d/yr by 30 yrs out
- Wind 1/10 Low
- Air quality 1/10 Low 0 unhealthy d/yr today · 0 by 30 yrs out
Nearby sold comps map
Loading sold comps map…
Walkable amenities ~0.75 mi
Loading nearby amenities…
Taxation est. · year 1
- Rental income
- $16,932
- − Mortgage interest
- −$6,719
- − Property taxes
- −$1,799
- − Insurance
- −$600
- − Repairs & maintenance
- −$1,355
- − Management
- −$1,355
- − Depreciation
- −$3,489
- Taxable income
- $1,616
- Est. tax owed @ 24.0%
- −$388
- After-tax cash flow
- $3,041/yr
For passive investors: Depreciation is non-cash, so a rental often shows a tax loss while cash-flowing — sheltering income. Rental losses are passive: they offset passive income freely, and up to $25,000/yr can offset ordinary (W-2) income if you actively participate and your MAGI is under $100k (phasing out to $0 by $150k); unused losses carry forward. On sale, claimed depreciation is recaptured at up to 25%, and gains may owe capital-gains tax (a 1031 exchange can defer both). Figures are a year-1 estimate at your 24.0% rate — not tax advice; consult a CPA.
Schools (NCES district)
- District
- Yuma Union High School District (4507)
- NCES district ID
- 0409630
- Math proficiency
- 14% ▼ -12.00%
- Reading proficiency
- 16% ▼ -10.00%
- Median HH income
- $40,512
- Composite
- 12.86/100
- National rank
- #9592
- State rank
- #212 of 249 in AZ
Livability — Fortuna Foothills
- Score
- 60/100
- State rank
- #174
- US rank
- #18663
Category grades
Schools grade is shown separately in the Schools card above.
Census & demographics
- Census place
- Fortuna Foothills, AZ
- County
- Yuma County · 149,809 people
- City population
- 21,356
- Metro
- Yuma, AZ
- Population (ZIP)
- 22,074
- Household income
- $58,469
- Rent vs Own
- Severe rent burden
- 408.0
Population outlook (Yuma County) Hauer SSP2
- Today (2025)
- 211,633 people
- By 2030
- 214,114 · +1.2%
- By 2040
- 217,856 · +2.9%
- By 2050
- 220,276 · +4.1%
- By 2075
- 222,359 · +5.1%
- By 2100
- 198,880 · -6.0%
Race, ethnicity, and origin ACS 2023
- Neighborhood character
- Predominantly White (71%)
- Race & ethnicity
- White 71% Hispanic / Latino 22% Two or more races 11% Black 3%
- Hispanic origin (detail)
- Mexican 20%
- Common ancestry
- Portuguese 4% Lithuanian 2% Italian 2%
- Foreign-born
- 10% · Canada
- Languages at home
- 81% English-only · Spanish 16% French/Haitian/Cajun 1% German/W. Germanic 1%
Political lean MEDSL · Yuma
- 2024 margin
- Strong R (+20.4) · D 39.3% · R 59.8%
- 2008→2024 swing
- -6.6pp toward R · 2008: -13.8pp · 2024: -20.4pp
- All cycles
- 2024: R+20.4 2020: R+6.2 2016: R+5.5 2012: R+16.1 2008: R+13.8
Not yet ingested
- Civics
- —
Market trends
- HPI YoY
- ▼ -80.81%
- Current HPI
- 227.2692
- Rent YoY
- ▲ 4.46%
- Metro
- Yuma, AZ
- State GDP YoY
- ▲ 4.54%
- F500 in state
- 20
Industry mix (Fortune 500 HQ in AZ)
| Industry | F500 HQs | Revenue |
|---|---|---|
| Technology | 2 | $13B |
|
||
| Mining / Metals | 1 | $23B |
|
||
| Environmental Services | 1 | $16B |
|
||
| Metals / Steel | 1 | $14B |
|
||
| Technology Distribution | 1 | $9B |
|
||
| Homebuilding | 1 | $8B |
|
||
Price history
+166.6% since first listed3 events — show timeline
- 2026-05-29 Listed $119,950 YAR
- 1998-07-31 Sold (Public Records) $49,100 Public Records
- 1996-03-27 Sold (Public Records) $45,000 Public Records
Property tax history
-11.3%/yrLatest (2025): $132 · +0.2% YoY. Source: county tax records.
Cash-flow waterfall
monthlySold comps — $/sqft
last 12 mo · ≤1 miLoading sold comps…