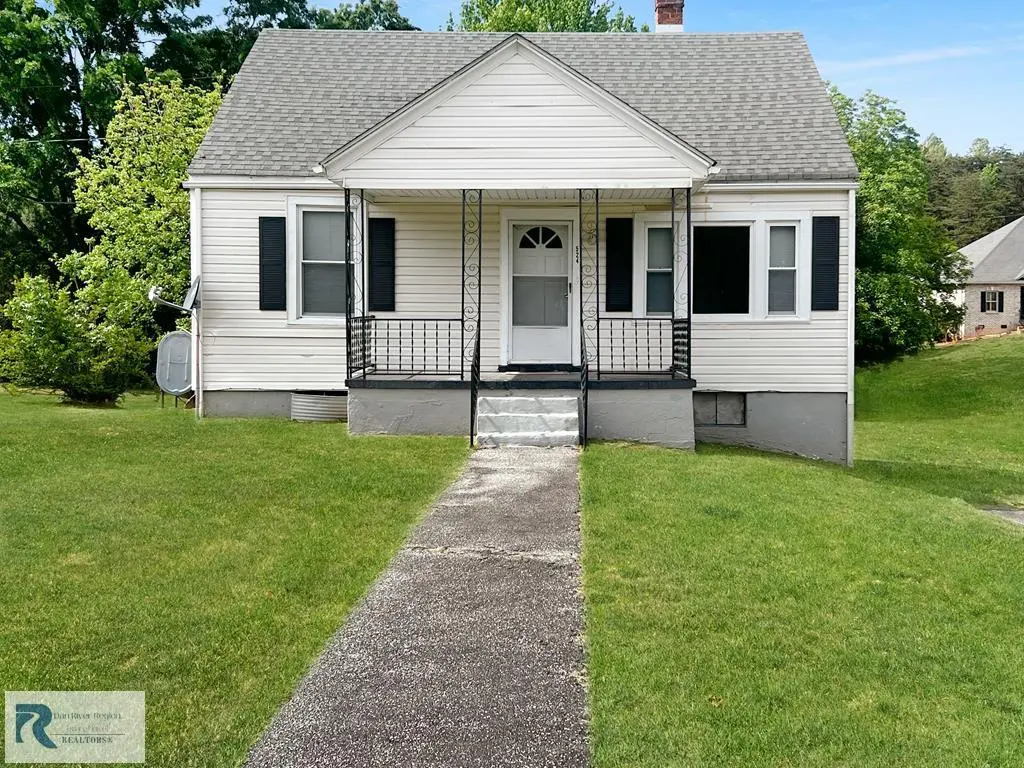
524 Old Mayfield Rd · Danville, VA
Flood risk 1/10 · Minimal
- FEMA flood zone
- X (unshaded)
- Chance of flooding over 30 yrs
- 0.0%
- Est. flood insurance / yr
- $473 – $860
Fire risk 3/10 · Minor
- Est. fire insurance / yr
- $666 – $1,236
Heat risk 6/10 · Moderate
- Hot days now (above 105°F)
- 7 days/yr
- Hot days in 30 yrs
- 19 days/yr
Wind risk 3/10 · Minor
- Chance of severe wind over 30 yrs
- 8.0%
Air-quality risk 3/10 · Minor
- Unhealthy air days now
- 3 days/yr
- Unhealthy air days in 30 yrs
- 3 days/yr
Risk factors via First Street. Map © Google.
Why this score? — see what drove the D+ grade
The composite is a weighted blend of 9 inputs, each scored 0–100. Each bar is that input's sub-score; the figure is the points it added to the 100-point composite (weight × sub-score).
- Cash flow +17.9/30.0
- ARV discount +7.5/15.0
- Schools +6.0/10.0
- DSCR +5.6/10.0
- Livability +3.9/5.0
- 1% rule +3.7/10.0
- Rent growth +2.5/5.0
- Condition / age +2.5/5.0
- Appreciation +0.0/10.0
$139,000
🖨 Deal sheet (PDF) 📄 Offer letter ✓ Due diligence
Listing remarks
Cottage style home with 2 Bedrooms 1 Bath, living room and large eat in kitchen. The laundry is located on the main level in the enclosed porch area. Walk up attic offers lots of storage or potential finished space. The basement has exterior access -it is divided into 3 rooms, there is a bathroom in the basement. This space would need flooring, and bath updates for use. Replacement windows.
Key facts
- 0.42 acre lot
- Built 1949
- Listed 45 days
Property features AI
Finance
- Other: Zoned R-1
Exterior
- Parking: No garage
- Utilities: Private well water; Septic tank sewer
- Home design: Residential property; Single-story living with main-level bedrooms
- Construction: Vinyl siding
- Exterior features: Front porch; Composition roof
Interior
- Kitchen: Electric range; Refrigerator
- Bedrooms: 2 main-level bedrooms
- Flooring: Vinyl flooring
- Bathrooms: 1 full bathroom (main level)
- Heating & cooling: Electric heating (has heating)
- Interior features: Electric range and refrigerator included; Vinyl flooring; Full basement with exterior entry; Total of 4 rooms
- Laundry & utility: Basement access (utility space likely in basement)
Neighborhood map
What this means for you Summary
Snapshot
- This is a 2-bed/1.5-bath single-family listed at $139k.
Deal economics
- At list price, monthly cash flow is $118 ($1k/yr) — positive.
- The deal already cash-flows at list — no discount required.
- To meet the 1% rule (rent ≥ 1% of price), the offer needs to be $121k (13.2% below list).
- Recommended offer: $121k (13.2% below list) — sets the bar for 1% rule.
- Cap rate 7.3% vs local median 5.2% in Danville — top-decile yield for the area; either an underpriced asset or a hidden risk that comps aren't pricing in. Stress-test before assuming the spread holds.
Location & tenants
- Location reads 77/100 on livability (#91 in VA, #2,952 nationally) — a middle-class / working-renter tenant base. Strengths: cost of living A+, housing A+, health & safety A+; Watch: amenities D+, crime D-, commute F.
- Pittsylvania County Public School District (rural): math 65% / reading 78% proficiency, ranked #22 of 131 in VA (top 17%) — strong family-tenant draw, lease renewals of 3-5y typical.
- Zoned schools: Brosville Elementary (math 57% / reading 67%, grade B, #480 of 1,108 statewide, top 46%, 235 students, 82% FRL); Tunstall Middle (math 62% / reading 82%, grade A, #65 of 342 statewide, top 21%, 564 students, 81% FRL); Tunstall High (math 82% / reading 87%, grade A, #23 of 319 statewide, top 8%, 843 students, 80% FRL) — zoned schools average 81% FRL vs 47% district-wide (34 pts higher); higher-poverty schools than district average — tighter screening recommended.
- Market conditions: 249 active listings in the ZIP; 72 units permitted in Pittsylvania County in 2024 (0 in 5+ unit buildings).
Forward outlook
- Local home prices are declining (-3.0%/yr); year-one equity from $961 of loan paydown is wiped out by about $4k of value loss. Plan a longer hold.
- Pittsylvania County population projected at -22% by 2050 — secular population decline; favor cash flow + early exit over multi-decade hold.
Negotiation context
- It's been on market 46 days — a 3% lower offer ($135k) is reasonable based on typical stale-listing flexibility.
Risks & watch-outs
- Watch-outs: built in 1949 — expect roof / HVAC / electrical / plumbing capex.
- Climate carrying-cost: extreme-heat days projected 7→19/yr by 2055 (HVAC capex compounding) — expect insurance premiums to compound above CPI over the hold.
Questions for the listing agent
- It's been on market 46 days. Have you received any prior offers? Is the seller open to a 13% concession, seller financing, or rate buy-down credit?
- Built in 1949 — when were the roof, HVAC, electrical panel, plumbing, and water heater last replaced?
- Is there a deadline driving the sale (1031 exchange, divorce, estate, relocation)? That informs how much negotiation room exists.
- Schools are B-rated — typically a magnet for longer-tenancy family renters. What's the average tenant stay here, and is there a school-zone premium baked into asking?
- Crime grade is D in this area — have there been break-ins, vandalism, or insurance claims at this property in the last 3 years? What carrier currently insures it and at what premium?
- The area grade is low — what's the realistic commute time and amenity access for the typical tenant pool here? Any planned neighborhood developments (good or bad) we should know about?
- What's the average days-on-market for RENTAL listings here right now (not sales)? A rising rental-DOM trend means longer vacancies and softer asking-rent achievability than the comps imply.
- What's the recent tenant-quality profile in this submarket — average credit score on applications, eviction rate, late-payment / NSF rate, and stable-employment percentage? A property-management company in the area should have these aggregated.
- How much new for-sale + rental construction is in the pipeline within 1–3 miles? Heavy new supply typically softens prices + rents 12–24 months out; constrained supply supports both.
Investment metrics
- 1% rule
- 0.87% ✗
- Cap rate
- 7.31%
- Cash-on-cash
- 3.62%
- DSCR
- 1.16
- GRM
- 9.6
CMA / ARV
- ARV (median comp)
- $84,318
- List price
- $139,000
- Delta
- 64.85%
- Verdict
- OVERPRICED
- Comps
- 20 within 1.0 mi
Show comp detail 2 sales within ~0.75 mi
| Address | Dist | Beds/Ba | Sqft | Sold | Price | $/sf | Match |
|---|---|---|---|---|---|---|---|
| 169 Kirkwood Dr | 0.36mi | 3/1.5 (+1) | 1,978 (-13%) | 9mo | $227,500 | $115 | 48 |
| 224 Crestwood Dr | 0.69mi | 3/1.5 (+1) | 2,359 (+4%) | 22mo | $215,000 | $91 | 38 |
Match score weights: distance 35% · size 25% · config 20% · recency 20%. Top-matched comps best support the ARV.
Projected returns pro-forma
-3.0% appreciation · 3.0% rent growth · sell at horizon
- IRR
- -10.7%
- Equity multiple
- 0.61×
- Total profit
- $-15,097
- Equity at exit
- $20,725
- IRR
- -1.4%
- Equity multiple
- 0.90×
- Total profit
- $-3,746
- Equity at exit
- $12,018
Cash invested: $38,920 (down + closing). Projections, not guarantees.
Landlord ↔ Tenant lean methodology
- Overall (STATE)
- 55 Moderately Landlord-Leaning
- State Virginia
- 55 Moderately Landlord-Leaning · D+2
- County
- — inherits STATE
- City
- — inherits STATE
ZIP-level market 24541
- Home prices YoY
- -17.1%
- Active inventory
- 249
- Price-to-rent
- 9.6×
Monthly cashflow live
- Estimated rent
- $1,206 medium interval (Pro) →
- Mortgage (P&I)
- −$729
- Tax from tax record
- −$48 /mo · $580/yr
- Insurance
- −$58
- HOA
- −$0
- Vacancy / Maint / Mgmt
- −$253
- Net cashflow
- $118
Break-even live
Sensitivity live
| Price | -10% $196 | -5% $157 | +0% $118 | +5% $78 | +10% $39 |
|---|---|---|---|---|---|
| Rent | -10% $22 | -5% $70 | +0% $118 | +5% $165 | +10% $213 |
| Rate | -1.0pp $188 | -0.5pp $153 | base $118 | +0.5pp $82 | +1.0pp $45 |
UW: 25.0% down · 7.5% · 30yr · 1.5% tax · 5.0% vac · 8.0% maint · 8.0% mgmt
Financing live
Cash to close
- Down payment
- $34,750
- Closing costs
- $4,170
- Reserves months
- —
- Total cash needed
- —
Loan-product check · same deal, 3 products live
Conventional
25% down · 7.5% · 30yr
- Down + closing
- —
- Monthly P&I
- —
- Monthly cashflow
- —
- DSCR
- —
- Eligible?
- —
Personal DTI + credit; lowest rate.
DSCR
20% down · 8.5% · 30yr
- Down + closing
- —
- Monthly P&I
- —
- Monthly cashflow
- —
- DSCR
- —
- Eligible?
- —
No personal income docs; deal must DSCR.
Hard money
10% down · 12.0% · 12mo
- Down + closing
- —
- Monthly P&I
- —
- Monthly cashflow
- —
- DSCR
- —
- Eligible?
- —
Short-term bridge; refi at stabilization.
Listing history 20 events
-
2026-06-22days on market $139,000 Active 46 DOM
-
2026-06-21days on market $139,000 Active 45 DOM
-
2026-06-19days on market $139,000 Active 43 DOM
-
2026-06-18days on market $139,000 Active 42 DOM
-
2026-06-17days on market $139,000 Active 41 DOM
-
2026-06-16days on market $139,000 Active 40 DOM
-
2026-06-15days on market $139,000 Active 39 DOM
-
2026-06-14days on market $139,000 Active 37 DOM
-
2026-06-13days on market $139,000 Active 36 DOM
-
2026-06-10days on market $139,000 Active 34 DOM
-
2026-06-09days on market $139,000 Active 33 DOM
-
2026-06-09price $139,000 Active 32 DOM
-
2026-06-08days on market $149,000 Active 32 DOM
-
2026-06-07days on market $149,000 Active 31 DOM
-
2026-06-03days on market $149,000 Active 27 DOM
-
2026-06-02days on market $149,000 Active 26 DOM
-
2026-06-01days on market $149,000 Active 25 DOM
-
2026-05-31days on market $149,000 Active 24 DOM
-
2026-05-30days on market $149,000 Active 23 DOM
-
2026-05-07$149,000 Active 393-char remark
ⓘ Source: listings_history table (triggers on properties + properties_extension) + one-shot
backfill from property_details.listing_events for pre-trigger history.
Tax reassessment forecast VA · Resets to sale price
- Current annual tax
- $580 · $48/mo
- Projected year-2 tax
- $1,140 · $95/mo
- Expected delta
- +$560/yr (+$47/mo · 96.6%)
ⓘ Screening estimate from a state-policy table — verify with the county assessor before closing.
Climate risk First Street
- Flood 1/10 Low FEMA zone X (unshaded) · 0% chance over 30 yrs
- Wildfire 3/10 Moderate
- Heat 6/10 Major 7 d/yr ≥105°F today · 19 d/yr by 30 yrs out
- Wind 3/10 Moderate 8% chance of damaging wind over 30 yrs
- Air quality 3/10 Moderate 3 unhealthy d/yr today · 3 by 30 yrs out
Nearby sold comps map
Loading sold comps map…
Walkable amenities ~0.75 mi
Loading nearby amenities…
Taxation est. · year 1
- Rental income
- $14,471
- − Mortgage interest
- −$7,786
- − Property taxes
- −$580
- − Insurance
- −$695
- − Repairs & maintenance
- −$1,158
- − Management
- −$1,158
- − Depreciation
- −$4,044
- Taxable loss
- −$949
- Est. tax savings @ 24.0%
- +$228
- After-tax cash flow
- $1,638/yr
For passive investors: Depreciation is non-cash, so a rental often shows a tax loss while cash-flowing — sheltering income. Rental losses are passive: they offset passive income freely, and up to $25,000/yr can offset ordinary (W-2) income if you actively participate and your MAGI is under $100k (phasing out to $0 by $150k); unused losses carry forward. On sale, claimed depreciation is recaptured at up to 25%, and gains may owe capital-gains tax (a 1031 exchange can defer both). Figures are a year-1 estimate at your 24.0% rate — not tax advice; consult a CPA.
Schools (NCES district)
- District
- Pittsylvania County Public School District
- NCES district ID
- 5102940
- Math proficiency
- 65% ▼ -22.00%
- Reading proficiency
- 78% ▼ -4.00%
- Median HH income
- $41,672
- Composite
- 59.77/100
- National rank
- #900
- State rank
- #22 of 131 in VA
Livability — Danville
- Score
- 77/100
- State rank
- #91
- US rank
- #2952
Category grades
Schools grade is shown separately in the Schools card above.
Census & demographics
- County
- Danville City · 59,055 people
- City population
- 59,055
- Metro
- Danville, VA
- Population (ZIP)
- 28,042
- Household income
- $51,427
- Rent vs Own
- Severe rent burden
- 1399.0
Population outlook (Pittsylvania County) Hauer SSP2
- Today (2025)
- 58,725 people
- By 2030
- 56,388 · -4.0%
- By 2040
- 51,088 · -13.0%
- By 2050
- 45,875 · -21.9%
- By 2075
- 36,555 · -37.8%
- By 2100
- 28,288 · -51.8%
Race, ethnicity, and origin ACS 2023
- Neighborhood character
- Diverse neighborhood (Simpson 0.59)
- Race & ethnicity
- White 50% Black 39% Two or more races 7% Hispanic / Latino 5% Asian 2%
- Common ancestry
- Slovak 2% Serbian 2% Lithuanian 1%
- Foreign-born
- 4% · Canada, Dominican Republic
- Languages at home
- 95% English-only · Spanish 4% Other Indo-European 1%
Political lean MEDSL · Pittsylvania
- 2024 margin
- Solid R (+43.1) · D 28.1% · R 71.3%
- 2008→2024 swing
- -19.1pp toward R · 2008: -24.0pp · 2024: -43.1pp
- All cycles
- 2024: R+43.1 2020: R+39.8 2016: R+39.6 2012: R+27.5 2008: R+24.0
Not yet ingested
- Civics
- —
Market trends
- HPI YoY
- ▼ -49.28%
- Current HPI
- 238.5992
- Rent YoY
- —
- Metro
- Danville, VA
- State GDP YoY
- ▲ 2.40%
- F500 in state
- 50
Industry mix (Fortune 500 HQ in VA)
| Industry | F500 HQs | Revenue |
|---|---|---|
| Aerospace / Defense | 4 | $236B |
|
||
| Technology / Defense | 3 | $32B |
|
||
| Financial Services | 2 | $176B |
|
||
| Utilities | 2 | $27B |
|
||
| Insurance | 2 | $25B |
|
||
| Technology | 2 | $15B |
|
||
Price history
-6.7% since first listed2 events — show timeline
- 2026-06-08 Price Changed $139,000 DRRAR
- 2026-05-07 Listed $149,000 DRRAR
Property tax history
+6.5%/yrLatest (2026): $580 · +10.7% YoY. Source: county tax records.
Cash-flow waterfall
monthlySold comps — $/sqft
last 12 mo · ≤1 miLoading sold comps…