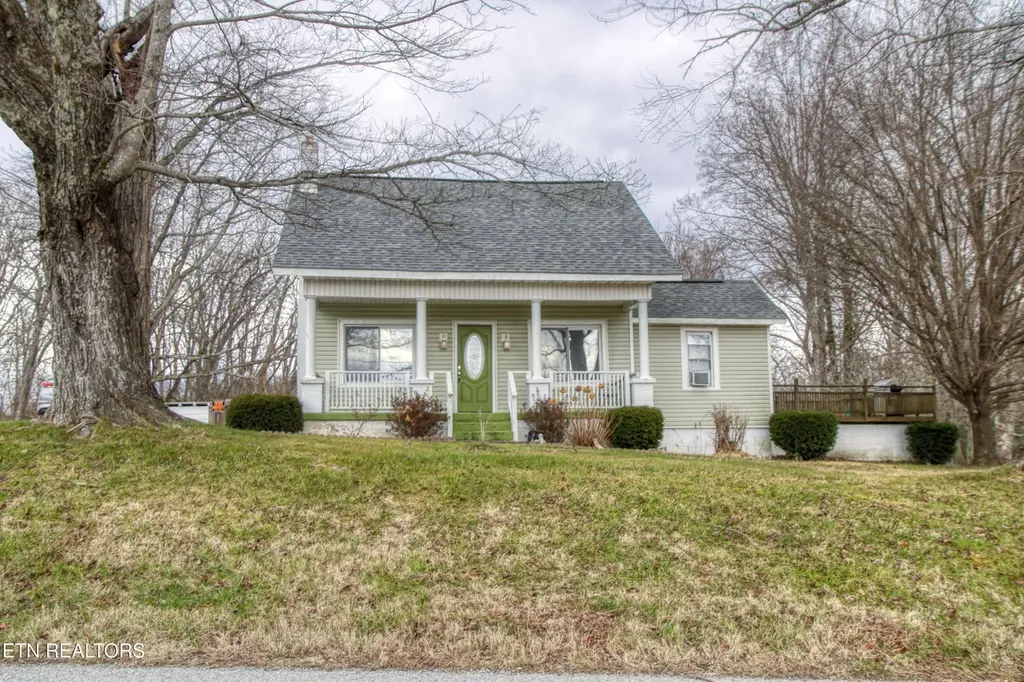
124 Whited Ave · Jamestown, TN
Flood risk 1/10 · Minimal
- FEMA flood zone
- X (unshaded)
- Chance of flooding over 30 yrs
- 0.0%
- Est. flood insurance / yr
- $473 – $860
Fire risk 6/10 · Moderate
- Est. fire insurance / yr
- $949 – $1,763
Heat risk 3/10 · Minor
- Hot days now (above 101°F)
- 7 days/yr
- Hot days in 30 yrs
- 20 days/yr
Wind risk 3/10 · Minor
- Chance of severe wind over 30 yrs
- 5.0%
Air-quality risk 2/10 · Minimal
- Unhealthy air days now
- 2 days/yr
- Unhealthy air days in 30 yrs
- 2 days/yr
Risk factors via First Street. Map © Google.
Why this score? — see what drove the D+ grade
The composite is a weighted blend of 9 inputs, each scored 0–100. Each bar is that input's sub-score; the figure is the points it added to the 100-point composite (weight × sub-score).
- Cash flow +10.5/30.0
- Appreciation +10.0/10.0
- ARV discount +9.5/15.0
- 1% rule +3.1/10.0
- Livability +3.1/5.0
- DSCR +3.0/10.0
- Rent growth +2.5/5.0
- Condition / age +2.5/5.0
- Schools +2.1/10.0
$150,000
🖨 Deal sheet (PDF) 📄 Offer letter ✓ Due diligence
Listing remarks MLS
This charming 3-bedroom, 1-bath home is nestled within the city limits, yet offers peaceful private feel. Situated on a level to rolling acre, property provides the perfect balance of convenience and tranquility with easy access to everything you need. The home features a spacious living room, a master bedroom on the main floor, and a large kitchen with a bar. There's also a dining area, an office space, or potential 4th bedroom. Upstairs, you'll find two additional bedrooms. The property includes a 1-bedroom 1-bath tiny home, a storage building, and boasts a large deck ideal for grilling and enjoying outdoor fireplace. Sold As Is, Where Is.
Key facts
- Office space
- Storage building
- Dining area
Tags
Neighborhood map
What this means for you Summary
Snapshot
- This is a 3-bed/1.0-bath single-family listed at $150k.
Deal economics
- At list price, monthly cash flow is $-78 ($-931/yr) — negative.
- To cash-flow at today's rent, offer at most $139k (7.5% below list).
- To meet the 1% rule (rent ≥ 1% of price), the offer needs to be $121k (19.1% below list).
- Recommended offer: $121k (19.1% below list) — sets the bar for 1% rule.
- Cap rate 5.7% vs local median 4.6% in Jamestown — meaningfully above typical; check what's discounted (condition, days-on-market, listing class) to confirm the premium yield is real.
Location & tenants
- Location reads 61/100 on livability (#250 in TN) — a middle-class / working-renter tenant base. Strengths: cost of living A+, health & safety A+; Watch: housing D, schools F, crime F.
- Fentress County (rural): math 24% / reading 27% proficiency, ranked #91 of 139 in TN (top 66%) — low school quality limits family demand, transient renter base, plan for 1-2y turnover; 65% free/reduced lunch — lower-income household profile, screen leases tightly.
- Market conditions: 325 active listings in the ZIP.
Forward outlook
- In year one you build about $16k of equity ($1k loan paydown + $15k appreciation (10.0% local appreciation)).
- Fentress County population projected at -19% by 2050 — secular population decline; favor cash flow + early exit over multi-decade hold.
- At projected returns (10.0% appreciation + 3.0% rent growth), your $42k cash investment doubles in ~3 years — after that, you're playing with house money.
- By year 3, paydown + projected appreciation supports a ~$41k cash-out refi (75% LTV) — recoverable capital for the next deal without selling this one.
Negotiation context
- It's been on market 113 days — a 9% lower offer ($136k) is reasonable based on typical stale-listing flexibility.
- 4 sale attempts since 4y ago with the ask held roughly flat each time — persistent listings suggest the price (not the market) is what's stuck; bring a comps-based counter.
- Current owner paid $130k; 15% above their basis — modest negotiation headroom, anchor on the comps not their cost.
Risks & watch-outs
- Watch-outs: built in 1930 — expect roof / HVAC / electrical / plumbing capex.
- Climate carrying-cost: major wildfire risk — expect insurance premiums to compound above CPI over the hold.
Questions for the listing agent
- What do current leases actually rent for vs. the listed asking? Can we see a recent rent roll and the last 12 months of T-12 income?
- It's been on market 113 days. Have you received any prior offers? Is the seller open to a 19% concession, seller financing, or rate buy-down credit?
- Built in 1930 — when were the roof, HVAC, electrical panel, plumbing, and water heater last replaced?
- Why hasn't it sold? Are there any deal-killer items the seller is aware of (foundation, flood, title, zoning, code violations)?
- Is there a deadline driving the sale (1031 exchange, divorce, estate, relocation)? That informs how much negotiation room exists.
- Schools are F-rated, which usually means shorter tenancies and higher turnover. Who's the typical renter profile here, and what's been the actual vacancy rate?
- Crime grade is F in this area — have there been break-ins, vandalism, or insurance claims at this property in the last 3 years? What carrier currently insures it and at what premium?
- The area grade is low — what's the realistic commute time and amenity access for the typical tenant pool here? Any planned neighborhood developments (good or bad) we should know about?
- What's the average days-on-market for RENTAL listings here right now (not sales)? A rising rental-DOM trend means longer vacancies and softer asking-rent achievability than the comps imply.
- What's the recent tenant-quality profile in this submarket — average credit score on applications, eviction rate, late-payment / NSF rate, and stable-employment percentage? A property-management company in the area should have these aggregated.
- How much new for-sale + rental construction is in the pipeline within 1–3 miles? Heavy new supply typically softens prices + rents 12–24 months out; constrained supply supports both.
Investment metrics
- 1% rule
- 0.81% ✗
- Cap rate
- 5.67%
- Cash-on-cash
- -2.22%
- DSCR
- 0.90
- GRM
- 10.3
CMA / ARV
- ARV (median comp)
- $157,041
- List price
- $150,000
- Delta
- -4.48%
- Verdict
- FAIR
- Comps
- 17 within 1.0 mi
Projected returns pro-forma
10.0% appreciation · 3.0% rent growth · sell at horizon
- IRR
- 22.7%
- Equity multiple
- 2.83×
- Total profit
- $76,769
- Equity at exit
- $135,132
- IRR
- 20.3%
- Equity multiple
- 6.48×
- Total profit
- $229,996
- Equity at exit
- $291,417
Cash invested: $42,000 (down + closing). Projections, not guarantees.
Landlord ↔ Tenant lean methodology
- Overall (STATE)
- 87 Strongly Landlord-Friendly
- State Tennessee
- 87 Strongly Landlord-Friendly · R+13
- County
- — inherits STATE
- City
- — inherits STATE
ZIP-level market 38556
- Home prices YoY
- 13.5%
- Active inventory
- 325
- Price-to-rent
- 10.3×
Monthly cashflow live
- Estimated rent
- $1,214 medium interval (Pro) →
- Mortgage (P&I)
- −$787
- Tax est. 1.5%
- −$188 /mo · $2,250/yr
- Insurance
- −$62
- HOA
- −$0
- Vacancy / Maint / Mgmt
- −$255
- Net cashflow
- $-78
Break-even live
Sensitivity live
| Price | -10% $26 | -5% $-26 | +0% $-78 | +5% $-129 | +10% $-181 |
|---|---|---|---|---|---|
| Rent | -10% $-174 | -5% $-126 | +0% $-78 | +5% $-30 | +10% $18 |
| Rate | -1.0pp $-2 | -0.5pp $-39 | base $-78 | +0.5pp $-116 | +1.0pp $-156 |
UW: 25.0% down · 7.5% · 30yr · 1.5% tax · 5.0% vac · 8.0% maint · 8.0% mgmt
Financing live
Cash to close
- Down payment
- $37,500
- Closing costs
- $4,500
- Reserves months
- —
- Total cash needed
- —
Loan-product check · same deal, 3 products live
Conventional
25% down · 7.5% · 30yr
- Down + closing
- —
- Monthly P&I
- —
- Monthly cashflow
- —
- DSCR
- —
- Eligible?
- —
Personal DTI + credit; lowest rate.
DSCR
20% down · 8.5% · 30yr
- Down + closing
- —
- Monthly P&I
- —
- Monthly cashflow
- —
- DSCR
- —
- Eligible?
- —
No personal income docs; deal must DSCR.
Hard money
10% down · 12.0% · 12mo
- Down + closing
- —
- Monthly P&I
- —
- Monthly cashflow
- —
- DSCR
- —
- Eligible?
- —
Short-term bridge; refi at stabilization.
Listing history 26 events
-
2026-06-21days on market $150,000 Active 113 DOM
-
2026-06-18days on market $150,000 Active 111 DOM
-
2026-06-17days on market $150,000 Active 110 DOM
-
2026-06-16days on market $150,000 Active 109 DOM
-
2026-06-15days on market $150,000 Active 108 DOM
-
2026-06-13days on market $150,000 Active 106 DOM
-
2026-06-12days on market $150,000 Active 105 DOM
-
2026-06-09days on market $150,000 Active 102 DOM
-
2026-06-08days on market $150,000 Active 101 DOM
-
2026-06-08days on market $150,000 Active 100 DOM
-
2026-06-07days on market $150,000 Active 99 DOM
-
2026-06-03days on market $150,000 Active 96 DOM
-
2026-06-02days on market $150,000 Active 95 DOM
-
2026-06-01days on market $150,000 Active 94 DOM
-
2026-05-31days on market $150,000 Active 93 DOM
-
2026-02-27$150,000 Active 649-char remark
Show marketing remark (649 chars)
This charming 3-bedroom, 1-bath home is nestled within the city limits, yet offers peaceful private feel. Situated on a level to rolling acre, property provides the perfect balance of convenience and tranquility with easy access to everything you need. The home features a spacious living room, a master bedroom on the main floor, and a large kitchen with a bar. There's also a dining area, an office space, or potential 4th bedroom. Upstairs, you'll find two additional bedrooms. The property includes a 1-bedroom 1-bath tiny home, a storage building, and boasts a large deck ideal for grilling and enjoying outdoor fireplace. Sold As Is, Where Is.
-
2025-07-30historical
-
2025-05-22price $155,000
-
2025-04-29price $165,000
-
2025-01-05$170,000 Active
-
2022-06-23soldstatus $129,900 Closed
-
2022-06-23soldstatus $129,900
-
2022-06-23soldstatus $129,900
-
2022-04-13historical Pending - Continue to Show - Financing
-
2022-04-07$129,900 Active
-
2022-04-07$129,900
ⓘ Source: listings_history table (triggers on properties + properties_extension) + one-shot
backfill from property_details.listing_events for pre-trigger history.
Climate risk First Street
- Flood 1/10 Low FEMA zone X (unshaded) · 0% chance over 30 yrs
- Wildfire 6/10 Major
- Heat 3/10 Moderate 7 d/yr ≥101°F today · 20 d/yr by 30 yrs out
- Wind 3/10 Moderate 5% chance of damaging wind over 30 yrs
- Air quality 2/10 Low 2 unhealthy d/yr today · 2 by 30 yrs out
Nearby sold comps map
Loading sold comps map…
Walkable amenities ~0.75 mi
Loading nearby amenities…
Taxation est. · year 1
- Rental income
- $14,567
- − Mortgage interest
- −$8,402
- − Property taxes
- −$2,250
- − Insurance
- −$750
- − Repairs & maintenance
- −$1,165
- − Management
- −$1,165
- − Depreciation
- −$4,364
- Taxable loss
- −$3,530
- Est. tax savings @ 24.0%
- +$847
- After-tax cash flow
- $-84/yr
For passive investors: Depreciation is non-cash, so a rental often shows a tax loss while cash-flowing — sheltering income. Rental losses are passive: they offset passive income freely, and up to $25,000/yr can offset ordinary (W-2) income if you actively participate and your MAGI is under $100k (phasing out to $0 by $150k); unused losses carry forward. On sale, claimed depreciation is recaptured at up to 25%, and gains may owe capital-gains tax (a 1031 exchange can defer both). Figures are a year-1 estimate at your 24.0% rate — not tax advice; consult a CPA.
Schools (NCES district)
- District
- Fentress County
- NCES district ID
- 4701230
- Math proficiency
- 24% ▼ -13.00%
- Reading proficiency
- 27% ▼ -8.00%
- Median HH income
- $30,419
- Composite
- 20.6/100
- National rank
- #8552
- State rank
- #91 of 139 in TN
Livability — Jamestown
- Score
- 61/100
- State rank
- #250
- US rank
- #17976
Category grades
Schools grade is shown separately in the Schools card above.
Census & demographics
- Census place
- Jamestown, TN
- Population (ZIP)
- 12,531
Population outlook (Fentress County) Hauer SSP2
- Today (2025)
- 17,295 people
- By 2030
- 16,749 · -3.2%
- By 2040
- 15,443 · -10.7%
- By 2050
- 14,077 · -18.6%
- By 2075
- 11,482 · -33.6%
- By 2100
- 9,658 · -44.2%
Race, ethnicity, and origin ACS 2023
- Neighborhood character
- Predominantly White (96%)
- Race & ethnicity
- White 96% Two or more races 3% Hispanic / Latino 1%
- Common ancestry
- Serbian 3% Lithuanian 2% Iranian 1%
- Foreign-born
- 1% · Canada
- Languages at home
- 99% English-only · Spanish 1%
Political lean MEDSL · Fentress
- 2024 margin
- Solid R (+75.8) · D 11.8% · R 87.6%
- 2008→2024 swing
- -31.9pp toward R · 2008: -43.9pp · 2024: -75.8pp
- All cycles
- 2024: R+75.8 2020: R+71.3 2016: R+67.5 2012: R+53.4 2008: R+43.9
Not yet ingested
- Civics
- —
Market trends
- HPI YoY
- ▲ 44.31%
- Current HPI
- 372.5676
- Rent YoY
- —
- Metro
- —
- State GDP YoY
- ▲ 2.78%
- F500 in state
- 22
Industry mix (Fortune 500 HQ in TN)
| Industry | F500 HQs | Revenue |
|---|---|---|
| Healthcare | 3 | $91B |
|
||
| Retail | 3 | $72B |
|
||
| Transportation / Logistics | 1 | $88B |
|
||
| Paper / Packaging | 1 | $19B |
|
||
| Insurance | 1 | $13B |
|
||
| Energy | 1 | $12B |
|
||
Price history
+15.5% since first listed11 events — show timeline
- 2026-02-27 Listed $150,000 Knoxville MLS
- 2025-07-30 Listing Removed — Knoxville MLS
- 2025-05-22 Price Changed $155,000 Knoxville MLS
- 2025-04-29 Price Changed $165,000 Knoxville MLS
- 2025-01-05 Listed $170,000 Knoxville MLS
- 2022-06-23 Sold (MLS) $129,900 REALTRACS as Distributed by MLS Grid
- 2022-06-23 Sold (MLS) $129,900 UCMLS
- 2022-06-23 Sold (MLS) $129,900 Knoxville MLS
- 2022-04-13 Contingent — Knoxville MLS
- 2022-04-07 Listed $129,900 UCMLS
- 2022-04-07 Listed $129,900 Knoxville MLS
Property tax history
+2.8%/yrLatest (2019): $153 · +0.0% YoY. Source: county tax records.
Cash-flow waterfall
monthlySold comps — $/sqft
last 12 mo · ≤1 miLoading sold comps…