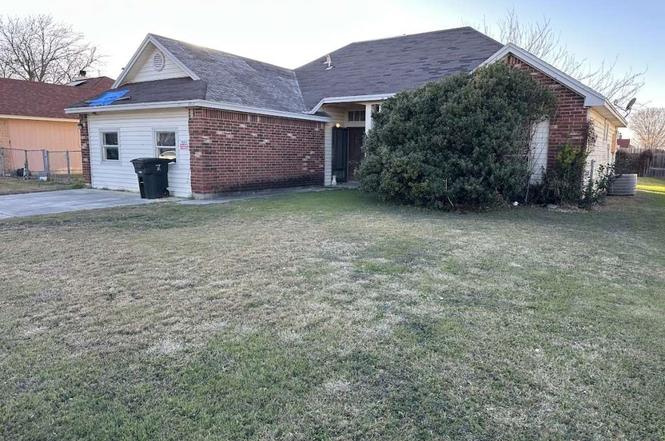
2703 Starling Dr · Killeen, TX
Flood risk 1/10 · Minimal
- FEMA flood zone
- X (unshaded)
- Chance of flooding over 30 yrs
- 0.0%
- Est. flood insurance / yr
- $507 – $1,088
Fire risk 2/10 · Minimal
- Est. fire insurance / yr
- $1,222 – $2,270
Heat risk 8/10 · Major
- Hot days now (above 107°F)
- 7 days/yr
- Hot days in 30 yrs
- 24 days/yr
Wind risk 6/10 · Moderate
- Chance of severe wind over 30 yrs
- 56.0%
Air-quality risk 1/10 · Minimal
- Unhealthy air days now
- 0 days/yr
- Unhealthy air days in 30 yrs
- 0 days/yr
Risk factors via First Street. Map © Google.
Why this score? — see what drove the B- grade
The composite is a weighted blend of 9 inputs, each scored 0–100. Each bar is that input's sub-score; the figure is the points it added to the 100-point composite (weight × sub-score).
- Cash flow +30.0/30.0
- 1% rule +10.0/10.0
- DSCR +10.0/10.0
- ARV discount +7.5/15.0
- Livability +3.2/5.0
- Schools +3.0/10.0
- Rent growth +2.8/5.0
- Condition / age +2.5/5.0
- Appreciation +0.0/10.0
$99,999
🖨 Deal sheet (PDF) 📄 Offer letter ✓ Due diligence
Listing remarks
JUST LISTED! Discover the potential in this spacious 5-bedroom, 2-bath home located at 2703 Starling Drive in Killeen, Texas. This property is perfect for investors, flippers, or buyers looking to customize a home to their own style. With plenty of room to grow, the layout offers generous living space and a flexible floor plan ideal for large households or rental opportunities. The home does have a NEW ROOF but will still need some work. It is a great value-add opportunity for those ready to bring their vision to life. Whether you're looking to renovate and resell or create your dream home, this property has solid potential. WE MAKE IT EASY TO OWN. This is a great opportunity! Don't wait,
Key facts
- Flexible floor plan
- New roof
- 6,442 sq ft lot
Tags
Property features AI
Exterior
- Utilities: Public water; Public sewer
- Home design: Residential property; Single-story home (all listed rooms on first floor); Built in 1989; Slab foundation
- Construction: Built in 1989; Slab foundation
- Exterior features: Lot features described as 'Other'
Interior
- Bedrooms: Primary bedroom on first floor (approx. 12x14); Bedroom on first floor (approx. 11x13); Bedroom on first floor (approx. 11x12); Bedroom on first floor (approx. 10x10); Bedroom on first floor (approx. 9x9)
- Bathrooms: Two full bathrooms
- Interior features: One fireplace; Five total rooms
Neighborhood map
What this means for you Summary
Snapshot
- This is a 5-bed/2.0-bath single-family listed at $100k.
Deal economics
- At list price, monthly cash flow is $504 ($6k/yr) — positive.
- The deal already cash-flows at list — no discount required.
- Meets the 1% rule at list price ($2k rent vs $100k).
- Cap rate 12.3% vs local median 3.9% in Killeen — top-decile yield for the area; either an underpriced asset or a hidden risk that comps aren't pricing in. Stress-test before assuming the spread holds.
Location & tenants
- Location reads 63/100 on livability (#853 in TX) — a middle-class / working-renter tenant base. Strengths: cost of living A+, housing A+; Watch: amenities D, employment D, crime D-.
- Killeen ISD (urban): math 31% / reading 38% proficiency, ranked #524 of 826 in TX (top 63%) — families likely to look elsewhere, expect single-tenant / working-renter base with shorter leases.
- Zoned schools: Live Oak Ridge Middle (math 25% / reading 33%, grade F, #1,103 of 1,662 statewide, top 67%, 729 students, 74% FRL); C E Ellison H S (math 20% / reading 51%, grade F, #941 of 1,632 statewide, top 58%, 1,682 students, 57% FRL) — zoned schools average 65% FRL vs 47% district-wide (18 pts higher); higher-poverty schools than district average — tighter screening recommended.
- Market conditions: Rents rising (+1.1%/yr); 429 active listings in the ZIP; 40 comparable units currently listed for rent nearby; rentals at typical pace (median 25d on market — plan ~3-4 weeks tenant-placement turnaround); 45% of comp listings sitting > 30 days — soft ceiling on asking rent; 3,222 units permitted in Bell County in 2024 (246 in 5+ unit buildings).
Forward outlook
- Local home prices are declining (-3.0%/yr); year-one equity from $691 of loan paydown is wiped out by about $3k of value loss. Plan a longer hold.
- Bell County population projected at +21% by 2050 — long-run rental-demand tailwind backs the buy-and-hold thesis.
- At projected returns (-3.0% appreciation + 1.1% rent growth), your $28k cash investment doubles in ~7 years — after that, you're playing with house money.
Negotiation context
- Only 1 days on market — expect competitive offers; lowballing is unlikely to land.
- 3 sale attempts since 20y ago with the ask held roughly flat each time — persistent listings suggest the price (not the market) is what's stuck; bring a comps-based counter.
Risks & watch-outs
- Watch-outs: property tax is 3.6% of price.
- Climate carrying-cost: major wind risk, 56% chance of damaging wind over 30y; extreme-heat days projected 7→24/yr by 2055 (HVAC capex compounding) — expect insurance premiums to compound above CPI over the hold.
Questions for the listing agent
- Property tax is high relative to price — has the assessment been appealed recently, and will the sale trigger a re-assessment?
- Is there a deadline driving the sale (1031 exchange, divorce, estate, relocation)? That informs how much negotiation room exists.
- Schools are D-rated, which usually means shorter tenancies and higher turnover. Who's the typical renter profile here, and what's been the actual vacancy rate?
- Crime grade is D in this area — have there been break-ins, vandalism, or insurance claims at this property in the last 3 years? What carrier currently insures it and at what premium?
- What's the average days-on-market for RENTAL listings here right now (not sales)? A rising rental-DOM trend means longer vacancies and softer asking-rent achievability than the comps imply.
- What's the recent tenant-quality profile in this submarket — average credit score on applications, eviction rate, late-payment / NSF rate, and stable-employment percentage? A property-management company in the area should have these aggregated.
- How much new for-sale + rental construction is in the pipeline within 1–3 miles? Heavy new supply typically softens prices + rents 12–24 months out; constrained supply supports both.
Investment metrics
- 1% rule
- 1.74% ✓
- Cap rate
- 12.34%
- Cash-on-cash
- 21.58%
- DSCR
- 1.96
- GRM
- 4.8
CMA / ARV
- ARV (on-the-fly)
- $216,812
- Comps found
- 11
Show comp detail 11 sales within ~0.75 mi
| Address | Dist | Beds/Ba | Sqft | Sold | Price | $/sf | Match |
|---|---|---|---|---|---|---|---|
| 2501 Westwood Dr | 0.21mi | 4/2.0 (-1) | 1,668 (+3%) | 4mo | $208,000 | $125 | 76 |
| 3802 Frigate Dr | 0.62mi | 4/2.0 (-1) | 1,571 (-3%) | 2mo | $210,000 | $134 | 59 |
| 3010 Westrim Dr | 0.34mi | 4/2.0 (-1) | 1,442 (-11%) | 5mo | $199,900 | $139 | 57 |
| 3106 Tom Lockett Dr | 0.74mi | 4/2.0 (-1) | 1,619 (+0%) | 6mo | $237,500 | $147 | 55 |
| 4200 Maid Marian Cir | 0.49mi | 4/2.0 (-1) | 1,769 (+9%) | 4mo | $241,000 | $136 | 53 |
| 3308 Regency Dr | 0.41mi | 4/2.5 (-1) | 1,679 (+4%) | 19mo | $190,000 | $113 | 52 |
| 3301 Driftwood Dr | 0.62mi | 5/2.0 | 1,755 (+8%) | 6mo | $240,000 | $137 | 52 |
| 3707 Frigate Dr | 0.56mi | 4/2.0 (-1) | 1,749 (+8%) | 5mo | $228,000 | $130 | 52 |
| 3805 Stallion Dr | 0.65mi | 4/2.0 (-1) | 1,799 (+11%) | 3mo | $225,000 | $125 | 44 |
| 3004 Tallwood Dr | 0.47mi | 4/2.0 (-1) | 1,412 (-13%) | 9mo | $224,900 | $159 | 44 |
| 3305 Johnson Dr | 0.70mi | 4/2.0 (-1) | 1,860 (+15%) | 4mo | $230,000 | $124 | 35 |
Match score weights: distance 35% · size 25% · config 20% · recency 20%. Top-matched comps best support the ARV.
Projected returns pro-forma
-3.0% appreciation · 1.14% rent growth · sell at horizon
- IRR
- 11.8%
- Equity multiple
- 1.46×
- Total profit
- $12,810
- Equity at exit
- $14,910
- IRR
- 19.1%
- Equity multiple
- 2.44×
- Total profit
- $40,377
- Equity at exit
- $8,646
Cash invested: $28,000 (down + closing). Projections, not guarantees.
Landlord ↔ Tenant lean methodology
- Overall (STATE)
- 87 Strongly Landlord-Friendly
- State Texas
- 87 Strongly Landlord-Friendly · R+5
- County
- — inherits STATE
- City
- — inherits STATE
ZIP-level market 76549
- Home prices YoY
- -12.6%
- Rents YoY
- 1.1%
- Active inventory
- 429
- Price-to-rent
- 4.8×
Monthly cashflow live
- Estimated rent
- $1,739 high interval (Pro) →
- Mortgage (P&I)
- −$524
- Tax from tax record
- −$304 /mo · $3,649/yr
- Insurance
- −$42
- HOA
- −$0
- Vacancy / Maint / Mgmt
- −$365
- Net cashflow
- $504
Break-even live
Sensitivity live
| Price | -10% $560 | -5% $532 | +0% $504 | +5% $475 | +10% $447 |
|---|---|---|---|---|---|
| Rent | -10% $366 | -5% $435 | +0% $504 | +5% $572 | +10% $641 |
| Rate | -1.0pp $554 | -0.5pp $529 | base $504 | +0.5pp $478 | +1.0pp $451 |
UW: 25.0% down · 7.5% · 30yr · 1.5% tax · 5.0% vac · 8.0% maint · 8.0% mgmt
Financing live
Cash to close
- Down payment
- $25,000
- Closing costs
- $3,000
- Reserves months
- —
- Total cash needed
- —
Loan-product check · same deal, 3 products live
Conventional
25% down · 7.5% · 30yr
- Down + closing
- —
- Monthly P&I
- —
- Monthly cashflow
- —
- DSCR
- —
- Eligible?
- —
Personal DTI + credit; lowest rate.
DSCR
20% down · 8.5% · 30yr
- Down + closing
- —
- Monthly P&I
- —
- Monthly cashflow
- —
- DSCR
- —
- Eligible?
- —
No personal income docs; deal must DSCR.
Hard money
10% down · 12.0% · 12mo
- Down + closing
- —
- Monthly P&I
- —
- Monthly cashflow
- —
- DSCR
- —
- Eligible?
- —
Short-term bridge; refi at stabilization.
Rent comps 40 comps
| Address | Beds | Baths | Sqft | Rent | $/sqft | DOM | Units | Dist |
|---|---|---|---|---|---|---|---|---|
| 2504 Bluejay Dr Killeen, TX | 4.0 | 2.0 | 1750 | $1,475 | $0.84 | 24d | 1 | 0.18mi |
| 2405 Westwood Dr Killeen, TX | 4.0 | 2.0 | 1668 | $1,550 | $0.93 | 44d | 1 | 0.22mi |
| 3304 Regency Ct Killeen, TX | 4.0 | 2.0 | 1728 | $1,645 | $0.95 | 14d | 1 | 0.41mi |
| 2602 Bigleaf Dr Killeen, TX | 4.0 | 2.0 | 1948 | $1,750 | $0.90 | 44d | 1 | 0.42mi |
| 3406 Thunder Creek Dr Killeen, TX | 4.0 | 2.5 | 1885 | $1,595 | $0.85 | 24d | 1 | 0.45mi |
| 1701 Lennox Ave Killeen, TX | 5.0 | 2.0 | 1858 | $1,450 | $0.78 | 44d | 1 | 0.62mi |
| 3201 Tom Lockett Dr Killeen, TX | 4.0 | 2.0 | 1698 | $1,645 | $0.97 | 44d | 1 | 0.69mi |
| 3011 Tom Lockett Dr Killeen, TX | 4.0 | 2.0 | 1592 | $1,650 | $1.04 | 44d | 1 | 0.71mi |
| 3903 Tiger Dr Killeen, TX | 4.0 | 2.0 | 1843 | $1,595 | $0.87 | 24d | 1 | 0.72mi |
| 1415 Circletree Loop Killeen, TX | 4.0 | 2.0 | 1440 | $1,350 | $0.94 | 44d | 1 | 0.74mi |
| 2201 Rainforest Ln Killeen, TX | 4.0 | 2.0 | 1697 | $1,695 | $1.00 | 44d | 1 | 0.77mi |
| 1818 Janis Dr Killeen, TX | 4.0 | 2.0 | 1781 | $1,450 | $0.81 | 24d | 1 | 0.79mi |
| 3610 Del Mar Ct Killeen, TX | 4.0 | 2.0 | 1657 | $1,650 | $1.00 | 24d | 1 | 0.82mi |
| 3507 Doffy Dr Killeen, TX | 4.0 | 2.0 | 1471 | $1,695 | $1.15 | 14d | 1 | 0.84mi |
| 4004 Bull Run Dr Killeen, TX | 4.0 | 2.0 | 2099 | $1,900 | $0.91 | 44d | 1 | 0.87mi |
| 4004 Bull Run Dr Killeen, TX | 4.0 | 2.0 | 2099 | $1,900 | $0.91 | 24d | 1 | 0.87mi |
| 3401 Lorena Dr Killeen, TX | 4.0 | 3.0 | 2032 | $1,645 | $0.81 | 14d | 1 | 0.87mi |
| 3401 Lorena Dr Killeen, TX | 4.0 | 2.5 | 2032 | $1,645 | $0.81 | 24d | 1 | 0.87mi |
| 3804 Captain Dr Killeen, TX | 4.0 | 2.0 | 1705 | $1,495 | $0.88 | 44d | 1 | 0.90mi |
| 1820 Gaynor Dr Killeen, TX | 4.0 | 2.0 | 1288 | $1,600 | $1.24 | 44d | 1 | 0.90mi |
| 2811 Maria Dr Killeen, TX | 4.0 | 2.0 | 1600 | $1,400 | $0.88 | 24d | 1 | 0.91mi |
| 2909 Maria Dr Killeen, TX | 4.0 | 2.0 | 1688 | $1,700 | $1.01 | 24d | 1 | 0.92mi |
| 1507 Nina Dr Killeen, TX | 4.0 | 2.0 | 1346 | $1,650 | $1.23 | 44d | 1 | 0.95mi |
| 3909 Bolivar Dr Killeen, TX | 4.0 | 2.5 | 2032 | $1,695 | $0.83 | 24d | 1 | 0.96mi |
| 4004 Riverrock Dr Killeen, TX | 4.0 | 2.0 | 1398 | $1,395 | $1.00 | 24d | 1 | 0.98mi |
| 4300 Secretariat Dr Killeen, TX | 4.0 | 2.0 | 1679 | $2,165 | $1.29 | 44d | 1 | 1.00mi |
| 4306 Secretariat Dr Killeen, TX | 4.0 | 2.0 | 1586 | $1,650 | $1.04 | 14d | 1 | 1.04mi |
| 1204 Alta Vista Dr Killeen, TX | 4.0 | 2.0 | 1624 | $1,450 | $0.89 | 44d | 1 | 1.04mi |
| 4203 Lonesome Dove Dr Killeen, TX | 4.0 | 2.0 | 1505 | $1,475 | $0.98 | 24d | 1 | 1.05mi |
| 3404 Granite Dr Killeen, TX | 4.0 | 2.0 | 1580 | $1,595 | $1.01 | 24d | 1 | 1.06mi |
| 2806 Greystone Dr Killeen, TX | 4.0 | 2.0 | 1778 | $1,465 | $0.82 | 44d | 1 | 1.09mi |
| 4202 Jake Spoon Dr Killeen, TX | 4.0 | 2.0 | 1609 | $1,599 | $0.99 | 44d | 1 | 1.12mi |
| 4403 Tidal Wave Dr Killeen, TX | 4.0 | 2.0 | 1567 | $1,495 | $0.95 | 24d | 1 | 1.14mi |
| 3903 Bade Dr Killeen, TX | 4.0 | 2.0 | 1750 | $1,650 | $0.94 | 44d | 1 | 1.17mi |
| 1303 August Dr Killeen, TX | 4.0 | 2.0 | 1460 | $1,475 | $1.01 | 24d | 1 | 1.18mi |
| 1206 Bonner Dr Killeen, TX | 4.0 | 1.0 | 1248 | $1,245 | $1.00 | 14d | 1 | 1.20mi |
| 4600 Greyhound Dr Killeen, TX | 4.0 | 2.0 | 1532 | $1,450 | $0.95 | 24d | 1 | 1.20mi |
| 2202 Amethyst Dr Killeen, TX | 4.0 | 2.0 | 1699 | $1,500 | $0.88 | 44d | 1 | 1.23mi |
| 4501 Pete Dr Killeen, TX | 4.0 | 2.0 | 1451 | $1,695 | $1.17 | 44d | 1 | 1.26mi |
| 4507 Lonesome Dove Dr Killeen, TX | 4.0 | 2.0 | 1406 | $1,595 | $1.13 | 22d | 1 | 1.28mi |
Listing history 2 events
-
2026-06-19remarks 699-char remark
-
2026-06-19$99,999 Active 1 DOM
ⓘ Source: listings_history table (triggers on properties + properties_extension) + one-shot
backfill from property_details.listing_events for pre-trigger history.
Tax reassessment forecast TX · Resets to sale price
- Current annual tax
- $3,649 · $304/mo
- Projected year-2 tax
- $3,649 · $304/mo
- Expected delta
- $0/yr ($0/mo · -0.0%)
ⓘ Screening estimate from a state-policy table — verify with the county assessor before closing.
Climate risk First Street
- Flood 1/10 Low FEMA zone X (unshaded) · 0% chance over 30 yrs
- Wildfire 2/10 Low
- Heat 8/10 Severe 7 d/yr ≥107°F today · 24 d/yr by 30 yrs out
- Wind 6/10 Major 56% chance of damaging wind over 30 yrs
- Air quality 1/10 Low 0 unhealthy d/yr today · 0 by 30 yrs out
Nearby sold comps map
Loading sold comps map…
Walkable amenities ~0.75 mi
Loading nearby amenities…
Taxation est. · year 1
- Rental income
- $20,867
- − Mortgage interest
- −$5,601
- − Property taxes
- −$3,649
- − Insurance
- −$500
- − Repairs & maintenance
- −$1,669
- − Management
- −$1,669
- − Depreciation
- −$2,909
- Taxable income
- $4,869
- Est. tax owed @ 24.0%
- −$1,168
- After-tax cash flow
- $4,874/yr
For passive investors: Depreciation is non-cash, so a rental often shows a tax loss while cash-flowing — sheltering income. Rental losses are passive: they offset passive income freely, and up to $25,000/yr can offset ordinary (W-2) income if you actively participate and your MAGI is under $100k (phasing out to $0 by $150k); unused losses carry forward. On sale, claimed depreciation is recaptured at up to 25%, and gains may owe capital-gains tax (a 1031 exchange can defer both). Figures are a year-1 estimate at your 24.0% rate — not tax advice; consult a CPA.
Schools (NCES district)
- District
- Killeen ISD
- NCES district ID
- 4825660
- Math proficiency
- 31% ▼ -16.00%
- Reading proficiency
- 38% ▼ -3.00%
- Median HH income
- $47,665
- Composite
- 29.69/100
- National rank
- #6458
- State rank
- #524 of 826 in TX
Livability — Killeen
- Score
- 63/100
- State rank
- #853
- US rank
- #15359
Category grades
Schools grade is shown separately in the Schools card above.
Census & demographics
- Census place
- Killeen, TX
- County
- Bell County · 345,090 people
- City population
- 163,398
- Metro
- Killeen-Temple, TX
- Population (ZIP)
- 56,038
- Household income
- $70,871
- Rent vs Own
- Severe rent burden
- 1874.0
Population outlook (Bell County) Hauer SSP2
- Today (2025)
- 371,114 people
- By 2030
- 389,104 · +4.8%
- By 2040
- 420,592 · +13.3%
- By 2050
- 447,779 · +20.7%
- By 2075
- 499,130 · +34.5%
- By 2100
- 505,680 · +36.3%
Race, ethnicity, and origin ACS 2023
- Neighborhood character
- Highly diverse neighborhood (Simpson 0.74)
- Race & ethnicity
- Black 35% White 27% Hispanic / Latino 26% Two or more races 16% Asian 4% Pacific Islander 1%
- Hispanic origin (detail)
- Mexican 13% Puerto Rican 9%
- Common ancestry
- Italian 3% Romanian 1% Slovak 1%
- Foreign-born
- 8% · Canada, Vietnam, South Korea
- Languages at home
- 77% English-only · Spanish 17% Tagalog/Filipino 1% German/W. Germanic 1%
Political lean MEDSL · Bell
- 2024 margin
- R (+16.2) · D 41.3% · R 57.6% · Other 1.1%
- 2008→2024 swing
- -6.5pp toward R · 2008: -9.8pp · 2024: -16.2pp
- All cycles
- 2024: R+16.2 2020: R+8.5 2016: R+15.1 2012: R+16.4 2008: R+9.8
Not yet ingested
- Civics
- —
Market trends
- HPI YoY
- ▼ -24.68%
- Current HPI
- 171.2708
- Rent YoY
- ▲ 1.14%
- Metro
- Killeen-Temple, TX
- State GDP YoY
- ▲ 3.95%
- F500 in state
- 110
Industry mix (Fortune 500 HQ in TX)
| Industry | F500 HQs | Revenue |
|---|---|---|
| Energy | 16 | $1,198B |
|
||
| Technology | 5 | $198B |
|
||
| Engineering / Construction | 4 | $72B |
|
||
| Energy Services | 3 | $60B |
|
||
| Utilities | 3 | $41B |
|
||
| Healthcare | 2 | $330B |
|
||
Price history
+25.0% since first listed7 events — show timeline
- 2026-06-18 Listed $99,999 HARMLS
- 2007-11-30 Sold (MLS) — CTXMLS
- 2007-07-25 Listed $72,350 CTXMLS
- 2007-04-11 Listing Removed — CTXMLS
- 2006-12-28 Listed $80,000 CTXMLS
- 2001-07-24 Sold (Public Records) — Public Records
- 1989-07-31 Sold (Public Records) — Public Records
Property tax history
+5.7%/yrLatest (2026): $3,649 · -9.7% YoY. Source: county tax records.
Cash-flow waterfall
monthlySold comps — $/sqft
last 12 mo · ≤1 miLoading sold comps…