 Duplex
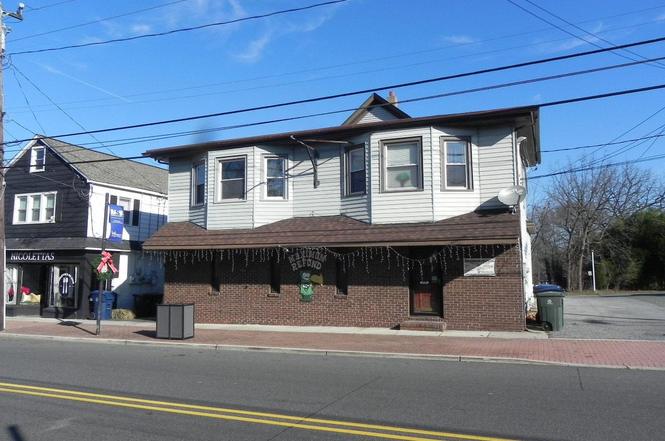
354-356 S Main St · Williamstown, NJ
Flood risk No data
- FEMA flood zone
- —
- Chance of flooding over 30 yrs
- —
- Est. flood insurance / yr
- —
Fire risk No data
- Est. fire insurance / yr
- —
Heat risk No data
- Hot days now (above threshold)
- —
- Hot days in 30 yrs
- —
Wind risk No data
- Chance of severe wind over 30 yrs
- —
Air-quality risk No data
- Unhealthy air days now
- —
- Unhealthy air days in 30 yrs
- —
Risk factors via First Street. Map © Google.
Why this score? — see what drove the D+ grade
The composite is a weighted blend of 9 inputs, each scored 0–100. Each bar is that input's sub-score; the figure is the points it added to the 100-point composite (weight × sub-score).
- Cash flow +16.8/30.0
- ARV discount +7.5/15.0
- DSCR +5.2/10.0
- 1% rule +4.5/10.0
- Livability +3.5/5.0
- Schools +3.0/10.0
- Rent growth +2.5/5.0
- Condition / age +2.5/5.0
- Appreciation +0.0/10.0
$397,475
🖨 Deal sheet (PDF) 📄 Offer letter ✓ Due diligence
Multi-family units
County records classify this as Multi-Family (2-4 Unit). Listing-text estimate: 2 units. confirmed
Listing remarks
Prime Main Street location with ample parking in downtown Williamstown! This three-story property offers over 5,000 square feet of rentable space. The first floor boasts 3,000 square feet of professional office space. The second floor has two apartments. Office units have separate access from the exterior of the building as well as from the common hall entrance which also leads to the oversized stairway leading to the two one-bedroom apartments. The two units have the same floor plan including private walk-up access to the third floor with two storage rooms for tenant use, one newly renovated. Each unit has one bedroom, kitchen, bath, and living area. Apartments are on separate gas and ele
Key facts
- Main street location
- Three-story property
- Ample parking
Tags
Property features AI
Finance
- Other: Building contains 4 total units
- Financial info: Fee simple ownership
Exterior
- Parking: On-site parking lot
- Utilities: Public water; Public sewer; Electric service
- Home design: Over-storefront mixed-use building; Frame construction
- Construction: Frame construction; Above-grade and below-grade structures
- Exterior features: Lot dimensions approximately 57 x 248
Interior
- Bedrooms: Four total residential units: two 1-bedroom units, one 2-bedroom unit and one 3-bedroom unit
- Heating & cooling: Forced air heating; Hot water baseboard heating; Natural gas heating and hot water; Central air conditioning (electric)
- Interior features: Multiple access exits (2+)
Neighborhood map
What this means for you Summary
Snapshot
- This is a 2 × 1-bed/1.0-bath units multifamily listed at $397k.
Deal economics
- At list price, monthly cash flow is $251 ($3k/yr) — positive. Per door: $126/mo.
- The deal already cash-flows at list — no discount required.
- To meet the 1% rule (rent ≥ 1% of price), the offer needs to be $380k (4.5% below list).
- Recommended offer: $350k (12.0% below list) — sets the bar for market timing.
- Cap rate 7.1% vs local median 4.9% in Williamstown — top-decile yield for the area; either an underpriced asset or a hidden risk that comps aren't pricing in. Stress-test before assuming the spread holds.
Location & tenants
- Location reads 69/100 on livability (#289 in NJ) — a middle-class / working-renter tenant base. Strengths: employment A+, housing A+; Watch: cost of living D+, amenities F, commute F.
- Monroe Township Public School District (suburban): math 20% / reading 45% proficiency, ranked #302 of 472 in NJ (top 64%) — families likely to look elsewhere, expect single-tenant / working-renter base with shorter leases.
- Market conditions: 270 active listings in the ZIP; solid renter incomes; 1,047 units permitted in Gloucester County in 2024 (183 in 5+ unit buildings).
- At $3,795/mo this rent would consume 47% of the median local household income ($97k/yr) (locally 721% of renters already pay >50% of income on rent) — very limited rent-growth headroom before tenants either downsize or default.
Forward outlook
- Local home prices are declining (-3.0%/yr); year-one equity from $3k of loan paydown is wiped out by about $12k of value loss. Plan a longer hold.
- Gloucester County population projected to shrink 5% by 2050 — rents likely to lag national; underwrite the cash flow, not the appreciation.
Negotiation context
- It's been on market 756 days — a 12% lower offer ($350k) is reasonable based on typical stale-listing flexibility.
- 3 sale attempts since 2y ago; this cycle's ask is 32347% above the opening price — seller raised mid-cycle; expect resistance to lowballs.
Risks & watch-outs
- Watch-outs: built in 1920 — expect roof / HVAC / electrical / plumbing capex.
Questions for the listing agent
- It's been on market 756 days. Have you received any prior offers? Is the seller open to a 12% concession, seller financing, or rate buy-down credit?
- Can we see the unit-by-unit rent roll, current vacancy, and any below-market leases? What's the average tenancy length?
- What capital expenditures (roof, boiler, parking lot, exteriors) have been made in the last 5 years, and what's planned in the next 2?
- Built in 1920 — when were the roof, HVAC, electrical panel, plumbing, and water heater last replaced?
- Why hasn't it sold? Are there any deal-killer items the seller is aware of (foundation, flood, title, zoning, code violations)?
- Is there a deadline driving the sale (1031 exchange, divorce, estate, relocation)? That informs how much negotiation room exists.
- The area grade is low — what's the realistic commute time and amenity access for the typical tenant pool here? Any planned neighborhood developments (good or bad) we should know about?
- What's the average days-on-market for RENTAL listings here right now (not sales)? A rising rental-DOM trend means longer vacancies and softer asking-rent achievability than the comps imply.
- What's the recent tenant-quality profile in this submarket — average credit score on applications, eviction rate, late-payment / NSF rate, and stable-employment percentage? A property-management company in the area should have these aggregated.
- How much new apartment / multifamily construction is in the pipeline within 1–3 miles? Heavy new supply (>2% of stock underway) typically softens rents 12–24 months out; light construction supports rent growth.
Investment metrics
- 1% rule
- 0.95% ✗
- Cap rate
- 7.05%
- Cash-on-cash
- 2.71%
- DSCR
- 1.12
- GRM
- 8.7
CMA / ARV
No comps found within radius.
Show comp detail 1 sale within ~0.75 mi
| Address | Dist | Beds/Ba | Sqft | Sold | Price | $/sf | Match |
|---|---|---|---|---|---|---|---|
| 520 S Main St | 0.20mi | 8/4.0 | 3,180 | 2mo | $300,000 | $94 | 60 |
Match score weights: distance 35% · size 25% · config 20% · recency 20%. Top-matched comps best support the ARV.
Projected returns pro-forma
-3.0% appreciation · 3.0% rent growth · sell at horizon
- IRR
- -12.0%
- Equity multiple
- 0.57×
- Total profit
- $-48,352
- Equity at exit
- $59,265
- IRR
- -2.8%
- Equity multiple
- 0.81×
- Total profit
- $-21,271
- Equity at exit
- $34,366
Cash invested: $111,293 (down + closing). Projections, not guarantees.
Landlord ↔ Tenant lean methodology
- Overall (STATE)
- 21 Tenant-Leaning
- State New Jersey
- 21 Tenant-Leaning · D+6
- County
- — inherits STATE
- City
- — inherits STATE
ZIP-level market 08094
- Active inventory
- 270
- Price-to-rent
- 17.5×
Monthly cashflow live
- Estimated rent
- $3,795 medium interval (Pro) →
- Mortgage (P&I)
- −$2,084
- Tax est. 1.5%
- −$497 /mo · $5,962/yr
- Insurance
- −$166
- HOA
- −$0
- Vacancy / Maint / Mgmt
- −$797
- Net cashflow
- $251
Break-even live
Sensitivity live
| Price | -10% $526 | -5% $389 | +0% $251 | +5% $114 | +10% $-23 |
|---|---|---|---|---|---|
| Rent | -10% $-49 | -5% $101 | +0% $251 | +5% $401 | +10% $551 |
| Rate | -1.0pp $451 | -0.5pp $352 | base $251 | +0.5pp $148 | +1.0pp $43 |
2-unit breakdown (identical units grouped — click to expand)
| Units | Beds | Baths | Est. rent |
|---|---|---|---|
| 2× units | 1 | 1 | $3,794 |
| #1 | 1 | 1 | $1,897 |
| #2 | 1 | 1 | $1,897 |
| Total (2 units) | $3,795 | ||
UW: 25.0% down · 7.5% · 30yr · 1.5% tax · 5.0% vac · 8.0% maint · 8.0% mgmt
Financing live
Cash to close
- Down payment
- $99,369
- Closing costs
- $11,924
- Reserves months
- —
- Total cash needed
- —
Loan-product check · same deal, 3 products live
Conventional
25% down · 7.5% · 30yr
- Down + closing
- —
- Monthly P&I
- —
- Monthly cashflow
- —
- DSCR
- —
- Eligible?
- —
Personal DTI + credit; lowest rate.
DSCR
20% down · 8.5% · 30yr
- Down + closing
- —
- Monthly P&I
- —
- Monthly cashflow
- —
- DSCR
- —
- Eligible?
- —
No personal income docs; deal must DSCR.
Hard money
10% down · 12.0% · 12mo
- Down + closing
- —
- Monthly P&I
- —
- Monthly cashflow
- —
- DSCR
- —
- Eligible?
- —
Short-term bridge; refi at stabilization.
Listing history 24 events
-
2026-06-21days on market $397,475 Active 756 DOM
-
2026-06-18days on market $397,475 Active 753 DOM
-
2026-06-17days on market $397,475 Active 752 DOM
-
2026-06-16days on market $397,475 Active 751 DOM
-
2026-06-15days on market $397,475 Active 750 DOM
-
2026-06-13days on market $397,475 Active 748 DOM
-
2026-06-09days on market $397,475 Active 744 DOM
-
2026-06-08days on market $397,475 Active 743 DOM
-
2026-06-07days on market $397,475 Active 742 DOM
-
2026-06-04days on market $397,475 Active 739 DOM
-
2026-06-03days on market $397,475 Active 738 DOM
-
2026-06-02days on market $397,475 Active 737 DOM
-
2026-06-01days on market $397,475 Active 736 DOM
-
2026-05-31days on market $397,475 Active 735 DOM
-
2025-12-13price $397,475
-
2025-12-13status Active
-
2025-11-16status Pending
-
2025-11-03historical Active Under Contract
-
2024-12-09historical $1,225
-
2024-11-22$1,225
-
2024-11-12price $397,485
-
2024-08-23price $397,500
-
2024-07-09price $397,800
-
2024-04-17$397,890 Active
ⓘ Source: listings_history table (triggers on properties + properties_extension) + one-shot
backfill from property_details.listing_events for pre-trigger history.
Nearby sold comps map
Loading sold comps map…
Walkable amenities ~0.75 mi
Loading nearby amenities…
Taxation est. · year 1
- Rental income
- $45,540
- − Mortgage interest
- −$22,265
- − Property taxes
- −$5,962
- − Insurance
- −$1,987
- − Repairs & maintenance
- −$3,643
- − Management
- −$3,643
- − Depreciation
- −$11,563
- Taxable loss
- −$3,524
- Est. tax savings @ 24.0%
- +$846
- After-tax cash flow
- $3,860/yr
For passive investors: Depreciation is non-cash, so a rental often shows a tax loss while cash-flowing — sheltering income. Rental losses are passive: they offset passive income freely, and up to $25,000/yr can offset ordinary (W-2) income if you actively participate and your MAGI is under $100k (phasing out to $0 by $150k); unused losses carry forward. On sale, claimed depreciation is recaptured at up to 25%, and gains may owe capital-gains tax (a 1031 exchange can defer both). Figures are a year-1 estimate at your 24.0% rate — not tax advice; consult a CPA.
Schools (NCES district)
- District
- Monroe Township Public School District
- NCES district ID
- 3410470
- Math proficiency
- 20% ▼ -24.00%
- Reading proficiency
- 45% ▼ -9.00%
- Median HH income
- $71,557
- Composite
- 30.24/100
- National rank
- #6295
- State rank
- #302 of 472 in NJ
Livability — Williamstown
- Score
- 69/100
- State rank
- #289
- US rank
- #8603
Category grades
Schools grade is shown separately in the Schools card above.
Census & demographics
- Census place
- Williamstown, NJ
- County
- Gloucester County · 160,422 people
- City population
- 41,595
- Metro
- Philadelphia-Camden-Wilmington, PA-NJ-DE-MD
- Population (ZIP)
- 41,595
- Household income
- $96,699
- Rent vs Own
- Severe rent burden
- 721.0
Population outlook (Gloucester County) Hauer SSP2
- Today (2025)
- 298,895 people
- By 2030
- 299,031 · +0.0%
- By 2040
- 294,020 · -1.6%
- By 2050
- 284,188 · -4.9%
- By 2075
- 260,720 · -12.8%
- By 2100
- 229,565 · -23.2%
Race, ethnicity, and origin ACS 2023
- Neighborhood character
- Predominantly White (73%)
- Race & ethnicity
- White 73% Hispanic / Latino 11% Black 10% Two or more races 8% Asian 1%
- Hispanic origin (detail)
- Puerto Rican 6% Dominican 1%
- Common ancestry
- Romanian 6% Slovak 2% Lithuanian 1%
- Foreign-born
- 4% · Canada
- Languages at home
- 92% English-only · Spanish 5% Russian/Polish/Slavic 1%
Political lean MEDSL · Gloucester
- 2024 margin
- Toss-up / Even · D 47.8% · R 50.6% · Other 1.6%
- 2008→2024 swing
- -15.0pp toward R · 2008: 12.2pp · 2024: -2.8pp
- All cycles
- 2024: R+2.8 2020: D+1.9 2016: R+0.4 2012: D+10.5 2008: D+12.2
Not yet ingested
- Civics
- —
Market trends
- HPI YoY
- ▼ -213.12%
- Current HPI
- 278.3849
- Rent YoY
- —
- Metro
- Philadelphia-Camden-Wilmington, PA-NJ-DE-MD
- State GDP YoY
- ▲ 2.05%
- F500 in state
- 34
Industry mix (Fortune 500 HQ in NJ)
| Industry | F500 HQs | Revenue |
|---|---|---|
| Consumer Goods | 3 | $31B |
|
||
| Pharmaceuticals | 2 | $153B |
|
||
| Technology | 2 | $21B |
|
||
| Insurance | 2 | $20B |
|
||
| Healthcare | 2 | $19B |
|
||
| Financial Services | 1 | $70B |
|
||
Price history
-0.1% since first listed10 events — show timeline
- 2025-12-13 Price Changed $397,475 BRIGHT MLS
- 2025-12-13 Relisted — BRIGHT MLS
- 2025-11-16 Pending — BRIGHT MLS
- 2025-11-03 Contingent — BRIGHT MLS
- 2024-12-09 Rental Removed $1,225 BRIGHTMLS
- 2024-11-22 Listed for Rent $1,225 BRIGHTMLS
- 2024-11-12 Price Changed $397,485 BRIGHT MLS
- 2024-08-23 Price Changed $397,500 BRIGHT MLS
- 2024-07-09 Price Changed $397,800 BRIGHT MLS
- 2024-04-17 Listed $397,890 BRIGHT MLS
Cash-flow waterfall
monthlySold comps — $/sqft
last 12 mo · ≤1 miLoading sold comps…