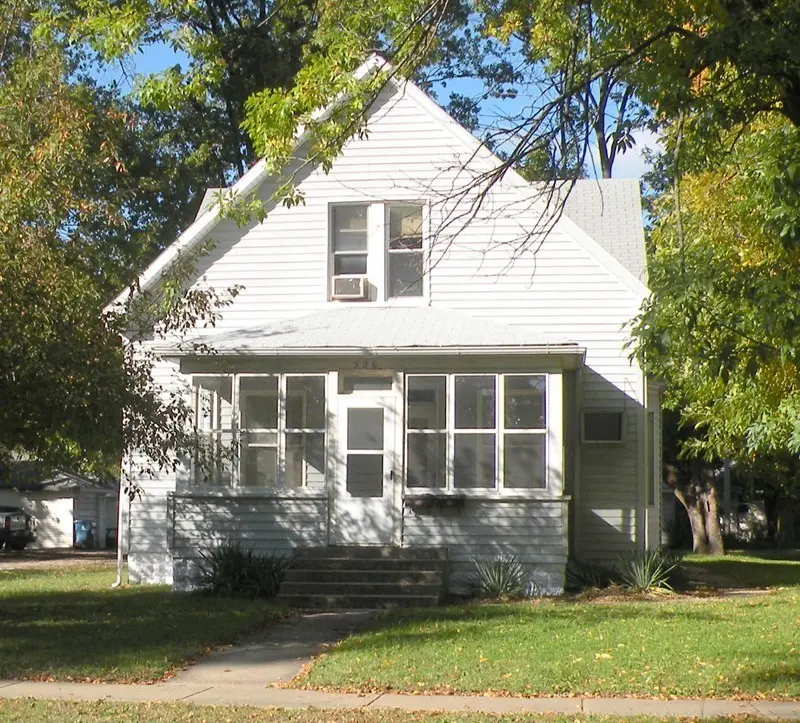
526 W 4th St · Centralia, IL
Flood risk 1/10 · Minimal
- FEMA flood zone
- X (unshaded)
- Chance of flooding over 30 yrs
- 0.0%
- Est. flood insurance / yr
- $473 – $860
Fire risk 1/10 · Minimal
- Est. fire insurance / yr
- $804 – $1,492
Heat risk 4/10 · Minor
- Hot days now (above 106°F)
- 7 days/yr
- Hot days in 30 yrs
- 20 days/yr
Wind risk 2/10 · Minimal
- Chance of severe wind over 30 yrs
- 2.0%
Air-quality risk 2/10 · Minimal
- Unhealthy air days now
- 1 days/yr
- Unhealthy air days in 30 yrs
- 1 days/yr
Risk factors via First Street. Map © Google.
Why this score? — see what drove the D grade
The composite is a weighted blend of 9 inputs, each scored 0–100. Each bar is that input's sub-score; the figure is the points it added to the 100-point composite (weight × sub-score).
- Cash flow +15.0/30.0
- ARV discount +7.5/15.0
- 1% rule +5.0/10.0
- DSCR +5.0/10.0
- Livability +3.4/5.0
- Rent growth +2.5/5.0
- Condition / age +2.5/5.0
- Schools +2.2/10.0
- Appreciation +0.0/10.0
$17,500
🖨 Deal sheet 📄 Offer letter ✓ Due diligence
Listing remarks
Recently was a duplex but was once SFR being sold as-is and is ready for your updates. New roof 2023. Seller to make no repairs or obtain passed occupancy. Buyer to verify square footage, room count, utilities, and all other MLS information. Agent related.
Key facts
- New roof
- 6,969 sq ft lot
- Built 1915
Tags
Property features AI
Exterior
- Utilities: Public water; Public sewer; Electric: Other
- Home design: Single-family residence; One and one-half stories
- Construction: Frame construction with vinyl siding
- Exterior features: Other lot features
Interior
- Bedrooms: 3 bedrooms total (2 on the main level, 1 on the upper level)
- Bathrooms: 2 full bathrooms (1 on the main level, 1 on the upper level)
- Heating & cooling: Other heating; Other cooling
- Interior features: Unfinished basement; Five total rooms
Neighborhood map
What this means for you Summary
Snapshot
- This is a 3-bed/2.0-bath other listed at $18k.
Deal economics
- At list price, monthly cash flow is $520 ($6k/yr) — positive.
- The deal already cash-flows at list — no discount required.
- Meets the 1% rule at list price ($814 rent vs $18k).
- Recommended offer: $16k (9.0% below list) — sets the bar for market timing.
- Cap rate 42.0% vs local median 5.8% in Centralia — top-decile yield for the area; either an underpriced asset or a hidden risk that comps aren't pricing in. Stress-test before assuming the spread holds.
Location & tenants
- Location reads 68/100 on livability (#481 in IL) — a middle-class / working-renter tenant base. Strengths: cost of living A+, housing A+, health & safety A+; Watch: crime F, amenities F, commute F.
- Centralia Hsd 200 (town): math 21% / reading 26% proficiency, ranked #668 of 919 in IL (top 73%) — low school quality limits family demand, transient renter base, plan for 1-2y turnover.
- Zoned schools: Centralia High School (math 22% / reading 17%, grade F, #397 of 693 statewide, top 61%, 863 students, 0% FRL).
- Market conditions: 99 active listings in the ZIP; 2 comparable units currently listed for rent nearby; 64 units permitted in Clinton County in 2024 (0 in 5+ unit buildings).
Forward outlook
- Local home prices are declining (-3.0%/yr); year-one equity from $121 of loan paydown is wiped out by about $525 of value loss. Plan a longer hold.
- Clinton County population projected at -12% by 2050 — secular population decline; favor cash flow + early exit over multi-decade hold.
- At projected returns (-3.0% appreciation + 3.0% rent growth), your $5k cash investment doubles in ~1 year — after that, you're playing with house money.
Negotiation context
- It's been on market 91 days — a 9% lower offer ($16k) is reasonable based on typical stale-listing flexibility.
- 4 sale attempts since 13y ago; this cycle's ask has dropped $6k (27%) from the opening price — seller is motivated, your offer sets the floor, not the list.
Risks & watch-outs
- Watch-outs: built in 1915 — expect roof / HVAC / electrical / plumbing capex.
Questions for the listing agent
- It's been on market 91 days. Have you received any prior offers? Is the seller open to a 9% concession, seller financing, or rate buy-down credit?
- Built in 1915 — when were the roof, HVAC, electrical panel, plumbing, and water heater last replaced?
- Why hasn't it sold? Are there any deal-killer items the seller is aware of (foundation, flood, title, zoning, code violations)?
- Is there a deadline driving the sale (1031 exchange, divorce, estate, relocation)? That informs how much negotiation room exists.
- Schools are D-rated, which usually means shorter tenancies and higher turnover. Who's the typical renter profile here, and what's been the actual vacancy rate?
- Crime grade is F in this area — have there been break-ins, vandalism, or insurance claims at this property in the last 3 years? What carrier currently insures it and at what premium?
- The area grade is low — what's the realistic commute time and amenity access for the typical tenant pool here? Any planned neighborhood developments (good or bad) we should know about?
- What's the average days-on-market for RENTAL listings here right now (not sales)? A rising rental-DOM trend means longer vacancies and softer asking-rent achievability than the comps imply.
- What's the recent tenant-quality profile in this submarket — average credit score on applications, eviction rate, late-payment / NSF rate, and stable-employment percentage? A property-management company in the area should have these aggregated.
- How much new for-sale + rental construction is in the pipeline within 1–3 miles? Heavy new supply typically softens prices + rents 12–24 months out; constrained supply supports both.
Investment metrics
- 1% rule
- 4.65% ✓
- Cap rate
- 41.97%
- Cash-on-cash
- 127.40%
- DSCR
- 6.67
- GRM
- 1.8
CMA / ARV
No comps found within radius.
Projected returns pro-forma
-3.0% appreciation · 3.0% rent growth · sell at horizon
- IRR
- —
- Equity multiple
- 7.19×
- Total profit
- $30,312
- Equity at exit
- $2,609
- IRR
- —
- Equity multiple
- 15.11×
- Total profit
- $69,115
- Equity at exit
- $1,513
Cash invested: $4,900 (down + closing). Projections, not guarantees.
Landlord ↔ Tenant lean methodology
- Overall (STATE)
- 43 Moderately Tenant-Leaning
- State Illinois
- 43 Moderately Tenant-Leaning · D+7
- County
- — inherits STATE
- City
- — inherits STATE
ZIP-level market 62801
- Home prices YoY
- -13.9%
- Active inventory
- 99
- Price-to-rent
- 1.8×
Monthly cashflow live
- Estimated rent
- $814 medium interval (Pro) →
- Mortgage (P&I)
- −$92
- Tax from tax record
- −$24 /mo · $289/yr
- Insurance
- −$7
- HOA
- −$0
- Vacancy / Maint / Mgmt
- −$171
- Net cashflow
- $520
Break-even live
UW: 25.0% down · 7.5% · 30yr · 1.5% tax · 5.0% vac · 8.0% maint · 8.0% mgmt
Financing live
Cash to close
- Down payment
- $4,375
- Closing costs
- $525
- Reserves months
- —
- Total cash needed
- —
Loan-product check · same deal, 3 products live
Conventional
25% down · 7.5% · 30yr
- Down + closing
- —
- Monthly P&I
- —
- Monthly cashflow
- —
- DSCR
- —
- Eligible?
- —
Personal DTI + credit; lowest rate.
DSCR
20% down · 8.5% · 30yr
- Down + closing
- —
- Monthly P&I
- —
- Monthly cashflow
- —
- DSCR
- —
- Eligible?
- —
No personal income docs; deal must DSCR.
Hard money
10% down · 12.0% · 12mo
- Down + closing
- —
- Monthly P&I
- —
- Monthly cashflow
- —
- DSCR
- —
- Eligible?
- —
Short-term bridge; refi at stabilization.
Rent comps 2 comps
| Address | Beds | Baths | Sqft | Rent | $/sqft | DOM | Units | Dist |
|---|---|---|---|---|---|---|---|---|
| 805 S Hickory St Centralia, IL | 3.0 | 2.0 | 1814 | $800 | $0.44 | 43d | 1 | 0.47mi |
| 28 Deerwood Park Centralia, IL | 3.0 | 3.0 | 1216 | $869 | $0.71 | 43d | 1 | 1.48mi |
Listing history 24 events
-
2026-06-18days on market $17,500 Active 91 DOM
-
2026-06-17days on market $17,500 Active 90 DOM
-
2026-06-16days on market $17,500 Active 89 DOM
-
2026-06-15days on market $17,500 Active 88 DOM
-
2026-06-13pricedays on market $17,500 Active 86 DOM
-
2026-06-09days on market $23,000 Active 85 DOM
-
2026-06-08days on market $23,000 Active 84 DOM
-
2026-06-07days on market $23,000 Active 83 DOM
-
2026-06-07days on market $23,000 Active 82 DOM
-
2026-06-04days on market $23,000 Active 79 DOM
-
2026-06-02days on market $23,000 Active 78 DOM
-
2026-06-01days on market $23,000 Active 77 DOM
-
2026-05-31days on market $23,000 Active 76 DOM
-
2026-05-31days on market $23,000 Active 75 DOM
-
2026-04-09price $23,000
-
2026-03-16$24,000 Active
-
2026-03-11$24,000 Active
-
2021-08-06historical
-
2013-12-30soldstatus $35,000
-
2013-12-14soldstatus
-
2013-12-14soldstatus
-
2013-12-02$42,000
-
2013-12-02$42,000
-
2013-10-31historical
ⓘ Source: listings_history table (triggers on properties + properties_extension) + one-shot
backfill from property_details.listing_events for pre-trigger history.
Tax reassessment forecast IL · Partial reset (capped growth)
- Current annual tax
- $289 · $24/mo
- Projected year-2 tax
- $343 · $29/mo
- Expected delta
- +$54/yr (+$5/mo · 18.7%)
ⓘ Screening estimate from a state-policy table — verify with the county assessor before closing.
Climate risk First Street
- Flood 1/10 Low FEMA zone X (unshaded) · 0% chance over 30 yrs
- Wildfire 1/10 Low
- Heat 4/10 Moderate 7 d/yr ≥106°F today · 20 d/yr by 30 yrs out
- Wind 2/10 Low 2% chance of damaging wind over 30 yrs
- Air quality 2/10 Low 1 unhealthy d/yr today · 1 by 30 yrs out
Nearby sold comps map
Loading sold comps map…
Walkable amenities ~0.75 mi
Loading nearby amenities…
Taxation est. · year 1
- Rental income
- $9,773
- − Mortgage interest
- −$980
- − Property taxes
- −$289
- − Insurance
- −$88
- − Repairs & maintenance
- −$782
- − Management
- −$782
- − Depreciation
- −$509
- Taxable income
- $6,343
- Est. tax owed @ 24.0%
- −$1,522
- After-tax cash flow
- $4,720/yr
For passive investors: Depreciation is non-cash, so a rental often shows a tax loss while cash-flowing — sheltering income. Rental losses are passive: they offset passive income freely, and up to $25,000/yr can offset ordinary (W-2) income if you actively participate and your MAGI is under $100k (phasing out to $0 by $150k); unused losses carry forward. On sale, claimed depreciation is recaptured at up to 25%, and gains may owe capital-gains tax (a 1031 exchange can defer both). Figures are a year-1 estimate at your 24.0% rate — not tax advice; consult a CPA.
Schools (NCES district)
- District
- Centralia Hsd 200
- NCES district ID
- 1709300
- Math proficiency
- 21% ▲ 6.00%
- Reading proficiency
- 26% ▲ 1.00%
- Median HH income
- $34,555
- Composite
- 22.43/100
- National rank
- #13470
- State rank
- #668 of 919 in IL
Livability — Centralia
- Score
- 68/100
- State rank
- #481
- US rank
- #9987
Category grades
Schools grade is shown separately in the Schools card above.
Census & demographics
- Census place
- Centralia, IL
- City population
- 19,941
- Population (ZIP)
- 19,941
Population outlook (Clinton County) Hauer SSP2
- Today (2025)
- 37,663 people
- By 2030
- 37,194 · -1.2%
- By 2040
- 35,566 · -5.6%
- By 2050
- 32,950 · -12.5%
- By 2075
- 26,403 · -29.9%
- By 2100
- 19,267 · -48.8%
Race, ethnicity, and origin ACS 2023
- Neighborhood character
- Predominantly White (81%)
- Race & ethnicity
- White 81% Black 11% Two or more races 4% Hispanic / Latino 4% Asian 1%
- Common ancestry
- Serbian 2% Romanian 2% Lithuanian 1%
- Foreign-born
- 3% · Canada, China
- Languages at home
- 96% English-only · Spanish 2%
Political lean MEDSL · Clinton
- 2024 margin
- Solid R (+51.8) · D 23.1% · R 75.0% · Other 1.9%
- 2008→2024 swing
- -42.0pp toward R · 2008: -9.8pp · 2024: -51.8pp
- All cycles
- 2024: R+51.8 2020: R+51.1 2016: R+49.0 2012: R+30.0 2008: R+9.8
Not yet ingested
- Civics
- —
Market trends
- HPI YoY
- ▼ -34.12%
- Current HPI
- 211.3835
- Rent YoY
- —
- Metro
- —
- State GDP YoY
- ▲ 1.59%
- F500 in state
- 60
Industry mix (Fortune 500 HQ in IL)
| Industry | F500 HQs | Revenue |
|---|---|---|
| Insurance | 4 | $201B |
|
||
| Consumer Goods | 4 | $87B |
|
||
| Industrial Machinery | 3 | $64B |
|
||
| Healthcare | 2 | $55B |
|
||
| Retail / Pharmacy | 1 | $148B |
|
||
| Agriculture / Food | 1 | $86B |
|
||
Price history
-45.2% since first listed10 events — show timeline
- 2026-04-09 Price Changed $23,000 MARIS as Distributed by MLS Grid
- 2026-03-16 Listed $24,000 MARIS as Distributed by MLS Grid
- 2026-03-11 Listed $24,000 MARIS as Distributed by MLS Grid
- 2021-08-06 Listing Removed — RMLSA as Distributed by MLS Grid
- 2013-12-30 Sold (Public Records) $35,000 Public Records
- 2013-12-14 Sold (MLS) — RMLSA as Distributed by MLS Grid
- 2013-12-14 Sold (MLS) — MRED as Distributed by MLS Grid
- 2013-12-02 Listed $42,000 RMLSA as Distributed by MLS Grid
- 2013-12-02 Listed $42,000 MRED as Distributed by MLS Grid
- 2013-10-31 Listing Removed — MRED as Distributed by MLS Grid
Property tax history
-13.3%/yrLatest (2024): $289 · +5.5% YoY. Source: county tax records.
Cash-flow waterfall
monthlySold comps — $/sqft
last 12 mo · ≤1 miLoading sold comps…