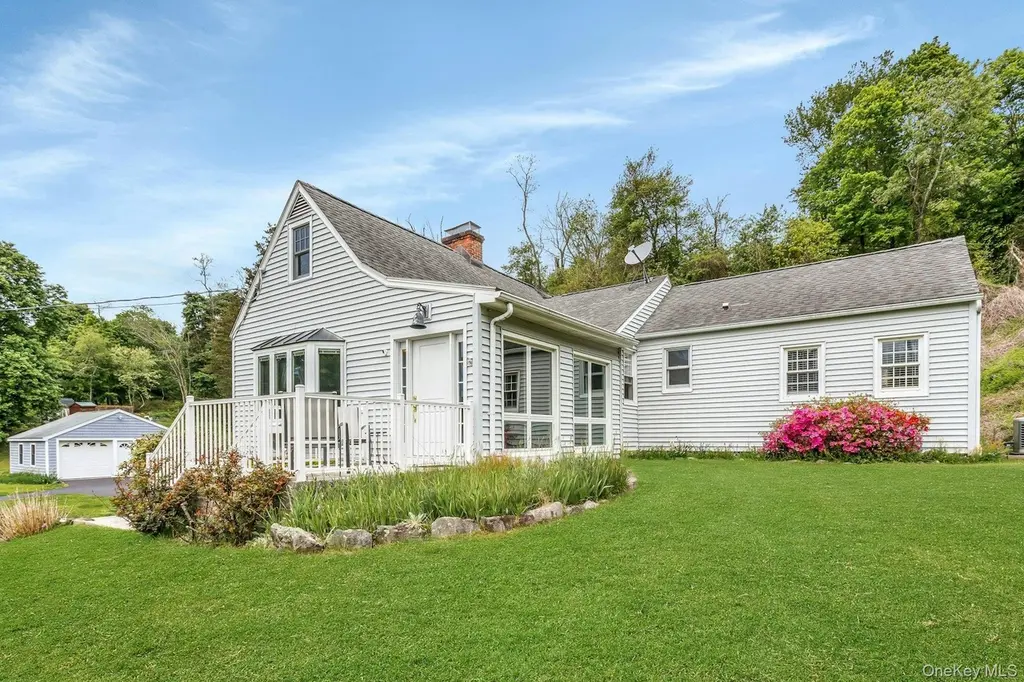
31 Spring St S · West Mountain, CT
Flood risk 1/10 · Minimal
- FEMA flood zone
- X (unshaded)
- Chance of flooding over 30 yrs
- 0.0%
- Est. flood insurance / yr
- $473 – $860
Fire risk 3/10 · Minor
- Est. fire insurance / yr
- $691 – $1,283
Heat risk 4/10 · Minor
- Hot days now (above 98°F)
- 7 days/yr
- Hot days in 30 yrs
- 17 days/yr
Wind risk 5/10 · Moderate
- Chance of severe wind over 30 yrs
- 25.0%
Air-quality risk 4/10 · Minor
- Unhealthy air days now
- 3 days/yr
- Unhealthy air days in 30 yrs
- 6 days/yr
Risk factors via First Street. Map © Google.
Why this score? — see what drove the D grade
The composite is a weighted blend of 9 inputs, each scored 0–100. Each bar is that input's sub-score; the figure is the points it added to the 100-point composite (weight × sub-score).
- Cash flow +11.3/30.0
- ARV discount +7.5/15.0
- Schools +7.5/10.0
- 1% rule +3.4/10.0
- DSCR +3.3/10.0
- Rent growth +2.5/5.0
- Livability +2.5/5.0
- Condition / age +2.5/5.0
- Appreciation +0.0/10.0
$799,999
🖨 Deal sheet (PDF) 📄 Offer letter ✓ Due diligence
Listing remarks
Welcome to 31 Spring Street South in beautiful South Salem, NY — a lovingly maintained expanded ranch being offered for the first time in decades. Nestled on a private, sun-drenched property with mature landscaping and estate-like grounds, this special residence offers the perfect blend of tranquility, space, and opportunity. Featuring 4 bedrooms/2 full bathrooms, this picturesque property also includes potential for a private mother/daughter setup or guest quarters. Additional features include a chef’s kitchen with stainless steel appliances and a Kohler whole house generator, creating a peaceful retreat in every season. Outside, enjoy lush gardens, expansive outdoor space, and
Key facts
- 1.75 acre lot
- 2 garage spots
- Built 1947
Property features AI
Exterior
- Parking: Detached garage; Driveway; Private parking; Garage with door opener; 2-car garage
- Utilities: Septic tank; Electricity available and connected; Natural gas available
- Home design: Single family residence; Three or more levels
- Construction: Frame construction; Partial basement; Walkup attic
- Exterior features: Frame construction; Not waterfront
Interior
- Kitchen: Dishwasher; Gas oven; Gas range; Microwave; Refrigerator; Stainless steel appliances; Eat-in kitchen with island
- Bedrooms: Includes a first-floor bedroom; Master bedroom located downstairs
- Bathrooms: 2 full bathrooms
- Heating & cooling: Oil heating; Propane heating; Wall/window AC units
- Interior features: First-floor bedroom; First-floor full bath; Crown molding; Eat-in kitchen; Entertainment cabinets; In-law floorplan; Kitchen island; Original details; Master bedroom on main level; Recessed lighting; Basement (partial); Walkup attic; Three or more levels; 8 total rooms
- Laundry & utility: Washer; Dryer
Neighborhood map
What this means for you Summary
Snapshot
- This is a 4-bed/2.0-bath single-family listed at $800k.
Deal economics
- At list price, monthly cash flow is $-298 ($-4k/yr) — negative.
- To cash-flow at today's rent, offer at most $747k (6.6% below list).
- To meet the 1% rule (rent ≥ 1% of price), the offer needs to be $671k (16.1% below list).
- Recommended offer: $671k (16.1% below list) — sets the bar for 1% rule.
- Cap rate 5.8% vs local median 3.1% in West Mountain — top-decile yield for the area; either an underpriced asset or a hidden risk that comps aren't pricing in. Stress-test before assuming the spread holds.
Location & tenants
- Location reads: area grade D — affects rentability + tenant quality, not the cash-flow math above.
- Katonah-Lewisboro Union Free School District (suburban): math 75% / reading 82% proficiency, ranked #32 of 590 in NY (top 5%) — strong family-tenant draw, lease renewals of 3-5y typical; only 3% free/reduced lunch — higher-income household profile.
- Zoned schools: Increase Miller Elementary School (math 82% / reading 87%, grade A+, #93 of 2,108 statewide, top 6%, 489 students, 9% FRL); John Jay Middle School (math 58% / reading 79%, grade A, #94 of 729 statewide, top 13%, 662 students, 7% FRL); John Jay High School (math 98% / reading 82%, grade A+, #238 of 1,100 statewide, top 23%, 917 students, 9% FRL).
- Market conditions: 2 comparable units currently listed for rent nearby; 954 units permitted in Westchester County in 2024 (649 in 5+ unit buildings).
Forward outlook
- Local home prices are declining (-3.0%/yr); year-one equity from $6k of loan paydown is wiped out by about $24k of value loss. Plan a longer hold.
- Westchester County population projected at +10% by 2050 — modest demand growth; plan on rents tracking national, not racing it.
Negotiation context
- It's been on market 26 days — a 2% lower offer ($788k) is reasonable based on typical stale-listing flexibility.
Risks & watch-outs
- Watch-outs: built in 1947 — expect roof / HVAC / electrical / plumbing capex.
- Climate carrying-cost: moderate wind risk, 25% chance of damaging wind over 30y — expect insurance premiums to compound above CPI over the hold.
Questions for the listing agent
- What do current leases actually rent for vs. the listed asking? Can we see a recent rent roll and the last 12 months of T-12 income?
- Built in 1947 — when were the roof, HVAC, electrical panel, plumbing, and water heater last replaced?
- Is there a deadline driving the sale (1031 exchange, divorce, estate, relocation)? That informs how much negotiation room exists.
- The area grade is low — what's the realistic commute time and amenity access for the typical tenant pool here? Any planned neighborhood developments (good or bad) we should know about?
- What's the average days-on-market for RENTAL listings here right now (not sales)? A rising rental-DOM trend means longer vacancies and softer asking-rent achievability than the comps imply.
- What's the recent tenant-quality profile in this submarket — average credit score on applications, eviction rate, late-payment / NSF rate, and stable-employment percentage? A property-management company in the area should have these aggregated.
- How much new for-sale + rental construction is in the pipeline within 1–3 miles? Heavy new supply typically softens prices + rents 12–24 months out; constrained supply supports both.
Investment metrics
- 1% rule
- 0.84% ✗
- Cap rate
- 5.85%
- Cash-on-cash
- -1.60%
- DSCR
- 0.93
- GRM
- 9.9
CMA / ARV
No comps found within radius.
Projected returns pro-forma
-3.0% appreciation · 3.0% rent growth · sell at horizon
- IRR
- -18.9%
- Equity multiple
- 0.34×
- Total profit
- $-148,459
- Equity at exit
- $119,282
- IRR
- -11.4%
- Equity multiple
- 0.32×
- Total profit
- $-153,114
- Equity at exit
- $69,169
Cash invested: $224,000 (down + closing). Projections, not guarantees.
Landlord ↔ Tenant lean methodology
- Overall (STATE)
- 27 Tenant-Leaning
- State Connecticut
- 27 Tenant-Leaning · D+7
- County
- — inherits STATE
- City
- — inherits STATE
ZIP-level market 10590
- Home prices YoY
- -30.8%
- Price-to-rent
- 9.9×
Monthly cashflow live
- Estimated rent
- $6,710 medium interval (Pro) →
- Mortgage (P&I)
- −$4,195
- Tax from tax record
- −$1,070 /mo · $12,841/yr
- Insurance
- −$333
- HOA
- −$0
- Vacancy / Maint / Mgmt
- −$1,409
- Net cashflow
- $-298
Break-even live
Sensitivity live
| Price | -10% $155 | -5% $-71 | +0% $-298 | +5% $-524 | +10% $-751 |
|---|---|---|---|---|---|
| Rent | -10% $-828 | -5% $-563 | +0% $-298 | +5% $-33 | +10% $232 |
| Rate | -1.0pp $105 | -0.5pp $-94 | base $-298 | +0.5pp $-505 | +1.0pp $-716 |
UW: 25.0% down · 7.5% · 30yr · 1.5% tax · 5.0% vac · 8.0% maint · 8.0% mgmt
Financing live
Cash to close
- Down payment
- $200,000
- Closing costs
- $24,000
- Reserves months
- —
- Total cash needed
- —
Loan-product check · same deal, 3 products live
Conventional
25% down · 7.5% · 30yr
- Down + closing
- —
- Monthly P&I
- —
- Monthly cashflow
- —
- DSCR
- —
- Eligible?
- —
Personal DTI + credit; lowest rate.
DSCR
20% down · 8.5% · 30yr
- Down + closing
- —
- Monthly P&I
- —
- Monthly cashflow
- —
- DSCR
- —
- Eligible?
- —
No personal income docs; deal must DSCR.
Hard money
10% down · 12.0% · 12mo
- Down + closing
- —
- Monthly P&I
- —
- Monthly cashflow
- —
- DSCR
- —
- Eligible?
- —
Short-term bridge; refi at stabilization.
Rent comps 2 comps
| Address | Beds | Baths | Sqft | Rent | $/sqft | DOM | Units | Dist |
|---|---|---|---|---|---|---|---|---|
| 68 Lake Shore Dr South Salem, NY | 4.0 | 2.5 | 2430 | $6,500 | $2.67 | 16d | 1 | 0.97mi |
| 57 Truesdale Lake Dr South Salem, NY | 3.0 | 2.5 | 1350 | $7,000 | $5.19 | 4d | 1 | 1.22mi |
Listing history 17 events
-
2026-06-22days on market $799,999 Active 26 DOM
-
2026-06-18days on market $799,999 Active 23 DOM
-
2026-06-17days on market $799,999 Active 22 DOM
-
2026-06-16days on market $799,999 Active 21 DOM
-
2026-06-15days on market $799,999 Active 20 DOM
-
2026-06-13days on market $799,999 Active 18 DOM
-
2026-06-13days on market $799,999 Active 17 DOM
-
2026-06-10days on market $799,999 Active 15 DOM
-
2026-06-09days on market $799,999 Active 14 DOM
-
2026-06-08days on market $799,999 Active 13 DOM
-
2026-06-07days on market $799,999 Active 12 DOM
-
2026-06-05days on market $799,999 Active 9 DOM
-
2026-06-03days on market $799,999 Active 8 DOM
-
2026-06-03days on market $799,999 Active 7 DOM
-
2026-06-01days on market $799,999 Active 6 DOM
-
2026-05-31days on market $799,999 Active 5 DOM
-
2026-05-18historical $799,999
ⓘ Source: listings_history table (triggers on properties + properties_extension) + one-shot
backfill from property_details.listing_events for pre-trigger history.
Tax reassessment forecast CT · Partial reset (capped growth)
- Current annual tax
- $12,841 · $1,070/mo
- Projected year-2 tax
- $14,980 · $1,248/mo
- Expected delta
- +$2,140/yr (+$178/mo · 16.7%)
ⓘ Screening estimate from a state-policy table — verify with the county assessor before closing.
Climate risk First Street
- Flood 1/10 Low FEMA zone X (unshaded) · 0% chance over 30 yrs
- Wildfire 3/10 Moderate
- Heat 4/10 Moderate 7 d/yr ≥98°F today · 17 d/yr by 30 yrs out
- Wind 5/10 Major 25% chance of damaging wind over 30 yrs
- Air quality 4/10 Moderate 3 unhealthy d/yr today · 6 by 30 yrs out
Nearby sold comps map
Loading sold comps map…
Walkable amenities ~0.75 mi
Loading nearby amenities…
Taxation est. · year 1
- Rental income
- $80,519
- − Mortgage interest
- −$44,812
- − Property taxes
- −$12,841
- − Insurance
- −$4,000
- − Repairs & maintenance
- −$6,442
- − Management
- −$6,442
- − Depreciation
- −$23,273
- Taxable loss
- −$17,290
- Est. tax savings @ 24.0%
- +$4,150
- After-tax cash flow
- $576/yr
For passive investors: Depreciation is non-cash, so a rental often shows a tax loss while cash-flowing — sheltering income. Rental losses are passive: they offset passive income freely, and up to $25,000/yr can offset ordinary (W-2) income if you actively participate and your MAGI is under $100k (phasing out to $0 by $150k); unused losses carry forward. On sale, claimed depreciation is recaptured at up to 25%, and gains may owe capital-gains tax (a 1031 exchange can defer both). Figures are a year-1 estimate at your 24.0% rate — not tax advice; consult a CPA.
Schools (NCES district)
- District
- Katonah-Lewisboro Union Free School District
- NCES district ID
- 3616080
- Math proficiency
- 75% ▼ -8.00%
- Reading proficiency
- 82% ▲ 2.00%
- Median HH income
- $140,994
- Composite
- 75.09/100
- National rank
- #142
- State rank
- #32 of 590 in NY
Livability — West Mountain
No livability data for this city. (Only ~50 U.S. cities are tracked.)
Census & demographics
- Population (ZIP)
- 7,314
Population outlook (Westchester County) Hauer SSP2
- Today (2025)
- 1,028,035 people
- By 2030
- 1,051,636 · +2.3%
- By 2040
- 1,098,520 · +6.9%
- By 2050
- 1,136,044 · +10.5%
- By 2075
- 1,196,925 · +16.4%
- By 2100
- 1,175,147 · +14.3%
Race, ethnicity, and origin ACS 2023
- Neighborhood character
- Predominantly White (84%)
- Race & ethnicity
- White 84% Two or more races 8% Hispanic / Latino 6% Asian 4% Black 1%
- Hispanic origin (detail)
- Puerto Rican 3%
- Common ancestry
- Italian 4% Romanian 3% Scotch-Irish 2%
- Foreign-born
- 13% · Canada, South Korea, Jamaica
- Languages at home
- 90% English-only · Spanish 4% Other Indo-European 2% Korean 1%
Political lean MEDSL · Westchester
- 2024 margin
- Strong D (+26.3) · D 63.1% · R 36.9%
- 2008→2024 swing
- -1.3pp toward R · 2008: 27.6pp · 2024: 26.3pp
- All cycles
- 2024: D+26.3 2020: D+36.3 2016: D+32.8 2012: D+22.2 2008: D+27.6
Not yet ingested
- Civics
- —
Market trends
- HPI YoY
- ▼ -66.87%
- Current HPI
- 150.088
- Rent YoY
- —
- Metro
- —
- State GDP YoY
- ▲ 1.06%
- F500 in state
- 38
Industry mix (Fortune 500 HQ in CT)
| Industry | F500 HQs | Revenue |
|---|---|---|
| Industrial Machinery | 4 | $38B |
|
||
| Insurance | 3 | $71B |
|
||
| Financial Services | 2 | $25B |
|
||
| Transportation / Logistics | 2 | $18B |
|
||
| Healthcare | 1 | $247B |
|
||
| Telecommunications | 1 | $55B |
|
||
Price history
1 event — show timeline
- 2026-05-18 Coming Soon $799,999 OneKey® MLS as Distributed by MLS Grid
Property tax history
+3.7%/yrLatest (2025): $12,841 · +5.7% YoY. Source: county tax records.
Cash-flow waterfall
monthlySold comps — $/sqft
last 12 mo · ≤1 miLoading sold comps…