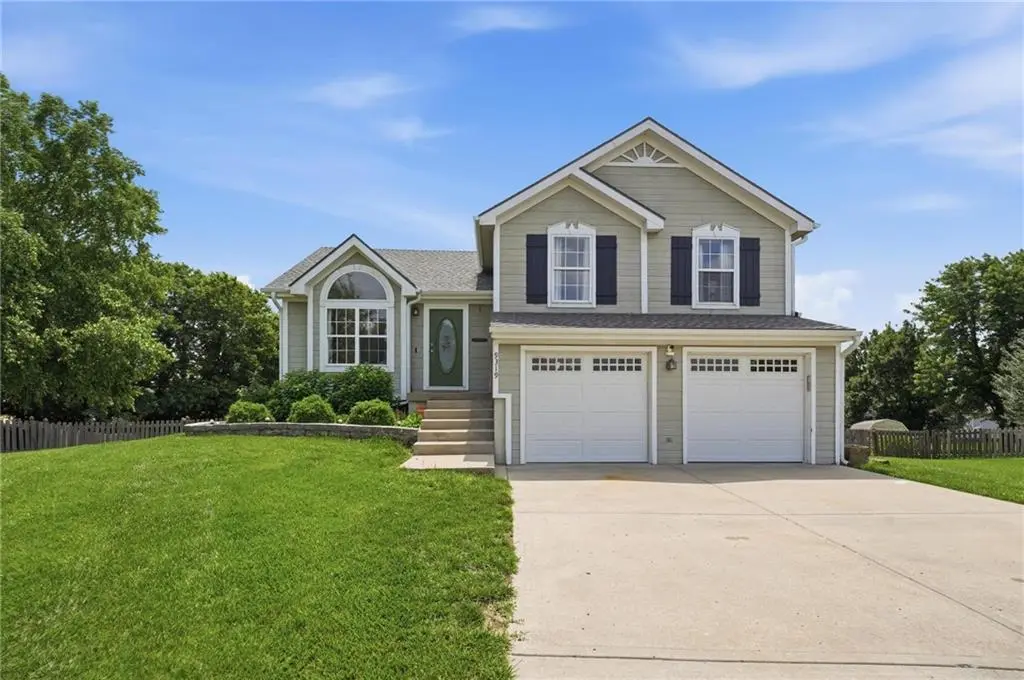
9319 NE 116th Ter · Kansas City, MO
Flood risk 1/10 · Minimal
- FEMA flood zone
- X (unshaded)
- Chance of flooding over 30 yrs
- 0.0%
- Est. flood insurance / yr
- $473 – $860
Fire risk 4/10 · Minor
- Est. fire insurance / yr
- $1,054 – $1,958
Heat risk 4/10 · Minor
- Hot days now (above 105°F)
- 7 days/yr
- Hot days in 30 yrs
- 16 days/yr
Wind risk 2/10 · Minimal
- Chance of severe wind over 30 yrs
- —
Air-quality risk 3/10 · Minor
- Unhealthy air days now
- 3 days/yr
- Unhealthy air days in 30 yrs
- 4 days/yr
Risk factors via First Street. Map © Google.
Why this score? — see what drove the D grade
The composite is a weighted blend of 9 inputs, each scored 0–100. Each bar is that input's sub-score; the figure is the points it added to the 100-point composite (weight × sub-score).
- Cash flow +12.3/30.0
- ARV discount +5.9/15.0
- Rent growth +4.9/5.0
- Schools +4.5/10.0
- Livability +3.9/5.0
- DSCR +3.6/10.0
- 1% rule +3.0/10.0
- Condition / age +2.5/5.0
- Appreciation +0.0/10.0
$335,000
🖨 Deal sheet (PDF) 📄 Offer letter ✓ Due diligence
Listing remarks MLS
Hard to find Side to Side Split! Motivated Seller! Price Reduction!!Beautiful 3 bedroom 2 bath home! Kansas City address in Liberty School District. New Carpet just installed! This home is move in ready! Home features a huge fenced in back yard that can be viewed from the large deck off the open kitchen! Walk-out basement, finished lower level with great room Walk Out Basement Ready To Be Finished For Added Living Space. Open Floor Plan On Main Level. Don't miss out on this one!
Key facts
- Largest backyards
- Quiet cul-de-sac
- Cozy family room
Tags
Neighborhood map
What this means for you Summary
Snapshot
- This is a 3-bed/2.0-bath single-family listed at $335k.
Deal economics
- At list price, monthly cash flow is $-64 ($-771/yr) — negative.
- To cash-flow at today's rent, offer at most $324k (3.4% below list).
- To meet the 1% rule (rent ≥ 1% of price), the offer needs to be $267k (20.2% below list).
- Recommended offer: $267k (20.2% below list) — sets the bar for 1% rule.
- Cap rate 6.1% vs local median 3.9% in Kansas City — top-decile yield for the area; either an underpriced asset or a hidden risk that comps aren't pricing in. Stress-test before assuming the spread holds.
Location & tenants
- Location reads 78/100 on livability (#28 in MO, #2,671 nationally) — a middle-class / working-renter tenant base. Strengths: amenities A+, commute A+, cost of living A+; Watch: crime F.
- Liberty 53 (suburban): math 41% / reading 59% proficiency, ranked #24 of 324 in MO (top 7%) — acceptable for families but not a draw, mixed tenant base, ~2y average lease; only 15% free/reduced lunch — higher-income household profile.
- Zoned schools: Warren Hills Elem. (math 48% / reading 60%, grade C, #215 of 1,115 statewide, top 20%, 603 students, 20% FRL); South Valley Middle (math 33% / reading 53%, grade D-, #134 of 391 statewide, top 35%, 791 students, 18% FRL); Liberty North High School (math 25% / reading 75%, grade D+, #116 of 521 statewide, top 22%, 2,326 students, 18% FRL) — zoned schools at 19% FRL track the district average.
- Market conditions: Rents rising fast (+9.5%/yr); 241 active listings in the ZIP; high-income renter base; 341 units permitted in Clay County in 2024 (40 in 5+ unit buildings).
Forward outlook
- Local home prices are declining (-3.0%/yr); year-one equity from $2k of loan paydown is wiped out by about $10k of value loss. Plan a longer hold.
- Clay County population projected at +24% by 2050 — long-run rental-demand tailwind backs the buy-and-hold thesis.
Negotiation context
- Only 2 days on market — expect competitive offers; lowballing is unlikely to land.
- 4 sale attempts since 22y ago with the ask held roughly flat each time — persistent listings suggest the price (not the market) is what's stuck; bring a comps-based counter.
Questions for the listing agent
- What do current leases actually rent for vs. the listed asking? Can we see a recent rent roll and the last 12 months of T-12 income?
- Is there a deadline driving the sale (1031 exchange, divorce, estate, relocation)? That informs how much negotiation room exists.
- Crime grade is F in this area — have there been break-ins, vandalism, or insurance claims at this property in the last 3 years? What carrier currently insures it and at what premium?
- The area grade is low — what's the realistic commute time and amenity access for the typical tenant pool here? Any planned neighborhood developments (good or bad) we should know about?
- What's the average days-on-market for RENTAL listings here right now (not sales)? A rising rental-DOM trend means longer vacancies and softer asking-rent achievability than the comps imply.
- What's the recent tenant-quality profile in this submarket — average credit score on applications, eviction rate, late-payment / NSF rate, and stable-employment percentage? A property-management company in the area should have these aggregated.
- How much new for-sale + rental construction is in the pipeline within 1–3 miles? Heavy new supply typically softens prices + rents 12–24 months out; constrained supply supports both.
Investment metrics
- 1% rule
- 0.80% ✗
- Cap rate
- 6.06%
- Cash-on-cash
- -0.82%
- DSCR
- 0.96
- GRM
- 10.4
CMA / ARV
- ARV (on-the-fly)
- $323,840
- Comps found
- 12
Show comp detail 12 sales within ~0.75 mi
| Address | Dist | Beds/Ba | Sqft | Sold | Price | $/sf | Match |
|---|---|---|---|---|---|---|---|
| 11709 N Windsor Ave | 0.13mi | 3/2.0 | 1,472 (0%) | 5mo | $430,000 | $292 | 90 |
| 11515 N Ditzler Ave | 0.12mi | 3/2.5 | 1,452 (-1%) | 6mo | $325,000 | $224 | 85 |
| 11502 N Laurel Ave | 0.20mi | 3/2.0 | 1,360 (-8%) | 0mo | $343,000 | $252 | 78 |
| 11424 N Ditzler Ave | 0.22mi | 3/2.5 | 1,572 (+7%) | 0mo | $325,000 | $207 | 76 |
| 8916 NE 114th Ter | 0.35mi | 3/2.0 | 1,560 (+6%) | 0mo | $268,800 | $172 | 74 |
| 8922 NE 114th Ter | 0.33mi | 3/2.0 | 1,569 (+7%) | 1mo | $335,000 | $214 | 73 |
| 11502 N Tennessee Ave | 0.35mi | 3/2.0 | 1,409 (-4%) | 6mo | $310,000 | $220 | 72 |
| 9422 NE 111th Ter | 0.61mi | 3/2.0 | 1,518 (+3%) | 3mo | $458,115 | $302 | 64 |
| 8611 NE 116th St | 0.66mi | 3/2.5 | 1,444 (-2%) | 2mo | $339,900 | $235 | 62 |
| 11428 N Farley Ave | 0.47mi | 3/2.0 | 1,652 (+12%) | 0mo | $325,000 | $197 | 57 |
| 8640 NE 115th Ter | 0.59mi | 3/2.5 | 1,616 (+10%) | 4mo | $339,000 | $210 | 51 |
| 11201 N Lewis Ave | 0.74mi | 3/2.5 | 1,605 (+9%) | 1mo | $345,000 | $215 | 48 |
Match score weights: distance 35% · size 25% · config 20% · recency 20%. Top-matched comps best support the ARV.
Projected returns pro-forma
-3.0% appreciation · 8.0% rent growth · sell at horizon
- IRR
- -12.5%
- Equity multiple
- 0.53×
- Total profit
- $-44,289
- Equity at exit
- $49,950
- IRR
- 2.5%
- Equity multiple
- 1.22×
- Total profit
- $20,305
- Equity at exit
- $28,965
Cash invested: $93,800 (down + closing). Projections, not guarantees.
Landlord ↔ Tenant lean methodology
- Overall (STATE)
- 81 Strongly Landlord-Friendly
- State Missouri
- 81 Strongly Landlord-Friendly · R+10
- County
- — inherits STATE
- City
- — inherits STATE
ZIP-level market 64157
- Home prices YoY
- -18.1%
- Rents YoY
- 9.5%
- Active inventory
- 241
- Price-to-rent
- 10.4×
Monthly cashflow live
- Estimated rent
- $2,674 medium interval (Pro) →
- Mortgage (P&I)
- −$1,757
- Tax from tax record
- −$280 /mo · $3,365/yr
- Insurance
- −$140
- HOA
- −$0
- Vacancy / Maint / Mgmt
- −$562
- Net cashflow
- $-64
Break-even live
Sensitivity live
| Price | -10% $125 | -5% $31 | +0% $-64 | +5% $-159 | +10% $-254 |
|---|---|---|---|---|---|
| Rent | -10% $-275 | -5% $-170 | +0% $-64 | +5% $41 | +10% $147 |
| Rate | -1.0pp $104 | -0.5pp $21 | base $-64 | +0.5pp $-151 | +1.0pp $-239 |
UW: 25.0% down · 7.5% · 30yr · 1.5% tax · 5.0% vac · 8.0% maint · 8.0% mgmt
Financing live
Cash to close
- Down payment
- $83,750
- Closing costs
- $10,050
- Reserves months
- —
- Total cash needed
- —
Loan-product check · same deal, 3 products live
Conventional
25% down · 7.5% · 30yr
- Down + closing
- —
- Monthly P&I
- —
- Monthly cashflow
- —
- DSCR
- —
- Eligible?
- —
Personal DTI + credit; lowest rate.
DSCR
20% down · 8.5% · 30yr
- Down + closing
- —
- Monthly P&I
- —
- Monthly cashflow
- —
- DSCR
- —
- Eligible?
- —
No personal income docs; deal must DSCR.
Hard money
10% down · 12.0% · 12mo
- Down + closing
- —
- Monthly P&I
- —
- Monthly cashflow
- —
- DSCR
- —
- Eligible?
- —
Short-term bridge; refi at stabilization.
Listing history 2 events
-
2026-06-13remarks 699-char remark
-
2026-06-13$335,000 Pending 2 DOM
ⓘ Source: listings_history table (triggers on properties + properties_extension) + one-shot
backfill from property_details.listing_events for pre-trigger history.
Tax reassessment forecast MO · Resets to sale price
- Current annual tax
- $3,365 · $280/mo
- Projected year-2 tax
- $3,365 · $280/mo
- Expected delta
- $0/yr ($0/mo · -0.0%)
ⓘ Screening estimate from a state-policy table — verify with the county assessor before closing.
Climate risk First Street
- Flood 1/10 Low FEMA zone X (unshaded) · 0% chance over 30 yrs
- Wildfire 4/10 Moderate
- Heat 4/10 Moderate 7 d/yr ≥105°F today · 16 d/yr by 30 yrs out
- Wind 2/10 Low
- Air quality 3/10 Moderate 3 unhealthy d/yr today · 4 by 30 yrs out
Nearby sold comps map
Loading sold comps map…
Walkable amenities ~0.75 mi
Loading nearby amenities…
Taxation est. · year 1
- Rental income
- $32,089
- − Mortgage interest
- −$18,765
- − Property taxes
- −$3,365
- − Insurance
- −$1,675
- − Repairs & maintenance
- −$2,567
- − Management
- −$2,567
- − Depreciation
- −$9,745
- Taxable loss
- −$6,596
- Est. tax savings @ 24.0%
- +$1,583
- After-tax cash flow
- $812/yr
For passive investors: Depreciation is non-cash, so a rental often shows a tax loss while cash-flowing — sheltering income. Rental losses are passive: they offset passive income freely, and up to $25,000/yr can offset ordinary (W-2) income if you actively participate and your MAGI is under $100k (phasing out to $0 by $150k); unused losses carry forward. On sale, claimed depreciation is recaptured at up to 25%, and gains may owe capital-gains tax (a 1031 exchange can defer both). Figures are a year-1 estimate at your 24.0% rate — not tax advice; consult a CPA.
Schools (NCES district)
- District
- Liberty 53
- NCES district ID
- 2918540
- Math proficiency
- 41% ▼ -9.00%
- Reading proficiency
- 59% ▼ -3.00%
- Median HH income
- $78,226
- Composite
- 45.41/100
- National rank
- #2624
- State rank
- #24 of 324 in MO
Livability — Kansas City
- Score
- 78/100
- State rank
- #28
- US rank
- #2671
Category grades
Schools grade is shown separately in the Schools card above.
Census & demographics
- Census place
- Kansas City, MO
- County
- Clay County · 220,651 people
- City population
- 439,467
- Metro
- Kansas City, MO-KS
- Population (ZIP)
- 23,030
- Household income
- $149,526
- Rent vs Own
- Severe rent burden
- 87.0
Population outlook (Clay County) Hauer SSP2
- Today (2025)
- 266,022 people
- By 2030
- 280,057 · +5.3%
- By 2040
- 306,153 · +15.1%
- By 2050
- 328,630 · +23.5%
- By 2075
- 375,182 · +41.0%
- By 2100
- 392,861 · +47.7%
Race, ethnicity, and origin ACS 2023
- Neighborhood character
- Predominantly White (82%)
- Race & ethnicity
- White 82% Asian 7% Two or more races 6% Hispanic / Latino 5% Black 3%
- Common ancestry
- Slovak 3% Italian 2% Lithuanian 2%
- Foreign-born
- 6% · Canada, Vietnam, China
- Languages at home
- 92% English-only · Spanish 3% Other Asian/Pacific 2% Vietnamese 1%
Political lean MEDSL · Clay
- 2024 margin
- Lean R (+5.6) · D 46.4% · R 52.0% · Other 1.6%
- 2008→2024 swing
- -4.9pp toward R · 2008: -0.7pp · 2024: -5.6pp
- All cycles
- 2024: R+5.6 2020: R+4.1 2016: R+11.1 2012: R+8.4 2008: R+0.7
Not yet ingested
- Civics
- —
Market trends
- HPI YoY
- ▼ -43.38%
- Current HPI
- 195.9921
- Rent YoY
- ▲ 9.50%
- Metro
- Kansas City, MO-KS
- State GDP YoY
- ▲ 1.84%
- F500 in state
- 20
Industry mix (Fortune 500 HQ in MO)
| Industry | F500 HQs | Revenue |
|---|---|---|
| Healthcare | 1 | $163B |
|
||
| Insurance | 1 | $21B |
|
||
| Industrial Technology | 1 | $17B |
|
||
| Retail | 1 | $16B |
|
||
| Industrial Distribution | 1 | $10B |
|
||
| Utilities | 1 | $9B |
|
||
Price history
+106.9% since first listed12 events — show timeline
- 2026-06-13 Pending — Heartland MLS as Distributed by MLS Grid
- 2026-06-11 Listed $335,000 Heartland MLS as Distributed by MLS Grid
- 2019-08-05 Sold (MLS) — Heartland MLS as Distributed by MLS Grid
- 2019-08-01 Sold (Public Records) — Public Records
- 2019-06-25 Contingent — Heartland MLS as Distributed by MLS Grid
- 2019-06-14 Price Changed $216,500 Heartland MLS as Distributed by MLS Grid
- 2019-05-29 Listed $225,000 Heartland MLS as Distributed by MLS Grid
- 2013-09-04 Sold (Public Records) — Public Records
- 2013-08-28 Sold (MLS) — Heartland MLS as Distributed by MLS Grid
- 2013-06-27 Listed $165,000 Heartland MLS as Distributed by MLS Grid
- 2005-08-12 Sold (MLS) — Heartland MLS as Distributed by MLS Grid
- 2004-07-16 Listed $161,950 Heartland MLS as Distributed by MLS Grid
Property tax history
+2.9%/yrLatest (2025): $3,365 · +8.8% YoY. Source: county tax records.
Cash-flow waterfall
monthlySold comps — $/sqft
last 12 mo · ≤1 miLoading sold comps…