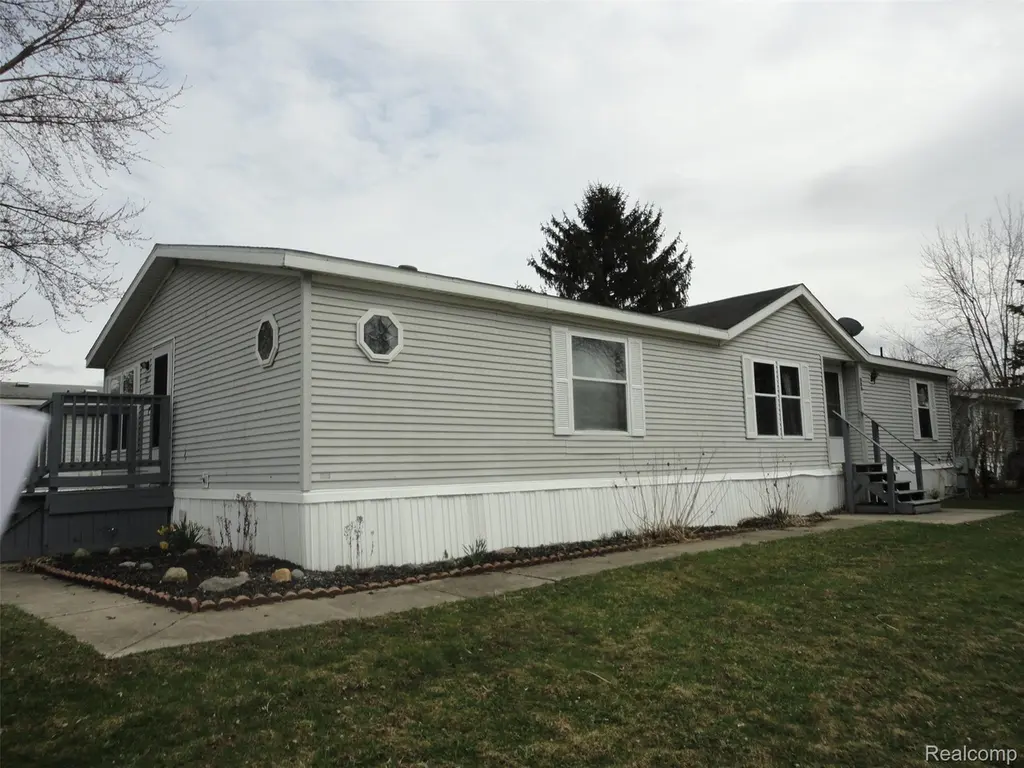
326 Holly Ln · Van Buren, MI
Flood risk No data
- FEMA flood zone
- —
- Chance of flooding over 30 yrs
- —
- Est. flood insurance / yr
- —
Fire risk No data
- Est. fire insurance / yr
- —
Heat risk No data
- Hot days now (above threshold)
- —
- Hot days in 30 yrs
- —
Wind risk No data
- Chance of severe wind over 30 yrs
- —
Air-quality risk No data
- Unhealthy air days now
- —
- Unhealthy air days in 30 yrs
- —
Risk factors via First Street. Map © Google.
Why this score? — see what drove the B- grade
The composite is a weighted blend of 9 inputs, each scored 0–100. Each bar is that input's sub-score; the figure is the points it added to the 100-point composite (weight × sub-score).
- Cash flow +30.0/30.0
- 1% rule +10.0/10.0
- DSCR +10.0/10.0
- ARV discount +7.5/15.0
- Rent growth +3.4/5.0
- Schools +3.3/10.0
- Condition / age +2.8/5.0
- Livability +2.5/5.0
- Appreciation +0.0/10.0
$40,000
🖨 Deal sheet 📄 Offer letter ✓ Due diligence
Listing remarks MLS
Very nice 3 bedroom home with 2 full baths. Home is very clean. This is a manufactured home on a rented lot in Belleville Manor mobile home park, 1996 Fleetwood Serial # INFLT55AB02433LP1.
Key facts
- 3,600 sq ft lot
- Built 1996
- Listed 74 days
Neighborhood map
What this means for you Summary
Snapshot
- This is a 3-bed/2.0-bath single-family listed at $40k. Condition is rated average.
Deal economics
- At list price, monthly cash flow is $382 ($5k/yr) — positive.
- The deal already cash-flows at list — no discount required.
- Meets the 1% rule at list price ($2k rent vs $40k).
- Recommended offer: $38k (6.0% below list) — sets the bar for market timing.
Location & tenants
- Location reads: area grade B — affects rentability + tenant quality, not the cash-flow math above.
- Van Buren Public Schools (suburban): math 33% / reading 43% proficiency, ranked #228 of 540 in MI (top 42%) — families likely to look elsewhere, expect single-tenant / working-renter base with shorter leases.
- Market conditions: Rents rising (+3.6%/yr); 216 active listings in the ZIP; 3 comparable units currently listed for rent nearby; rentals leasing fast (median 3d on market — plan ~1-2 weeks tenant-placement turnaround); solid renter incomes; 2,639 units permitted in Wayne County in 2024 (1,216 in 5+ unit buildings).
Forward outlook
- Local home prices are declining (-3.0%/yr); year-one equity from $277 of loan paydown is wiped out by about $1k of value loss. Plan a longer hold.
- Wayne County population projected at -17% by 2050 — secular population decline; favor cash flow + early exit over multi-decade hold.
- At projected returns (-3.0% appreciation + 3.6% rent growth), your $11k cash investment doubles in ~3 years — after that, you're playing with house money.
Negotiation context
- It's been on market 74 days — a 6% lower offer ($38k) is reasonable based on typical stale-listing flexibility.
- 2 sale attempts with the ask held roughly flat each time — persistent listings suggest the price (not the market) is what's stuck; bring a comps-based counter.
Risks & watch-outs
- Watch-outs: HOA is 39% of rent.
Questions for the listing agent
- It's been on market 74 days. Have you received any prior offers? Is the seller open to a 6% concession, seller financing, or rate buy-down credit?
- What does the HOA fee cover, when was the last increase, and are there any pending special assessments or reserve-fund shortfalls?
- Why hasn't it sold? Are there any deal-killer items the seller is aware of (foundation, flood, title, zoning, code violations)?
- Is there a deadline driving the sale (1031 exchange, divorce, estate, relocation)? That informs how much negotiation room exists.
- What's the average days-on-market for RENTAL listings here right now (not sales)? A rising rental-DOM trend means longer vacancies and softer asking-rent achievability than the comps imply.
- What's the recent tenant-quality profile in this submarket — average credit score on applications, eviction rate, late-payment / NSF rate, and stable-employment percentage? A property-management company in the area should have these aggregated.
- How much new for-sale + rental construction is in the pipeline within 1–3 miles? Heavy new supply typically softens prices + rents 12–24 months out; constrained supply supports both.
Investment metrics
- 1% rule
- 4.14% ✓
- Cap rate
- 17.74%
- Cash-on-cash
- 40.88%
- DSCR
- 2.82
- GRM
- 2.0
CMA / ARV
- ARV (median comp)
- $247,530
- List price
- $40,000
- Delta
- -83.84%
- Verdict
- UNDERPRICED
- Comps
- 20 within 1.0 mi
Show comp detail 7 sales within ~0.75 mi
| Address | Dist | Beds/Ba | Sqft | Sold | Price | $/sf | Match |
|---|---|---|---|---|---|---|---|
| 142 Cherry lane E Cherry Lane Ln | 0.22mi | 3/2.0 | 1,600 (+14%) | 10mo | $38,900 | $24 | 58 |
| 43948 Robson Rd | 0.74mi | 3/2.0 | 1,400 (0%) | 11mo | $190,000 | $136 | 56 |
| 6 Ponderosa Trl S | 0.19mi | 3/2.0 | 1,200 (-14%) | 13mo | $46,000 | $38 | 56 |
| 7837 Mida Dr | 0.71mi | 4/2.0 (+1) | 1,375 (-2%) | 4mo | $275,000 | $200 | 55 |
| 10560 Dewitt Rd | 0.70mi | 3/1.5 | 1,368 (-2%) | 20mo | $234,900 | $172 | 45 |
| 7836 Mida Dr | 0.69mi | 3/1.5 | 1,485 (+6%) | 15mo | $263,000 | $177 | 43 |
| 10351 Endicott St | 0.68mi | 4/2.0 (+1) | 1,584 (+13%) | 11mo | $296,250 | $187 | 32 |
Match score weights: distance 35% · size 25% · config 20% · recency 20%. Top-matched comps best support the ARV.
Projected returns pro-forma
-3.0% appreciation · 3.64% rent growth · sell at horizon
- IRR
- 39.4%
- Equity multiple
- 2.72×
- Total profit
- $19,314
- Equity at exit
- $5,964
- IRR
- 46.6%
- Equity multiple
- 5.85×
- Total profit
- $54,290
- Equity at exit
- $3,458
Cash invested: $11,200 (down + closing). Projections, not guarantees.
Landlord ↔ Tenant lean methodology
- Overall (STATE)
- 62 Landlord-Friendly
- State Michigan
- 62 Landlord-Friendly · EVEN
- County
- — inherits STATE
- City
- — inherits STATE
ZIP-level market 48111
- Rents YoY
- 3.6%
- Active inventory
- 216
- Price-to-rent
- 2.0×
Monthly cashflow live
- Estimated rent
- $1,656 medium interval (Pro) →
- Mortgage (P&I)
- −$210
- Tax est. 1.5%
- −$50 /mo · $600/yr
- Insurance
- −$17
- HOA
- −$650
- Vacancy / Maint / Mgmt
- −$348
- Net cashflow
- $382
Break-even live
UW: 25.0% down · 7.5% · 30yr · 1.5% tax · 5.0% vac · 8.0% maint · 8.0% mgmt
Financing live
Cash to close
- Down payment
- $10,000
- Closing costs
- $1,200
- Reserves months
- —
- Total cash needed
- —
Loan-product check · same deal, 3 products live
Conventional
25% down · 7.5% · 30yr
- Down + closing
- —
- Monthly P&I
- —
- Monthly cashflow
- —
- DSCR
- —
- Eligible?
- —
Personal DTI + credit; lowest rate.
DSCR
20% down · 8.5% · 30yr
- Down + closing
- —
- Monthly P&I
- —
- Monthly cashflow
- —
- DSCR
- —
- Eligible?
- —
No personal income docs; deal must DSCR.
Hard money
10% down · 12.0% · 12mo
- Down + closing
- —
- Monthly P&I
- —
- Monthly cashflow
- —
- DSCR
- —
- Eligible?
- —
Short-term bridge; refi at stabilization.
Rent comps 3 comps
| Address | Beds | Baths | Sqft | Rent | $/sqft | DOM | Units | Dist |
|---|---|---|---|---|---|---|---|---|
| 10341 Westlake Cir Belleville, MI | 1.0–2.0 | 1.0–2.0 | 895 | $1,820 | $2.03 | 2d | 10 | 0.62mi |
| 46161 Village Green Ln Unit A344 Van Buren Township, MI | 2.0 | 1.0 | 970 | $1,299 | $1.34 | 17d | 1 | 1.35mi |
| 10830 Oak Ln Belleville, MI | 1.0–2.0 | 1.0 | 820 | $1,536 | $1.87 | 2d | 45 | 1.41mi |
HOA detail
- Monthly dues
- $650 · $7,800/yr
Listing history 15 events
-
2026-06-18days on market $40,000 Active 74 DOM
-
2026-06-17days on market $40,000 Active 73 DOM
-
2026-06-16days on market $40,000 Active 72 DOM
-
2026-06-15days on market $40,000 Active 71 DOM
-
2026-06-13days on market $40,000 Active 69 DOM
-
2026-06-09days on market $40,000 Active 65 DOM
-
2026-06-08days on market $40,000 Active 64 DOM
-
2026-06-07days on market $40,000 Active 63 DOM
-
2026-06-04days on market $40,000 Active 60 DOM
-
2026-06-03days on market $40,000 Active 59 DOM
-
2026-06-02days on market $40,000 Active 58 DOM
-
2026-06-01days on market $40,000 Active 57 DOM
-
2026-05-31days on market $40,000 Active 56 DOM
-
2026-04-05$40,000 Active 188-char remark
Show marketing remark (188 chars)
Very nice 3 bedroom home with 2 full baths. Home is very clean. This is a manufactured home on a rented lot in Belleville Manor mobile home park, 1996 Fleetwood Serial # INFLT55AB02433LP1.
-
2026-04-05$40,000 Active 188-char remark
Show marketing remark (188 chars)
Very nice 3 bedroom home with 2 full baths. Home is very clean. This is a manufactured home on a rented lot in Belleville Manor mobile home park, 1996 Fleetwood Serial # INFLT55AB02433LP1.
ⓘ Source: listings_history table (triggers on properties + properties_extension) + one-shot
backfill from property_details.listing_events for pre-trigger history.
Nearby sold comps map
Loading sold comps map…
Walkable amenities ~0.75 mi
Loading nearby amenities…
Taxation est. · year 1
- Rental income
- $19,867
- − Mortgage interest
- −$2,241
- − Property taxes
- −$600
- − Insurance
- −$200
- − Repairs & maintenance
- −$1,589
- − Management
- −$1,589
- − HOA
- −$7,800
- − Depreciation
- −$1,164
- Taxable income
- $4,684
- Est. tax owed @ 24.0%
- −$1,124
- After-tax cash flow
- $3,454/yr
For passive investors: Depreciation is non-cash, so a rental often shows a tax loss while cash-flowing — sheltering income. Rental losses are passive: they offset passive income freely, and up to $25,000/yr can offset ordinary (W-2) income if you actively participate and your MAGI is under $100k (phasing out to $0 by $150k); unused losses carry forward. On sale, claimed depreciation is recaptured at up to 25%, and gains may owe capital-gains tax (a 1031 exchange can defer both). Figures are a year-1 estimate at your 24.0% rate — not tax advice; consult a CPA.
Condition & rehab AI · 3 photos
This 3-bedroom home in a mobile home park has average condition with some light wear. It could benefit from painting, landscaping, and flooring updates to increase its value.
Repairs flagged
- Minor Paint — Paint appears faded and could be refreshed
- Minor Siding — Light wear on siding
Value-add opportunities
- Both Paint — Refreshing the paint can improve both resale and rental value
- Both Landscaping — Aesthetic improvements can enhance curb appeal and value
- Both Flooring — Updating the flooring can improve both resale and rental value
Renovation cost estimate screening
| Repair item | Severity | Est. cost |
|---|---|---|
| Paint · Paint appears faded and could be refreshed | Minor | $500–3,000 |
| Siding · Light wear on siding | Minor | $500–3,000 |
| Total estimated repair cost · 2 items | $1,000–6,000 |
Value-add ROI direction
- Both Paint — Refreshing the paint can improve both resale and rental value ↑
- Both Landscaping — Aesthetic improvements can enhance curb appeal and value ↑
- Both Flooring — Updating the flooring can improve both resale and rental value ↑
ⓘ Cost ranges are severity-bucket heuristics (US national rule-of-thumb). Get contractor quotes + a written scope before underwriting a rehab budget.
Schools (NCES district)
- District
- Van Buren Public Schools
- NCES district ID
- 2634560
- Math proficiency
- 33% ▲ 6.00%
- Reading proficiency
- 43% ▲ 6.00%
- Median HH income
- $54,166
- Composite
- 33.2/100
- National rank
- #5533
- State rank
- #228 of 540 in MI
Livability — Van Buren
No livability data for this city. (Only ~50 U.S. cities are tracked.)
Census & demographics
- County
- Wayne County · 1,562,939 people
- Metro
- Detroit-Warren-Dearborn, MI
- Population (ZIP)
- 44,709
- Household income
- $76,595
- Rent vs Own
- Severe rent burden
- 1200.0
Population outlook (Wayne County) Hauer SSP2
- Today (2025)
- 1,675,273 people
- By 2030
- 1,620,300 · -3.3%
- By 2040
- 1,502,341 · -10.3%
- By 2050
- 1,384,039 · -17.4%
- By 2075
- 1,124,592 · -32.9%
- By 2100
- 881,193 · -47.4%
Race, ethnicity, and origin ACS 2023
- Neighborhood character
- Predominantly White (66%)
- Race & ethnicity
- White 66% Black 22% Two or more races 7% Hispanic / Latino 4% Asian 2%
- Common ancestry
- Romanian 8% Lithuanian 3% Slovak 3%
- Foreign-born
- 4% · Canada
- Languages at home
- 95% English-only · Spanish 1% Other Indo-European 1% Arabic 1%
Political lean MEDSL · Wayne
- 2024 margin
- Strong D (+29.0) · D 62.7% · R 33.7% · Other 3.6%
- 2008→2024 swing
- -20.5pp toward R · 2008: 49.5pp · 2024: 29.0pp
- All cycles
- 2024: D+29.0 2020: D+38.1 2016: D+37.3 2012: D+46.9 2008: D+49.5
Not yet ingested
- Civics
- —
Market trends
- HPI YoY
- ▼ -238.11%
- Current HPI
- 236.4458
- Rent YoY
- ▲ 3.64%
- Metro
- Detroit-Warren-Dearborn, MI
- State GDP YoY
- ▲ 1.37%
- F500 in state
- 28
Industry mix (Fortune 500 HQ in MI)
| Industry | F500 HQs | Revenue |
|---|---|---|
| Automotive Parts | 3 | $48B |
|
||
| Automotive | 2 | $372B |
|
||
| Chemicals | 1 | $45B |
|
||
| Automotive Retail | 1 | $29B |
|
||
| Healthcare / Medical Devices | 1 | $23B |
|
||
| Automotive Technology | 1 | $20B |
|
||
Price history
+0.0% since first listed2 events — show timeline
- 2026-04-05 Listed $40,000 REALCOMP
- 2026-04-05 Listed $40,000 MiRealSource-MiMLS
Cash-flow waterfall
monthlySold comps — $/sqft
last 12 mo · ≤1 miLoading sold comps…