None · Breckenridge Hills, MO
Flood risk 1/10 · Minimal
- FEMA flood zone
- X (unshaded)
- Chance of flooding over 30 yrs
- 0.0%
- Est. flood insurance / yr
- $473 – $860
Fire risk 1/10 · Minimal
- Est. fire insurance / yr
- $1,054 – $1,958
Heat risk 4/10 · Minor
- Hot days now (above 106°F)
- 7 days/yr
- Hot days in 30 yrs
- 20 days/yr
Wind risk 2/10 · Minimal
- Chance of severe wind over 30 yrs
- 1.0%
Air-quality risk 2/10 · Minimal
- Unhealthy air days now
- 1 days/yr
- Unhealthy air days in 30 yrs
- 3 days/yr
Risk factors via First Street. Map © Google.
Why this score? — see what drove the B grade
The composite is a weighted blend of 9 inputs, each scored 0–100. Each bar is that input's sub-score; the figure is the points it added to the 100-point composite (weight × sub-score).
- Cash flow +30.0/30.0
- ARV discount +15.0/15.0
- DSCR +10.0/10.0
- 1% rule +8.8/10.0
- Livability +3.4/5.0
- Rent growth +3.0/5.0
- Condition / age +2.5/5.0
- Schools +1.7/10.0
- Appreciation +0.0/10.0
$109,900
🖨 Deal sheet 📄 Offer letter ✓ Due diligence
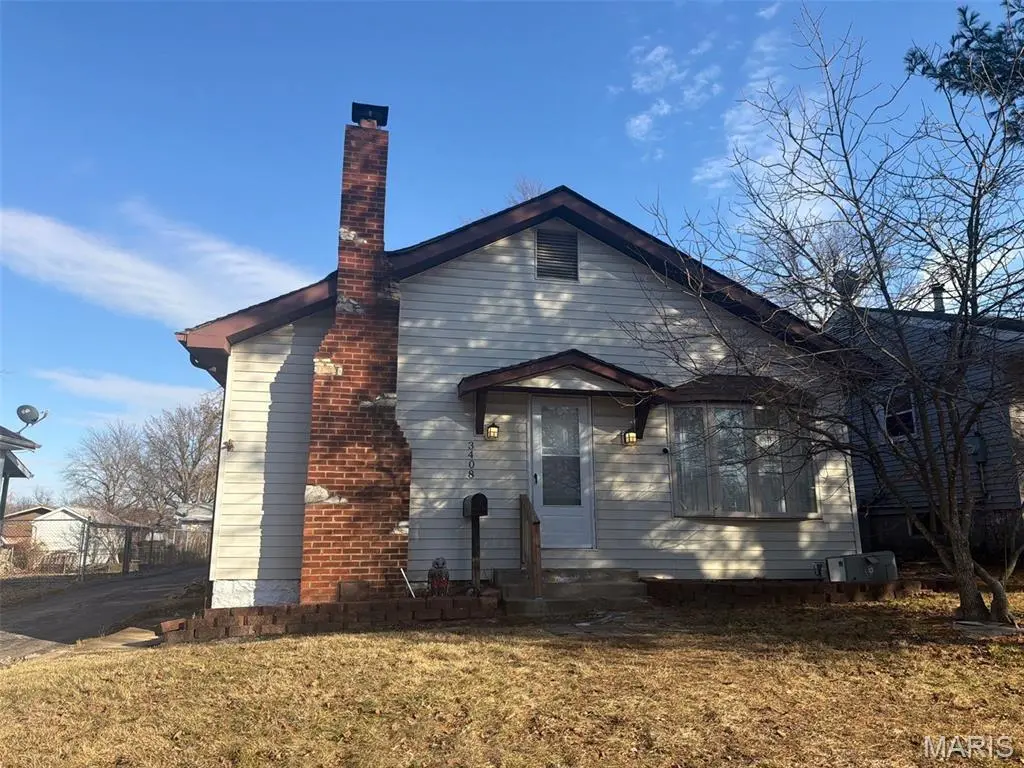
Listing remarks MLS
Welcome to this charming bungalow that perfectly blends vintage character with modern updates. Tucked away on a quiet street in Breckenridge Hills, this ranch-style home greets you with a bright, open living space ideal for chilly Missouri evenings. The layout offers a functional flow with three bedrooms and two bathrooms, providing more space than your typical bungalow. The kitchen and dining areas lead naturally through the home, while the basement offers extra storage or the potential for a workshop.
Key facts
- Quiet street
- Vintage character
- Modern updates
Tags
Neighborhood map
What this means for you Summary
Snapshot
- This is a 3-bed/2.0-bath single-family listed at $110k.
Deal economics
- At list price, monthly cash flow is $414 ($5k/yr) — positive.
- The deal already cash-flows at list — no discount required.
- Meets the 1% rule at list price ($2k rent vs $110k).
- Recommended offer: $100k (9.0% below list) — sets the bar for market timing.
Location & tenants
- Location reads 68/100 on livability (#193 in MO) — a middle-class / working-renter tenant base. Strengths: cost of living A+, housing A+; Watch: crime C-, employment D+, schools F.
- Ritenour (suburban): math 13% / reading 27% proficiency, ranked #304 of 324 in MO (top 94%) — low school quality limits family demand, transient renter base, plan for 1-2y turnover; 66% free/reduced lunch — lower-income household profile, screen leases tightly.
- Market conditions: Rents rising (+2.0%/yr); 118 active listings in the ZIP; 19 comparable units currently listed for rent nearby; rentals at typical pace (median 24d on market — plan ~3-4 weeks tenant-placement turnaround); 47% of comp listings sitting > 30 days — soft ceiling on asking rent; 920 units permitted in St. Louis County in 2024 (250 in 5+ unit buildings).
- This rent runs 32% of the median local income ($56k/yr) — at the standard rent-burdened threshold; future hikes will face affordability resistance.
Forward outlook
- Local home prices are declining (-3.0%/yr); year-one equity from $760 of loan paydown is wiped out by about $3k of value loss. Plan a longer hold.
- At projected returns (-3.0% appreciation + 2.0% rent growth), your $31k cash investment doubles in ~9 years — after that, you're playing with house money.
Negotiation context
- It's been on market 120 days — a 9% lower offer ($100k) is reasonable based on typical stale-listing flexibility.
- 3 sale attempts since 2y ago; this cycle's ask has dropped $35k (24%) from the opening price — seller is motivated, your offer sets the floor, not the list.
Risks & watch-outs
- Watch-outs: built in 1925 — expect roof / HVAC / electrical / plumbing capex.
Questions for the listing agent
- It's been on market 120 days. Have you received any prior offers? Is the seller open to a 9% concession, seller financing, or rate buy-down credit?
- Built in 1925 — when were the roof, HVAC, electrical panel, plumbing, and water heater last replaced?
- Why hasn't it sold? Are there any deal-killer items the seller is aware of (foundation, flood, title, zoning, code violations)?
- Is there a deadline driving the sale (1031 exchange, divorce, estate, relocation)? That informs how much negotiation room exists.
- Schools are F-rated, which usually means shorter tenancies and higher turnover. Who's the typical renter profile here, and what's been the actual vacancy rate?
- What's the average days-on-market for RENTAL listings here right now (not sales)? A rising rental-DOM trend means longer vacancies and softer asking-rent achievability than the comps imply.
- What's the recent tenant-quality profile in this submarket — average credit score on applications, eviction rate, late-payment / NSF rate, and stable-employment percentage? A property-management company in the area should have these aggregated.
- How much new for-sale + rental construction is in the pipeline within 1–3 miles? Heavy new supply typically softens prices + rents 12–24 months out; constrained supply supports both.
Investment metrics
- 1% rule
- 1.38% ✓
- Cap rate
- 10.81%
- Cash-on-cash
- 16.14%
- DSCR
- 1.72
- GRM
- 6.1
CMA / ARV
- ARV (median comp)
- $137,745
- List price
- $109,900
- Delta
- -20.22%
- Verdict
- UNDERPRICED
- Comps
- 20 within 1.0 mi
Show comp detail 12 sales within ~0.75 mi
| Address | Dist | Beds/Ba | Sqft | Sold | Price | $/sf | Match |
|---|---|---|---|---|---|---|---|
| 3360 Suncrest Ave | 0.21mi | 3/2.0 | 1,400 (-4%) | 1mo | $274,900 | $196 | 83 |
| 9844 Mecca Ln | 0.29mi | 2/1.0 (-1) | 1,517 (+4%) | 0mo | $189,900 | $125 | 70 |
| 3007 Wismer Ave | 0.58mi | 3/2.0 | 1,434 (-2%) | 4mo | $120,000 | $84 | 67 |
| 3434 Wismer Rd | 0.31mi | 3/2.5 | 1,356 (-7%) | 8mo | $185,000 | $136 | 65 |
| 3222 W Tennyson Ave | 0.35mi | 3/1.0 | 1,312 (-10%) | 6mo | $64,900 | $49 | 58 |
| 3311 Calvert Ave | 0.33mi | 3/1.0 | 1,272 (-13%) | 1mo | $69,000 | $54 | 58 |
| 3643 Elsa Ave | 0.50mi | 3/2.0 | 1,304 (-10%) | 7mo | $85,000 | $65 | 53 |
| 3246 Saint Joachim Ln | 0.66mi | 3/1.0 | 1,398 (-4%) | 8mo | $180,000 | $129 | 52 |
| 3240 Lynros Dr | 0.74mi | 3/1.0 | 1,367 (-6%) | 1mo | $138,000 | $101 | 50 |
| 9627 Corregidor Dr | 0.66mi | 3/1.0 | 1,355 (-7%) | 8mo | $160,000 | $118 | 47 |
| 9509 Harold Dr | 0.58mi | 3/1.5 | 1,257 (-14%) | 5mo | $69,900 | $56 | 44 |
| 10027 Breckenridge Rd | 0.62mi | 3/2.0 | 1,654 (+14%) | 7mo | $139,900 | $85 | 42 |
Match score weights: distance 35% · size 25% · config 20% · recency 20%. Top-matched comps best support the ARV.
Projected returns pro-forma
-3.0% appreciation · 2.04% rent growth · sell at horizon
- IRR
- 6.0%
- Equity multiple
- 1.23×
- Total profit
- $7,133
- Equity at exit
- $16,386
- IRR
- 14.5%
- Equity multiple
- 2.12×
- Total profit
- $34,467
- Equity at exit
- $9,502
Cash invested: $30,772 (down + closing). Projections, not guarantees.
Landlord ↔ Tenant lean methodology
- Overall (STATE)
- 81 Strongly Landlord-Friendly
- State Missouri
- 81 Strongly Landlord-Friendly · R+10
- County
- — inherits STATE
- City
- — inherits STATE
ZIP-level market 63114
- Rents YoY
- 2.0%
- Active inventory
- 118
- Price-to-rent
- 6.1×
Monthly cashflow live
- Estimated rent
- $1,513 high interval (Pro) →
- Mortgage (P&I)
- −$576
- Tax from tax record
- −$159 /mo · $1,909/yr
- Insurance
- −$46
- HOA
- −$0
- Vacancy / Maint / Mgmt
- −$318
- Net cashflow
- $414
Break-even live
UW: 25.0% down · 7.5% · 30yr · 1.5% tax · 5.0% vac · 8.0% maint · 8.0% mgmt
Financing live
Cash to close
- Down payment
- $27,475
- Closing costs
- $3,297
- Reserves months
- —
- Total cash needed
- —
Loan-product check · same deal, 3 products live
Conventional
25% down · 7.5% · 30yr
- Down + closing
- —
- Monthly P&I
- —
- Monthly cashflow
- —
- DSCR
- —
- Eligible?
- —
Personal DTI + credit; lowest rate.
DSCR
20% down · 8.5% · 30yr
- Down + closing
- —
- Monthly P&I
- —
- Monthly cashflow
- —
- DSCR
- —
- Eligible?
- —
No personal income docs; deal must DSCR.
Hard money
10% down · 12.0% · 12mo
- Down + closing
- —
- Monthly P&I
- —
- Monthly cashflow
- —
- DSCR
- —
- Eligible?
- —
Short-term bridge; refi at stabilization.
Rent comps 19 comps
| Address | Beds | Baths | Sqft | Rent | $/sqft | DOM | Units | Dist |
|---|---|---|---|---|---|---|---|---|
| 3213 Airway Ave Saint Louis, MO | 3.0 | 1.0 | 1215 | $1,550 | $1.28 | 43d | 1 | 0.27mi |
| 3434 Sims Ave Saint Ann, MO | 3.0 | 1.5 | 988 | $1,545 | $1.56 | 43d | 1 | 0.35mi |
| 3648 Edmundson Rd Unit 1 St. Louis, MO | 2.0 | 1.0 | 900 | $995 | $1.11 | 43d | 1 | 0.36mi |
| 3209 Dix Ave Saint Louis, MO | 3.0 | 1.0 | 1122 | $1,550 | $1.38 | 23d | 1 | 0.37mi |
| 9618 De Porres Ln Saint Louis, MO | 2.0 | 1.0 | 875 | $1,200 | $1.37 | 43d | 1 | 0.48mi |
| 9457 Harold Dr Saint Louis, MO | 3.0 | 1.0 | 1472 | $1,530 | $1.04 | 21d | 1 | 0.60mi |
| 10116 Saint Katherine Ln Saint Ann, MO | 3.0 | 1.0 | 984 | $1,865 | $1.90 | 17d | 1 | 0.61mi |
| 9429 Baltimore Ave Saint Louis, MO | 2.0 | 1.0 | 900 | $1,200 | $1.33 | 23d | 1 | 0.62mi |
| 9807 Guthrie Ave Saint Louis, MO | 3.0 | 2.0 | 1068 | $1,700 | $1.59 | 23d | 1 | 0.71mi |
| 3529 Saint Joachim Ln Saint Ann, MO | 2.0 | 1.0 | 900 | $1,450 | $1.61 | 23d | 1 | 0.79mi |
| 3529 Saint Joachim Ln Unit NA St Ann, MO | 2.0 | 1.0 | 900 | $1,450 | $1.61 | 20d | 1 | 0.79mi |
| 4204 Beauty Ln Saint Louis, MO | 4.0 | 1.5 | 1299 | $1,690 | $1.30 | 43d | 1 | 0.85mi |
| 9183 Harold Dr Saint Louis, MO | 3.0 | 1.0 | 912 | $1,200 | $1.32 | 43d | 1 | 0.85mi |
| 10069 Livingston Ave St Ann, MO | 2.0 | 1.0 | 875 | $1,100 | $1.26 | 23d | 1 | 0.91mi |
| 4400 Gordon Ave Saint Louis, MO | 3.0 | 2.0 | 1500 | $1,800 | $1.20 | 4d | 1 | 1.06mi |
| 8821 McNulty Dr St. Louis, MO | 2.0 | 1.0 | 1504 | $1,225 | $0.81 | 43d | 1 | 1.18mi |
| 4120 Geraldine Ave St Ann, MO | 2.0 | 1.5 | 922 | $1,200 | $1.30 | 17d | 1 | 1.20mi |
| 10145 Cabana Club Dr St Ann, MO | 1.0–2.0 | 1.0–2.0 | 776 | $1,060 | $1.37 | 43d | 8 | 1.33mi |
| 8601 Belhaven Dr Saint Louis, MO | 4.0 | 1.5 | 1507 | $1,850 | $1.23 | 43d | 1 | 1.48mi |
Listing history 19 events
-
2026-06-18days on market $109,900 Active 120 DOM
-
2026-06-17days on market $109,900 Active 119 DOM
-
2026-06-16days on market $109,900 Active 118 DOM
-
2026-06-15days on market $109,900 Active 117 DOM
-
2026-06-13pricedays on market $109,900 Active 115 DOM
-
2026-06-09days on market $119,900 Active 111 DOM
-
2026-06-08days on market $119,900 Active 110 DOM
-
2026-06-07days on market $119,900 Active 109 DOM
-
2026-06-03days on market $119,900 Active 105 DOM
-
2026-06-02days on market $119,900 Active 104 DOM
-
2026-06-01days on market $119,900 Active 103 DOM
-
2026-05-31days on market $119,900 Active 102 DOM
-
2026-05-08price $119,900 508-char remark
Show marketing remark (508 chars)
Welcome to this charming bungalow that perfectly blends vintage character with modern updates. Tucked away on a quiet street in Breckenridge Hills, this ranch-style home greets you with a bright, open living space ideal for chilly Missouri evenings. The layout offers a functional flow with three bedrooms and two bathrooms, providing more space than your typical bungalow. The kitchen and dining areas lead naturally through the home, while the basement offers extra storage or the potential for a workshop.
-
2026-03-30price $134,900 508-char remark
Show marketing remark (508 chars)
Welcome to this charming bungalow that perfectly blends vintage character with modern updates. Tucked away on a quiet street in Breckenridge Hills, this ranch-style home greets you with a bright, open living space ideal for chilly Missouri evenings. The layout offers a functional flow with three bedrooms and two bathrooms, providing more space than your typical bungalow. The kitchen and dining areas lead naturally through the home, while the basement offers extra storage or the potential for a workshop.
-
2026-02-18$144,900 Active 508-char remark
Show marketing remark (508 chars)
Welcome to this charming bungalow that perfectly blends vintage character with modern updates. Tucked away on a quiet street in Breckenridge Hills, this ranch-style home greets you with a bright, open living space ideal for chilly Missouri evenings. The layout offers a functional flow with three bedrooms and two bathrooms, providing more space than your typical bungalow. The kitchen and dining areas lead naturally through the home, while the basement offers extra storage or the potential for a workshop.
-
2025-03-31status Active
-
2025-02-21status Pending
-
2024-12-12$144,000 Active
-
1987-10-01soldstatus
ⓘ Source: listings_history table (triggers on properties + properties_extension) + one-shot
backfill from property_details.listing_events for pre-trigger history.
Tax reassessment forecast MO · Resets to sale price
- Current annual tax
- $1,909 · $159/mo
- Projected year-2 tax
- $1,909 · $159/mo
- Expected delta
- $0/yr ($0/mo · 0.0%)
ⓘ Screening estimate from a state-policy table — verify with the county assessor before closing.
Climate risk First Street
- Flood 1/10 Low FEMA zone X (unshaded) · 0% chance over 30 yrs
- Wildfire 1/10 Low
- Heat 4/10 Moderate 7 d/yr ≥106°F today · 20 d/yr by 30 yrs out
- Wind 2/10 Low 100% chance of damaging wind over 30 yrs
- Air quality 2/10 Low 1 unhealthy d/yr today · 3 by 30 yrs out
Nearby sold comps map
Loading sold comps map…
Walkable amenities ~0.75 mi
Loading nearby amenities…
Taxation est. · year 1
- Rental income
- $18,151
- − Mortgage interest
- −$6,156
- − Property taxes
- −$1,909
- − Insurance
- −$550
- − Repairs & maintenance
- −$1,452
- − Management
- −$1,452
- − Depreciation
- −$3,197
- Taxable income
- $3,435
- Est. tax owed @ 24.0%
- −$825
- After-tax cash flow
- $4,141/yr
For passive investors: Depreciation is non-cash, so a rental often shows a tax loss while cash-flowing — sheltering income. Rental losses are passive: they offset passive income freely, and up to $25,000/yr can offset ordinary (W-2) income if you actively participate and your MAGI is under $100k (phasing out to $0 by $150k); unused losses carry forward. On sale, claimed depreciation is recaptured at up to 25%, and gains may owe capital-gains tax (a 1031 exchange can defer both). Figures are a year-1 estimate at your 24.0% rate — not tax advice; consult a CPA.
Schools (NCES district)
- District
- Ritenour
- NCES district ID
- 2926640
- Math proficiency
- 13% ▼ -14.00%
- Reading proficiency
- 27% ▼ -7.00%
- Median HH income
- $41,410
- Composite
- 17.04/100
- National rank
- #9125
- State rank
- #304 of 324 in MO
Livability — Breckenridge Hills
- Score
- 68/100
- State rank
- #193
- US rank
- #10013
Category grades
Schools grade is shown separately in the Schools card above.
Census & demographics
- Census place
- Breckenridge Hills, MO
- County
- Saint Louis County · 888,823 people
- City population
- 33,969
- Metro
- St. Louis, MO-IL
- Population (ZIP)
- 33,969
- Household income
- $55,870
- Rent vs Own
- Severe rent burden
- 1595.0
Population outlook (St. Louis County) Hauer SSP2
- Today (2025)
- 1,025,227 people
- By 2030
- 1,028,023 · +0.3%
- By 2040
- 1,020,940 · -0.4%
- By 2050
- 1,007,280 · -1.8%
- By 2075
- 987,277 · -3.7%
- By 2100
- 921,984 · -10.1%
Race, ethnicity, and origin ACS 2023
- Neighborhood character
- Diverse neighborhood (Simpson 0.64)
- Race & ethnicity
- White 50% Black 30% Hispanic / Latino 11% Two or more races 6% Asian 2%
- Hispanic origin (detail)
- Mexican 7%
- Common ancestry
- Lithuanian 3% Italian 2% Romanian 1%
- Foreign-born
- 9% · Canada, Vietnam
- Languages at home
- 84% English-only · Spanish 10% French/Haitian/Cajun 2% Tagalog/Filipino 1%
Political lean MEDSL · St. Louis
- 2024 margin
- Strong D (+23.4) · D 60.8% · R 37.4% · Other 1.7%
- 2008→2024 swing
- +3.5pp toward D · 2008: 19.9pp · 2024: 23.4pp
- All cycles
- 2024: D+23.4 2020: D+24.0 2016: D+16.2 2012: D+13.7 2008: D+19.9
Not yet ingested
- Civics
- —
Market trends
- HPI YoY
- ▼ -276.62%
- Current HPI
- 223.9305
- Rent YoY
- ▲ 2.04%
- Metro
- St. Louis, MO-IL
- State GDP YoY
- ▲ 1.84%
- F500 in state
- 20
Industry mix (Fortune 500 HQ in MO)
| Industry | F500 HQs | Revenue |
|---|---|---|
| Healthcare | 1 | $163B |
|
||
| Insurance | 1 | $21B |
|
||
| Industrial Technology | 1 | $17B |
|
||
| Retail | 1 | $16B |
|
||
| Industrial Distribution | 1 | $10B |
|
||
| Utilities | 1 | $9B |
|
||
Price history
-16.7% since first listed7 events — show timeline
- 2026-05-08 Price Changed $119,900 MARIS as Distributed by MLS Grid
- 2026-03-30 Price Changed $134,900 MARIS as Distributed by MLS Grid
- 2026-02-18 Listed $144,900 MARIS as Distributed by MLS Grid
- 2025-03-31 Relisted — MARIS as Distributed by MLS Grid
- 2025-02-21 Pending — MARIS as Distributed by MLS Grid
- 2024-12-12 Listed $144,000 MARIS as Distributed by MLS Grid
- 1987-10-01 Sold (Public Records) — Public Records
Property tax history
+4.2%/yrLatest (2022): $1,909 · +0.2% YoY. Source: county tax records.
Cash-flow waterfall
monthlySold comps — $/sqft
last 12 mo · ≤1 miLoading sold comps…