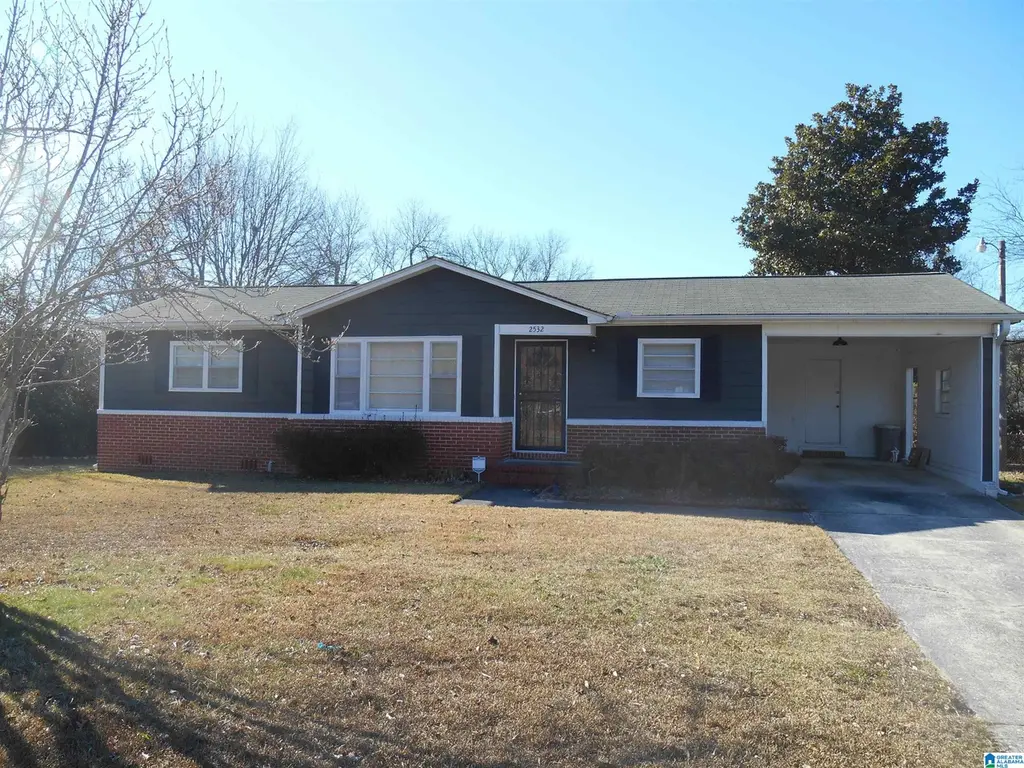
2532 2nd Pl NW · Center Point, AL
Flood risk 1/10 · Minimal
- FEMA flood zone
- X (unshaded)
- Chance of flooding over 30 yrs
- 0.0%
- Est. flood insurance / yr
- $507 – $1,088
Fire risk 2/10 · Minimal
- Est. fire insurance / yr
- $916 – $1,700
Heat risk 5/10 · Moderate
- Hot days now (above 106°F)
- 7 days/yr
- Hot days in 30 yrs
- 19 days/yr
Wind risk 6/10 · Moderate
- Chance of severe wind over 30 yrs
- 27.0%
Air-quality risk 5/10 · Moderate
- Unhealthy air days now
- 6 days/yr
- Unhealthy air days in 30 yrs
- 11 days/yr
Risk factors via First Street. Map © Google.
Why this score? — see what drove the C grade
The composite is a weighted blend of 9 inputs, each scored 0–100. Each bar is that input's sub-score; the figure is the points it added to the 100-point composite (weight × sub-score).
- Cash flow +22.7/30.0
- ARV discount +10.1/15.0
- DSCR +7.3/10.0
- 1% rule +4.7/10.0
- Rent growth +3.3/5.0
- Livability +3.2/5.0
- Condition / age +2.5/5.0
- Schools +1.8/10.0
- Appreciation +0.0/10.0
$135,000
🖨 Deal sheet 📄 Offer letter ✓ Due diligence
Listing remarks
This home is immaculate and is in move in condition. It features 3 bedrooms, 1 bath and is great for a first-time buyer. The bedrooms are a nice size, formal living room and dining room with hardwood floors. Call for your appointment today.
Key facts
- 0.36 acre lot
- Built 1959
- Listed 32 days
Property features AI
Finance
- Other: Parcel ID: 12-00-07-3-004-016.000; Lot size about 0.36 acres; Subdivision: Valley View
- Financial info: Fire fee: $350 yearly; Garbage fee: $58 quarterly
Exterior
- Parking: Driveway parking
- Utilities: Public water; Septic system; Gas water heater; Internet service available
- Home design: Existing construction; Not a tri-level or split-level home
- Construction: Siding (other); Crawl space foundation
- Exterior features: City view; No pool, patio, deck, or garden/patio listed
Interior
- Kitchen: Electric cooktop; Electric oven; Solid surface countertops
- Bedrooms: Master bedroom on main level; Two additional bedrooms on main level; All bedrooms located on main level
- Flooring: Hardwood floors
- Bathrooms: One full bathroom with tub/shower combo
- Heating & cooling: Forced air heating (gas); Central air conditioning
- Interior features: 9+ foot ceilings; Solid surface kitchen countertops; Cooktop (electric), Electric oven; No additional listed interior features
- Laundry & utility: Main-level laundry room; Washer hookup; Electric dryer hookup
Neighborhood map
What this means for you Summary
Snapshot
- This is a 3-bed/1.0-bath single-family listed at $135k.
Deal economics
- At list price, monthly cash flow is $233 ($3k/yr) — positive.
- The deal already cash-flows at list — no discount required.
- To meet the 1% rule (rent ≥ 1% of price), the offer needs to be $131k (2.7% below list).
- Recommended offer: $131k (3.0% below list) — sets the bar for market timing.
Location & tenants
- Location reads 63/100 on livability (#193 in AL) — a middle-class / working-renter tenant base. Strengths: cost of living A+, commute A, housing A; Watch: crime D, amenities F, employment F.
- Jefferson County (suburban): math 9% / reading 32% proficiency, ranked #104 of 129 in AL (top 81%) — low school quality limits family demand, transient renter base, plan for 1-2y turnover.
- Zoned schools: Center Point Elementary School (618 students, 82% FRL); Center Point High School (math 2% / reading 2%, grade F, #291 of 305 statewide, top 100%, 774 students, 91% FRL) — zoned schools average 86% FRL vs 49% district-wide (38 pts higher); higher-poverty schools than district average — tighter screening recommended.
- Zoned-school proficiency averages 2% at this address vs 20% district-wide (-18 pts) — the specific schools serving this property underperform the Jefferson County average; the district grade overstates school quality for this exact location.
- Market conditions: Rents rising (+3.0%/yr); 334 active listings in the ZIP; 40 comparable units currently listed for rent nearby; rentals at typical pace (median 24d on market — plan ~3-4 weeks tenant-placement turnaround); 42% of comp listings sitting > 30 days — soft ceiling on asking rent; 2,114 units permitted in Jefferson County in 2024 (556 in 5+ unit buildings).
Forward outlook
- Local home prices are declining (-3.0%/yr); year-one equity from $933 of loan paydown is wiped out by about $4k of value loss. Plan a longer hold.
- Jefferson County population projected to shrink 4% by 2050 — rents likely to lag national; underwrite the cash flow, not the appreciation.
Negotiation context
- It's been on market 32 days — a 3% lower offer ($131k) is reasonable based on typical stale-listing flexibility.
Risks & watch-outs
- Watch-outs: built in 1959 — expect roof / HVAC / electrical / plumbing capex.
- Climate carrying-cost: major wind risk, 27% chance of damaging wind over 30y; extreme-heat days projected 7→19/yr by 2055 (HVAC capex compounding) — expect insurance premiums to compound above CPI over the hold.
Questions for the listing agent
- It's been on market 32 days. Have you received any prior offers? Is the seller open to a 3% concession, seller financing, or rate buy-down credit?
- Built in 1959 — when were the roof, HVAC, electrical panel, plumbing, and water heater last replaced?
- Is there a deadline driving the sale (1031 exchange, divorce, estate, relocation)? That informs how much negotiation room exists.
- Schools are F-rated, which usually means shorter tenancies and higher turnover. Who's the typical renter profile here, and what's been the actual vacancy rate?
- Crime grade is D in this area — have there been break-ins, vandalism, or insurance claims at this property in the last 3 years? What carrier currently insures it and at what premium?
- What's the average days-on-market for RENTAL listings here right now (not sales)? A rising rental-DOM trend means longer vacancies and softer asking-rent achievability than the comps imply.
- What's the recent tenant-quality profile in this submarket — average credit score on applications, eviction rate, late-payment / NSF rate, and stable-employment percentage? A property-management company in the area should have these aggregated.
- How much new for-sale + rental construction is in the pipeline within 1–3 miles? Heavy new supply typically softens prices + rents 12–24 months out; constrained supply supports both.
Investment metrics
- 1% rule
- 0.97% ✗
- Cap rate
- 8.37%
- Cash-on-cash
- 7.41%
- DSCR
- 1.33
- GRM
- 8.6
CMA / ARV
- ARV (median comp)
- $143,271
- List price
- $135,000
- Delta
- -5.77%
- Verdict
- FAIR
- Comps
- 20 within 1.0 mi
Show comp detail 12 sales within ~0.75 mi
| Address | Dist | Beds/Ba | Sqft | Sold | Price | $/sf | Match |
|---|---|---|---|---|---|---|---|
| 2532 2nd Pl NW | 0.00mi | 3/1.0 | 1,132 (0%) | 0mo | $120,000 | $106 | 100 |
| 316 25th Ave NW | 0.14mi | 3/1.5 | 1,200 (+6%) | 6mo | $130,000 | $108 | 77 |
| 404 NW Sunhill Rd | 0.21mi | 3/1.5 | 1,100 (-3%) | 12mo | $107,000 | $97 | 73 |
| 317 Sunhill Rd NW | 0.24mi | 2/2.0 (-1) | 1,144 (+1%) | 7mo | $85,000 | $74 | 72 |
| 2504 2nd St NW | 0.17mi | 3/2.0 | 1,210 (+7%) | 14mo | $155,000 | $128 | 65 |
| 101 23rd Ter NW | 0.45mi | 3/1.0 | 1,049 (-7%) | 5mo | $114,000 | $109 | 63 |
| 217 23rd Ter NW | 0.38mi | 3/1.5 | 1,232 (+9%) | 4mo | $86,000 | $70 | 62 |
| 2320 5th St NW | 0.60mi | 3/1.0 | 1,098 (-3%) | 7mo | $90,000 | $82 | 61 |
| 2244 NW 1st St | 0.61mi | 3/1.5 | 1,116 (-1%) | 10mo | $100,000 | $90 | 59 |
| 440 27th Ave NW | 0.44mi | 3/2.0 | 1,280 (+13%) | 10mo | $172,000 | $134 | 45 |
| 2537 3rd St NE | 0.75mi | 3/1.0 | 1,040 (-8%) | 13mo | $85,000 | $82 | 41 |
| 2224 NW 3rd St | 0.70mi | 3/1.0 | 1,004 (-11%) | 10mo | $86,500 | $86 | 40 |
Match score weights: distance 35% · size 25% · config 20% · recency 20%. Top-matched comps best support the ARV.
Projected returns pro-forma
-3.0% appreciation · 3.04% rent growth · sell at horizon
- IRR
- -5.0%
- Equity multiple
- 0.81×
- Total profit
- $-7,020
- Equity at exit
- $20,129
- IRR
- 4.7%
- Equity multiple
- 1.34×
- Total profit
- $13,001
- Equity at exit
- $11,672
Cash invested: $37,800 (down + closing). Projections, not guarantees.
Landlord ↔ Tenant lean methodology
- Overall (STATE)
- 90 Strongly Landlord-Friendly
- State Alabama
- 90 Strongly Landlord-Friendly · R+15
- County
- — inherits STATE
- City
- — inherits STATE
ZIP-level market 35215
- Home prices YoY
- -34.4%
- Rents YoY
- 3.0%
- Active inventory
- 334
- Price-to-rent
- 8.6×
Monthly cashflow live
- Estimated rent
- $1,314 high interval (Pro) →
- Mortgage (P&I)
- −$708
- Tax from tax record
- −$40 /mo · $483/yr
- Insurance
- −$56
- HOA
- −$0
- Vacancy / Maint / Mgmt
- −$276
- Net cashflow
- $233
Break-even live
UW: 25.0% down · 7.5% · 30yr · 1.5% tax · 5.0% vac · 8.0% maint · 8.0% mgmt
Financing live
Cash to close
- Down payment
- $33,750
- Closing costs
- $4,050
- Reserves months
- —
- Total cash needed
- —
Loan-product check · same deal, 3 products live
Conventional
25% down · 7.5% · 30yr
- Down + closing
- —
- Monthly P&I
- —
- Monthly cashflow
- —
- DSCR
- —
- Eligible?
- —
Personal DTI + credit; lowest rate.
DSCR
20% down · 8.5% · 30yr
- Down + closing
- —
- Monthly P&I
- —
- Monthly cashflow
- —
- DSCR
- —
- Eligible?
- —
No personal income docs; deal must DSCR.
Hard money
10% down · 12.0% · 12mo
- Down + closing
- —
- Monthly P&I
- —
- Monthly cashflow
- —
- DSCR
- —
- Eligible?
- —
Short-term bridge; refi at stabilization.
Rent comps 40 comps
| Address | Beds | Baths | Sqft | Rent | $/sqft | DOM | Units | Dist |
|---|---|---|---|---|---|---|---|---|
| 408 Sunhill Rd NW Center Point, AL | 3.0 | 1.5 | 1290 | $1,355 | $1.05 | 43d | 1 | 0.23mi |
| 127 Fox Hill Ct Center Point, AL | 3.0 | 2.0 | 1418 | $1,545 | $1.09 | 43d | 1 | 0.27mi |
| 2416 4th St NW Center Point, AL | 4.0 | 2.0 | 1400 | $1,500 | $1.07 | 23d | 1 | 0.39mi |
| 109 24th Ave NW Center Point, AL | 3.0 | 1.5 | 1023 | $1,215 | $1.19 | 43d | 1 | 0.40mi |
| 2412 4th St NW Center Point, AL | 3.0 | 1.0 | 1224 | $1,150 | $0.94 | 15d | 1 | 0.40mi |
| 2613 5th St NW Center Point, AL | 3.0 | 1.0 | 1170 | $1,150 | $0.98 | 11d | 1 | 0.42mi |
| 232 Glenvalley Ln NW Birmingham, AL | 4.0 | 2.0 | 954 | $1,610 | $1.69 | 2d | 1 | 0.51mi |
| 2323 4th St NW Center Point, AL | 3.0 | 1.0 | 1038 | $1,305 | $1.26 | 2d | 1 | 0.53mi |
| 2318 Raintree Ct Center Point, AL | 2.0 | 1.0 | 975 | $1,100 | $1.13 | 2d | 2 | 0.58mi |
| 2245 3rd St NW Center Point, AL | 3.0 | 1.0 | 1156 | $1,100 | $0.95 | 23d | 1 | 0.60mi |
| 202 Westchester Dr Birmingham, AL | 4.0 | 2.0 | 1374 | $1,300 | $0.95 | 23d | 1 | 0.60mi |
| 319 23rd Ave NW Center Point, AL | 3.0 | 2.0 | 1284 | $1,395 | $1.09 | 43d | 1 | 0.62mi |
| 2629 Wood Dr NE Center Point, AL | 3.0 | 1.0 | 1203 | $1,250 | $1.04 | 43d | 1 | 0.62mi |
| 2320 5th St NW Center Point, AL | 3.0 | 1.0 | 1098 | $1,150 | $1.05 | 43d | 1 | 0.62mi |
| 2537 3rd St NE Center Point, AL | 3.0 | 2.0 | 1040 | $1,350 | $1.30 | 23d | 1 | 0.74mi |
| 3309 Chase Ln Unit 3309 Birmingham, AL | 2.0 | 2.0 | 1068 | $1,000 | $0.94 | 43d | 1 | 0.78mi |
| 2324 3rd St NE Center Point, AL | 3.0 | 2.0 | 1329 | $1,300 | $0.98 | 23d | 1 | 0.79mi |
| 3073 Panorama E Birmingham, AL | 1.0–3.0 | 1.0–2.0 | 975 | $1,275 | $1.31 | 1d | 20 | 0.84mi |
| 2245 3rd St NE Center Point, AL | 3.0 | 1.0 | 1150 | $1,100 | $0.96 | 23d | 1 | 0.93mi |
| 2229 3rd St NE Center Point, AL | 3.0 | 1.0 | 1215 | $1,125 | $0.93 | 23d | 1 | 1.00mi |
| 424 Tupelo Way Center Point, AL | 4.0 | 2.0 | 1233 | $1,300 | $1.05 | 43d | 1 | 1.00mi |
| 332 23rd Ave NE Center Point, AL | 3.0 | 1.0 | 1100 | $1,350 | $1.23 | 2d | 1 | 1.01mi |
| 124 21st Ave NE Unit 202 Center Point, AL | 2.0 | 1.0 | 830 | $750 | $0.90 | 15d | 1 | 1.07mi |
| 123 21st Ave NE Center Point, AL | 2.0 | 1.0 | 850 | $800 | $0.94 | 43d | 1 | 1.11mi |
| 2708 7th St NE Center Point, AL | 3.0 | 1.0 | 1451 | $1,150 | $0.79 | 43d | 1 | 1.13mi |
| 107 Sterling Ct NW Center Point, AL | 2.0 | 1.5–2.0 | 1026 | $1,062 | $1.04 | 2d | 4 | 1.17mi |
| 1905 2nd St NW Center Point, AL | 3.0 | 1.0 | 1258 | $1,395 | $1.11 | 43d | 1 | 1.19mi |
| 401 22nd Ave NE Center Point, AL | 2.0 | 1.5 | 850 | $745 | $0.88 | 15d | 1 | 1.20mi |
| 2249 4th Place Cir NE Center Point, AL | 3.0 | 1.5 | 1400 | $1,400 | $1.00 | 43d | 1 | 1.22mi |
| 2109 Whetstone Ct Center Point, AL | 2.0 | 1.5 | 800 | $675 | $0.84 | 2d | 1 | 1.23mi |
| 113 19th Ave NW Center Point, AL | 3.0 | 2.0 | 1407 | $1,250 | $0.89 | 11d | 1 | 1.25mi |
| 5992 Princess Blvd Birmingham, AL | 3.0 | 2.0 | 1454 | $1,661 | $1.14 | 43d | 1 | 1.30mi |
| 305 18th Ct NW Center Point, AL | 3.0 | 1.5 | 1270 | $1,100 | $0.87 | 43d | 1 | 1.31mi |
| 149 Martin Dr Birmingham, AL | 3.0 | 2.0 | 1164 | $1,485 | $1.28 | 23d | 1 | 1.35mi |
| 405 18th Ave NW Center Point, AL | 3.0 | 2.0 | 1162 | $1,299 | $1.12 | 43d | 1 | 1.41mi |
| 1827 Carson Rd Unit 1 Birmingham, AL | 3.0 | 2.5 | 1332 | $1,125 | $0.84 | 43d | 1 | 1.41mi |
| 1827 Carson Rd Unit 7 Birmingham, AL | 3.0 | 2.5 | 1332 | $950 | $0.71 | 23d | 1 | 1.41mi |
| 1821 Carson Rd Unit 3 Birmingham, AL | 2.0 | 1.5 | 800 | $580 | $0.72 | 21d | 1 | 1.44mi |
| 1821 Carson Rd Unit 2 Birmingham, AL | 2.0 | 1.5 | 800 | $765 | $0.96 | 43d | 1 | 1.44mi |
| 212 Saint John Dr NW Birmingham, AL | 2.0 | 2.0 | 1445 | $1,423 | $0.98 | 14d | 1 | 1.45mi |
Listing history 6 events
-
2026-06-02statusdays on market $135,000 Pending 32 DOM
-
2026-06-01days on market $135,000 Active 31 DOM
-
2026-05-31days on market $135,000 Active 30 DOM
-
2026-05-01$135,000 Active 240-char remark
-
1990-05-24soldstatus $49,900
-
1985-04-01soldstatus $44,900
ⓘ Source: listings_history table (triggers on properties + properties_extension) + one-shot
backfill from property_details.listing_events for pre-trigger history.
Tax reassessment forecast AL · Resets to sale price
- Current annual tax
- $483 · $40/mo
- Projected year-2 tax
- $554 · $46/mo
- Expected delta
- +$70/yr (+$6/mo · 14.5%)
ⓘ Screening estimate from a state-policy table — verify with the county assessor before closing.
Climate risk First Street
- Flood 1/10 Low FEMA zone X (unshaded) · 0% chance over 30 yrs
- Wildfire 2/10 Low
- Heat 5/10 Major 7 d/yr ≥106°F today · 19 d/yr by 30 yrs out
- Wind 6/10 Major 27% chance of damaging wind over 30 yrs
- Air quality 5/10 Major 6 unhealthy d/yr today · 11 by 30 yrs out
Nearby sold comps map
Loading sold comps map…
Walkable amenities ~0.75 mi
Loading nearby amenities…
Taxation est. · year 1
- Rental income
- $15,764
- − Mortgage interest
- −$7,562
- − Property taxes
- −$483
- − Insurance
- −$675
- − Repairs & maintenance
- −$1,261
- − Management
- −$1,261
- − Depreciation
- −$3,927
- Taxable income
- $594
- Est. tax owed @ 24.0%
- −$143
- After-tax cash flow
- $2,657/yr
For passive investors: Depreciation is non-cash, so a rental often shows a tax loss while cash-flowing — sheltering income. Rental losses are passive: they offset passive income freely, and up to $25,000/yr can offset ordinary (W-2) income if you actively participate and your MAGI is under $100k (phasing out to $0 by $150k); unused losses carry forward. On sale, claimed depreciation is recaptured at up to 25%, and gains may owe capital-gains tax (a 1031 exchange can defer both). Figures are a year-1 estimate at your 24.0% rate — not tax advice; consult a CPA.
Schools (NCES district)
- District
- Jefferson County
- NCES district ID
- 0101920
- Math proficiency
- 9% ▼ -24.00%
- Reading proficiency
- 32% ▼ -5.00%
- Median HH income
- $51,712
- Composite
- 18.4/100
- National rank
- #8937
- State rank
- #104 of 129 in AL
Livability — Center Point
- Score
- 63/100
- State rank
- #193
- US rank
- #15671
Category grades
Schools grade is shown separately in the Schools card above.
Census & demographics
- Census place
- Center Point, AL
- County
- Jefferson County · 527,445 people
- City population
- 43,903
- Metro
- Birmingham-Hoover, AL
- Population (ZIP)
- 43,903
- Household income
- $52,793
- Rent vs Own
- Severe rent burden
- 1729.0
Population outlook (Jefferson County) Hauer SSP2
- Today (2025)
- 669,185 people
- By 2030
- 669,694 · +0.1%
- By 2040
- 661,388 · -1.2%
- By 2050
- 643,086 · -3.9%
- By 2075
- 577,267 · -13.7%
- By 2100
- 474,758 · -29.1%
Race, ethnicity, and origin ACS 2023
- Neighborhood character
- Predominantly Black (75%)
- Race & ethnicity
- Black 75% White 15% Hispanic / Latino 7% Two or more races 3%
- Hispanic origin (detail)
- Mexican 4%
- Common ancestry
- Lithuanian 1% Italian 1% Slovak 1%
- Foreign-born
- 4% · Canada
- Languages at home
- 92% English-only · Spanish 7%
Political lean MEDSL · Jefferson
- 2024 margin
- D (+10.4) · D 54.6% · R 44.2% · Other 1.2%
- 2008→2024 swing
- +5.4pp toward D · 2008: 5.1pp · 2024: 10.4pp
- All cycles
- 2024: D+10.4 2020: D+13.2 2016: D+7.2 2012: D+6.0 2008: D+5.1
Not yet ingested
- Civics
- —
Market trends
- HPI YoY
- ▼ -112.97%
- Current HPI
- 215.0607
- Rent YoY
- ▲ 3.04%
- Metro
- Birmingham-Hoover, AL
- State GDP YoY
- ▲ 2.94%
- F500 in state
- 4
Industry mix (Fortune 500 HQ in AL)
| Industry | F500 HQs | Revenue |
|---|---|---|
| Financial Services | 1 | $8B |
|
||
| Healthcare | 1 | $5B |
|
||
Price history
+167.3% since first listed5 events — show timeline
- 2026-06-15 Sold (MLS) $120,000 Greater Alabama MLS
- 2026-06-02 Pending — Greater Alabama MLS
- 2026-05-01 Listed $135,000 Greater Alabama MLS
- 1990-05-24 Sold (Public Records) $49,900 Public Records
- 1985-04-01 Sold (Public Records) $44,900 Public Records
Property tax history
+4.3%/yrLatest (2025): $483 · +0.0% YoY. Source: county tax records.
Cash-flow waterfall
monthlySold comps — $/sqft
last 12 mo · ≤1 miLoading sold comps…