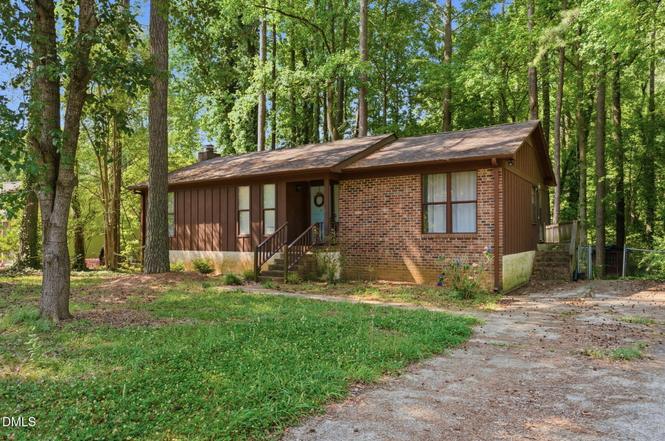
103 Mabry Pl · Garner, NC
Flood risk 1/10 · Minimal
- FEMA flood zone
- X (unshaded)
- Chance of flooding over 30 yrs
- 0.0%
- Est. flood insurance / yr
- $473 – $860
Fire risk 3/10 · Minor
- Est. fire insurance / yr
- $906 – $1,684
Heat risk 6/10 · Moderate
- Hot days now (above 105°F)
- 7 days/yr
- Hot days in 30 yrs
- 17 days/yr
Wind risk 6/10 · Moderate
- Chance of severe wind over 30 yrs
- 61.0%
Air-quality risk 2/10 · Minimal
- Unhealthy air days now
- 1 days/yr
- Unhealthy air days in 30 yrs
- 1 days/yr
Risk factors via First Street. Map © Google.
Why this score? — see what drove the C+ grade
The composite is a weighted blend of 9 inputs, each scored 0–100. Each bar is that input's sub-score; the figure is the points it added to the 100-point composite (weight × sub-score).
- Cash flow +20.7/30.0
- ARV discount +15.0/15.0
- DSCR +6.6/10.0
- 1% rule +5.3/10.0
- Schools +4.9/10.0
- Livability +3.8/5.0
- Rent growth +2.8/5.0
- Condition / age +2.5/5.0
- Appreciation +0.0/10.0
$223,000
🖨 Deal sheet (PDF) 📄 Offer letter ✓ Due diligence
Listing remarks
This spacious 4-bedroom, 3-bath home offers nearly 2,000 square feet of living space on a . 30-acre lot in an established neighborhood with no HOA. The flexible floor plan features multiple living areas, including a finished basement with exterior access, a bedroom, full bath, and large den ideal for guests, multi-generational living, a home office, or bonus space. The main level offers comfortable everyday living with generous room sizes and abundant natural light. Enjoy the privacy of a mature lot while remaining just minutes from shopping, dining, parks, Downtown Garner, and major commuter routes. A rare opportunity to own a home with space, versatility, and convenience in a sought-after
Key facts
- Exterior access
- Mature lot
- Finished basement
Tags
Property features AI
Finance
- Other: Lot approximately 0.3 acres
- HOA & community: No association
Exterior
- Utilities: Public water; Community sewer
- Home design: One-story house; No common walls; Fixer condition; R4 zoning
- Construction: HardiPlank-type exterior; Tile roof; Concrete perimeter foundation; Built with a total finished area including below-grade space
- Exterior features: Chain link fencing; Publicly maintained road access
Interior
- Bedrooms: Four bedrooms total; Three bedrooms on the main level
- Flooring: Carpet; Vinyl
- Bathrooms: Two full bathrooms
- Heating & cooling: Central heating; Central air conditioning
- Interior features: Finished, heated basement; Washer hookup
- Laundry & utility: Washer hookup
Neighborhood map
What this means for you Summary
Snapshot
- This is a 4-bed/2.0-bath single-family listed at $223k.
Deal economics
- At list price, monthly cash flow is $304 ($4k/yr) — positive.
- The deal already cash-flows at list — no discount required.
- Meets the 1% rule at list price ($2k rent vs $223k).
- Cap rate 7.9% vs local median 3.3% in Garner — top-decile yield for the area; either an underpriced asset or a hidden risk that comps aren't pricing in. Stress-test before assuming the spread holds.
Location & tenants
- Location reads 76/100 on livability (#35 in NC, #3,421 nationally) — a middle-class / working-renter tenant base. Strengths: housing A+, commute A-, cost of living A-; Watch: schools D+, amenities D, crime F.
- Wake County Schools (suburban): math 52% / reading 60% proficiency, ranked #35 of 178 in NC (top 20%) — acceptable for families but not a draw, mixed tenant base, ~2y average lease.
- Market conditions: Rents rising (+1.1%/yr); 652 active listings in the ZIP; 8 comparable units currently listed for rent nearby; rentals at typical pace (median 25d on market — plan ~3-4 weeks tenant-placement turnaround); solid renter incomes; 15,249 units permitted in Wake County in 2024 (5,568 in 5+ unit buildings).
- This rent runs 32% of the median local income ($86k/yr) — at the standard rent-burdened threshold; future hikes will face affordability resistance.
Forward outlook
- Local home prices are declining (-3.0%/yr); year-one equity from $2k of loan paydown is wiped out by about $7k of value loss. Plan a longer hold.
- Wake County population projected at +51% by 2050 — long-run rental-demand tailwind backs the buy-and-hold thesis.
Negotiation context
- Only 1 days on market — expect competitive offers; lowballing is unlikely to land.
- Current owner paid $120k; list at $223k implies a 86% gain — meaningful room to come down on a strong offer.
Risks & watch-outs
- Climate carrying-cost: major wind risk, 61% chance of damaging wind over 30y; extreme-heat days projected 7→17/yr by 2055 (HVAC capex compounding) — expect insurance premiums to compound above CPI over the hold.
Questions for the listing agent
- Built in 1975 — when were the roof, HVAC, electrical panel, plumbing, and water heater last replaced?
- Is there a deadline driving the sale (1031 exchange, divorce, estate, relocation)? That informs how much negotiation room exists.
- Schools are D-rated, which usually means shorter tenancies and higher turnover. Who's the typical renter profile here, and what's been the actual vacancy rate?
- Crime grade is F in this area — have there been break-ins, vandalism, or insurance claims at this property in the last 3 years? What carrier currently insures it and at what premium?
- What's the average days-on-market for RENTAL listings here right now (not sales)? A rising rental-DOM trend means longer vacancies and softer asking-rent achievability than the comps imply.
- What's the recent tenant-quality profile in this submarket — average credit score on applications, eviction rate, late-payment / NSF rate, and stable-employment percentage? A property-management company in the area should have these aggregated.
- How much new for-sale + rental construction is in the pipeline within 1–3 miles? Heavy new supply typically softens prices + rents 12–24 months out; constrained supply supports both.
Investment metrics
- 1% rule
- 1.03% ✓
- Cap rate
- 7.93%
- Cash-on-cash
- 5.84%
- DSCR
- 1.26
- GRM
- 8.1
CMA / ARV
- ARV (on-the-fly)
- $391,439
- Comps found
- 7
Show comp detail 7 sales within ~0.75 mi
| Address | Dist | Beds/Ba | Sqft | Sold | Price | $/sf | Match |
|---|---|---|---|---|---|---|---|
| 1503 Buckingham Rd | 0.16mi | 4/2.5 | 2,061 (+4%) | 20mo | $406,700 | $197 | 68 |
| 602 Kimberwood Ct | 0.58mi | 3/2.5 (-1) | 1,854 (-7%) | 0mo | $400,000 | $216 | 54 |
| 217 Shady Hollow Ln | 0.67mi | 3/2.0 (-1) | 1,920 (-3%) | 6mo | $535,000 | $279 | 53 |
| 1107 Flanders St | 0.40mi | 4/3.0 | 2,060 (+4%) | 22mo | $395,000 | $192 | 53 |
| 1005 Buckingham Rd | 0.51mi | 4/2.5 | 2,027 (+2%) | 23mo | $400,000 | $197 | 51 |
| 1106 Brucemont Dr | 0.56mi | 3/2.5 (-1) | 2,129 (+7%) | 10mo | $395,000 | $186 | 47 |
| 1404 Kenbrook Dr | 0.74mi | 4/3.0 | 1,847 (-7%) | 24mo | $420,000 | $227 | 30 |
Match score weights: distance 35% · size 25% · config 20% · recency 20%. Top-matched comps best support the ARV.
Projected returns pro-forma
-3.0% appreciation · 1.15% rent growth · sell at horizon
- IRR
- -9.3%
- Equity multiple
- 0.66×
- Total profit
- $-20,954
- Equity at exit
- $33,250
- IRR
- -2.5%
- Equity multiple
- 0.84×
- Total profit
- $-9,829
- Equity at exit
- $19,281
Cash invested: $62,440 (down + closing). Projections, not guarantees.
Landlord ↔ Tenant lean methodology
- Overall (STATE)
- 85 Strongly Landlord-Friendly
- State North Carolina
- 85 Strongly Landlord-Friendly · R+3
- County
- — inherits STATE
- City
- — inherits STATE
ZIP-level market 27529
- Rents YoY
- 1.1%
- Active inventory
- 652
- Price-to-rent
- 8.1×
Monthly cashflow live
- Estimated rent
- $2,292 high interval (Pro) →
- Mortgage (P&I)
- −$1,169
- Tax from tax record
- −$245 /mo · $2,935/yr
- Insurance
- −$93
- HOA
- −$0
- Vacancy / Maint / Mgmt
- −$481
- Net cashflow
- $304
Break-even live
Sensitivity live
| Price | -10% $430 | -5% $367 | +0% $304 | +5% $241 | +10% $178 |
|---|---|---|---|---|---|
| Rent | -10% $123 | -5% $213 | +0% $304 | +5% $394 | +10% $485 |
| Rate | -1.0pp $416 | -0.5pp $361 | base $304 | +0.5pp $246 | +1.0pp $187 |
UW: 25.0% down · 7.5% · 30yr · 1.5% tax · 5.0% vac · 8.0% maint · 8.0% mgmt
Financing live
Cash to close
- Down payment
- $55,750
- Closing costs
- $6,690
- Reserves months
- —
- Total cash needed
- —
Loan-product check · same deal, 3 products live
Conventional
25% down · 7.5% · 30yr
- Down + closing
- —
- Monthly P&I
- —
- Monthly cashflow
- —
- DSCR
- —
- Eligible?
- —
Personal DTI + credit; lowest rate.
DSCR
20% down · 8.5% · 30yr
- Down + closing
- —
- Monthly P&I
- —
- Monthly cashflow
- —
- DSCR
- —
- Eligible?
- —
No personal income docs; deal must DSCR.
Hard money
10% down · 12.0% · 12mo
- Down + closing
- —
- Monthly P&I
- —
- Monthly cashflow
- —
- DSCR
- —
- Eligible?
- —
Short-term bridge; refi at stabilization.
Rent comps 8 comps
| Address | Beds | Baths | Sqft | Rent | $/sqft | DOM | Units | Dist |
|---|---|---|---|---|---|---|---|---|
| 1425 Aversboro Rd Garner, NC | 2.0–3.0 | 2.0 | 1262 | $1,900 | $1.51 | 15d | 2 | 0.79mi |
| 725 Heather Park Dr Garner, NC | 1.0–3.0 | 1.0–2.0 | 1012 | $1,560 | $1.54 | 2d | 14 | 0.92mi |
| 203 Southerby Bluffs Ct Garner, NC | 3.0 | 2.5 | 2071 | $2,250 | $1.09 | 24d | 1 | 0.93mi |
| 166 Gulley Glen Dr Garner, NC | 4.0 | 3.5 | 2263 | $2,200 | $0.97 | 24d | 1 | 0.96mi |
| 205 November St Garner, NC | 3.0 | 2.0 | 1695 | $1,995 | $1.18 | 24d | 1 | 1.10mi |
| 1517 Wiljohn Rd Garner, NC | 3.0 | 2.0 | 1688 | $3,000 | $1.78 | 24d | 1 | 1.31mi |
| 415 Aversboro Rd Garner, NC | 4.0 | 2.5 | 1728 | $1,950 | $1.13 | 24d | 1 | 1.48mi |
| 400 Evolve Dr Garner, NC | 1.0–3.0 | 1.0–2.0 | 990 | $1,964 | $1.98 | 2d | 19 | 1.48mi |
Listing history 2 events
-
2026-06-13remarks 699-char remark
-
2026-06-13$223,000 Pending 1 DOM
ⓘ Source: listings_history table (triggers on properties + properties_extension) + one-shot
backfill from property_details.listing_events for pre-trigger history.
Tax reassessment forecast NC · Resets to sale price
- Current annual tax
- $2,935 · $245/mo
- Projected year-2 tax
- $2,935 · $245/mo
- Expected delta
- $0/yr ($0/mo · 0.0%)
ⓘ Screening estimate from a state-policy table — verify with the county assessor before closing.
Climate risk First Street
- Flood 1/10 Low FEMA zone X (unshaded) · 0% chance over 30 yrs
- Wildfire 3/10 Moderate
- Heat 6/10 Major 7 d/yr ≥105°F today · 17 d/yr by 30 yrs out
- Wind 6/10 Major 61% chance of damaging wind over 30 yrs
- Air quality 2/10 Low 1 unhealthy d/yr today · 1 by 30 yrs out
Nearby sold comps map
Loading sold comps map…
Walkable amenities ~0.75 mi
Loading nearby amenities…
Taxation est. · year 1
- Rental income
- $27,507
- − Mortgage interest
- −$12,491
- − Property taxes
- −$2,935
- − Insurance
- −$1,115
- − Repairs & maintenance
- −$2,201
- − Management
- −$2,201
- − Depreciation
- −$6,487
- Taxable income
- $77
- Est. tax owed @ 24.0%
- −$19
- After-tax cash flow
- $3,629/yr
For passive investors: Depreciation is non-cash, so a rental often shows a tax loss while cash-flowing — sheltering income. Rental losses are passive: they offset passive income freely, and up to $25,000/yr can offset ordinary (W-2) income if you actively participate and your MAGI is under $100k (phasing out to $0 by $150k); unused losses carry forward. On sale, claimed depreciation is recaptured at up to 25%, and gains may owe capital-gains tax (a 1031 exchange can defer both). Figures are a year-1 estimate at your 24.0% rate — not tax advice; consult a CPA.
Schools (NCES district)
- District
- Wake County Schools
- NCES district ID
- 3704720
- Math proficiency
- 52% ▲ 2.00%
- Reading proficiency
- 60% ▲ 4.00%
- Median HH income
- $67,509
- Composite
- 49.41/100
- National rank
- #2010
- State rank
- #35 of 178 in NC
Livability — Garner
- Score
- 76/100
- State rank
- #35
- US rank
- #3421
Category grades
Schools grade is shown separately in the Schools card above.
Census & demographics
- Census place
- Garner, NC
- County
- Wake County · 1,216,256 people
- City population
- 55,242
- Metro
- Raleigh-Cary, NC
- Population (ZIP)
- 55,242
- Household income
- $85,716
- Rent vs Own
- Severe rent burden
- 1455.0
Population outlook (Wake County) Hauer SSP2
- Today (2025)
- 1,293,152 people
- By 2030
- 1,428,223 · +10.4%
- By 2040
- 1,698,188 · +31.3%
- By 2050
- 1,955,807 · +51.2%
- By 2075
- 2,520,273 · +94.9%
- By 2100
- 2,893,335 · +123.7%
Race, ethnicity, and origin ACS 2023
- Neighborhood character
- Diverse neighborhood (Simpson 0.61)
- Race & ethnicity
- White 56% Black 25% Hispanic / Latino 13% Two or more races 9% Asian 1%
- Hispanic origin (detail)
- Mexican 8% Puerto Rican 2%
- Common ancestry
- Lithuanian 3% Slovak 3% Italian 2%
- Foreign-born
- 8% · Canada
- Languages at home
- 87% English-only · Spanish 11% Other Indo-European 1%
Political lean MEDSL · Wake
- 2024 margin
- Strong D (+25.5) · D 61.9% · R 36.4% · Other 1.7%
- 2008→2024 swing
- +11.1pp toward D · 2008: 14.4pp · 2024: 25.5pp
- All cycles
- 2024: D+25.5 2020: D+26.4 2016: D+20.5 2012: D+10.2 2008: D+14.4
Not yet ingested
- Civics
- —
Market trends
- HPI YoY
- ▼ -241.30%
- Current HPI
- 238.8492
- Rent YoY
- ▲ 1.15%
- Metro
- Raleigh-Cary, NC
- State GDP YoY
- ▲ 3.28%
- F500 in state
- 26
Industry mix (Fortune 500 HQ in NC)
| Industry | F500 HQs | Revenue |
|---|---|---|
| Financial Services | 2 | $213B |
|
||
| Retail | 2 | $95B |
|
||
| Industrial Conglomerate | 1 | $38B |
|
||
| Metals / Steel | 1 | $35B |
|
||
| Utilities | 1 | $30B |
|
||
| Industrial Machinery | 1 | $19B |
|
||
Price history
+85.8% since first listed3 events — show timeline
- 2026-06-12 Pending — TMLS
- 2026-06-09 Listed $223,000 TMLS
- 1995-01-31 Sold (Public Records) $120,000 Public Records
Property tax history
+4.8%/yrLatest (2025): $2,935 · +0.3% YoY. Source: county tax records.
Cash-flow waterfall
monthlySold comps — $/sqft
last 12 mo · ≤1 miLoading sold comps…