 🏗️ New Construction
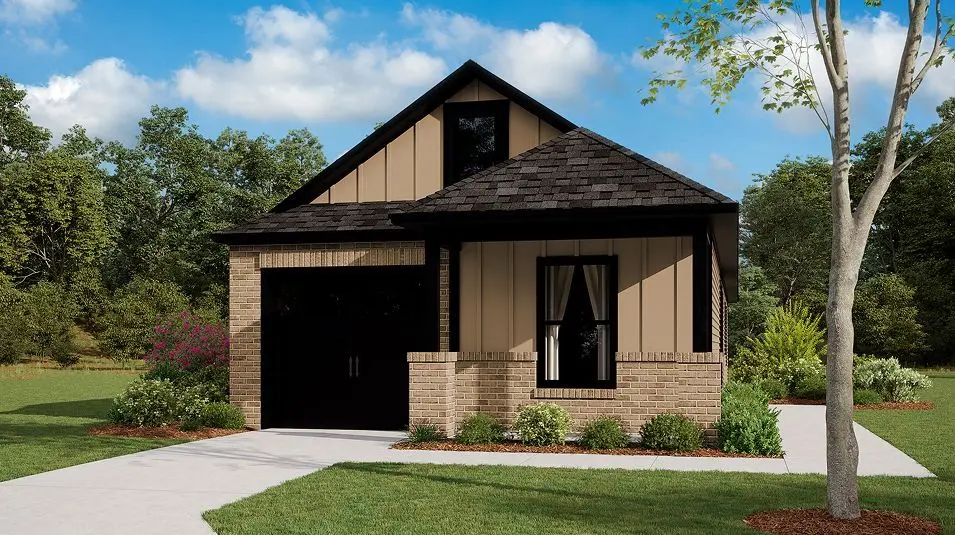
Rc Everly Plan · Oklahoma City, OK
Flood risk No data
- FEMA flood zone
- —
- Chance of flooding over 30 yrs
- —
- Est. flood insurance / yr
- —
Fire risk No data
- Est. fire insurance / yr
- —
Heat risk No data
- Hot days now (above threshold)
- —
- Hot days in 30 yrs
- —
Wind risk No data
- Chance of severe wind over 30 yrs
- —
Air-quality risk No data
- Unhealthy air days now
- —
- Unhealthy air days in 30 yrs
- —
Risk factors via First Street. Map © Google.
Why this score? — see what drove the D- grade
The composite is a weighted blend of 9 inputs, each scored 0–100. Each bar is that input's sub-score; the figure is the points it added to the 100-point composite (weight × sub-score).
- Cash flow +9.3/30.0
- ARV discount +7.5/15.0
- Livability +4.0/5.0
- Condition / age +3.8/5.0
- Schools +3.1/10.0
- 1% rule +2.8/10.0
- DSCR +2.6/10.0
- Rent growth +2.4/5.0
- Appreciation +0.0/10.0
$189,900
🖨 Deal sheet (PDF) 📄 Offer letter ✓ Due diligence
Listing remarks
This new single-story home boasts a modern and low-maintenance design. An open-concept floorplan greets guests and residents alike off the entry, encouraging seamless everyday transitions and multitasking. A secondary bedroom is tucked away near the front of the home just steps from a full bathroom, and the luxurious owner's suite is nestled into a private rear corner, complete with a spa-inspired bathroom and generous walk-in closet.
Key facts
- Secondary bedroom
- Full bathroom
- Garage
Tags
Property features AI
Finance
- Financial info: List price $189,900
Exterior
- Parking: 1 garage space (1 total parking space)
- Home design: New construction plan (Rc Everly)
- Exterior features: Living area approximately 1114
Interior
- Bedrooms: 2 bedrooms
- Bathrooms: 2 full bathrooms
- Interior features: Plan home (Rc Everly)
Neighborhood map
What this means for you Summary
Snapshot
- This is a 2-bed/2.0-bath single-family listed at $190k. Condition is rated good.
Deal economics
- At list price, monthly cash flow is $-155 ($-2k/yr) — negative.
- To cash-flow at today's rent, offer at most $189k (0.4% below list).
- To meet the 1% rule (rent ≥ 1% of price), the offer needs to be $166k (12.8% below list).
- Recommended offer: $166k (12.8% below list) — sets the bar for 1% rule.
- Cap rate 5.4% vs local median 3.7% in Oklahoma City — top-decile yield for the area; either an underpriced asset or a hidden risk that comps aren't pricing in. Stress-test before assuming the spread holds.
Location & tenants
- Location reads 80/100 on livability (#3 in OK, #1,635 nationally) — a professional / high-income tenant draw. Strengths: amenities A+, commute A+, cost of living A+; Watch: crime F.
- Mustang (suburban): math 35% / reading 33% proficiency, ranked #28 of 270 in OK (top 10%) — families likely to look elsewhere, expect single-tenant / working-renter base with shorter leases.
- Zoned schools: Mustang Centennial Es (math 46% / reading 42%, grade F, #73 of 845 statewide, top 9%, 643 students, 0% FRL); Canyon Ridge Ies (math 43% / reading 36%, grade F, #8 of 345 statewide, top 2%, 749 students, 0% FRL); Mustang Hs (math 28% / reading 39%, grade F, #65 of 447 statewide, top 14%, 3,756 students, 0% FRL) — zoned schools average 0% FRL vs 28% district-wide (28 pts lower); this property's tenant base skews higher-income than the district average.
- Market conditions: Rents soft (-0.3%/yr); 523 active listings in the ZIP; 2 comparable units currently listed for rent nearby; solid renter incomes; 260 units permitted in Canadian County in 2024 (0 in 5+ unit buildings).
Forward outlook
- Local home prices are declining (-3.0%/yr); year-one equity from $1k of loan paydown is wiped out by about $6k of value loss. Plan a longer hold.
- Canadian County population projected at +64% by 2050 — long-run rental-demand tailwind backs the buy-and-hold thesis.
Negotiation context
- It's been on market 25 days — a 2% lower offer ($187k) is reasonable based on typical stale-listing flexibility.
Questions for the listing agent
- What do current leases actually rent for vs. the listed asking? Can we see a recent rent roll and the last 12 months of T-12 income?
- Is there a deadline driving the sale (1031 exchange, divorce, estate, relocation)? That informs how much negotiation room exists.
- Schools are F-rated, which usually means shorter tenancies and higher turnover. Who's the typical renter profile here, and what's been the actual vacancy rate?
- Crime grade is F in this area — have there been break-ins, vandalism, or insurance claims at this property in the last 3 years? What carrier currently insures it and at what premium?
- The area grade is low — what's the realistic commute time and amenity access for the typical tenant pool here? Any planned neighborhood developments (good or bad) we should know about?
- What's the average days-on-market for RENTAL listings here right now (not sales)? A rising rental-DOM trend means longer vacancies and softer asking-rent achievability than the comps imply.
- What's the recent tenant-quality profile in this submarket — average credit score on applications, eviction rate, late-payment / NSF rate, and stable-employment percentage? A property-management company in the area should have these aggregated.
- How much new for-sale + rental construction is in the pipeline within 1–3 miles? Heavy new supply typically softens prices + rents 12–24 months out; constrained supply supports both.
Investment metrics
- 1% rule
- 0.78% ✗
- Cap rate
- 5.41%
- Cash-on-cash
- -3.14%
- DSCR
- 0.86
- GRM
- 10.7
CMA / ARV
- ARV (on-the-fly)
- $211,660
- Comps found
- 12
Show comp detail 12 sales within ~0.75 mi
| Address | Dist | Beds/Ba | Sqft | Sold | Price | $/sf | Match |
|---|---|---|---|---|---|---|---|
| 3637 Blue Ave | 0.04mi | 3/2.0 (+1) | 1,051 (-6%) | 4mo | $199,900 | $190 | 80 |
| 12020 SW 36th St | 0.09mi | 3/2.0 (+1) | 1,051 (-6%) | 3mo | $199,900 | $190 | 79 |
| 3636 Blue Ave | 0.06mi | 3/2.0 (+1) | 1,051 (-6%) | 7mo | $204,000 | $194 | 77 |
| 12100 SW 36th St | 0.09mi | 3/2.0 (+1) | 1,051 (-6%) | 6mo | $204,700 | $195 | 77 |
| 12012 SW 36th St | 0.09mi | 3/2.0 (+1) | 1,248 (+12%) | 4mo | $201,050 | $161 | 68 |
| 12036 SW 36th St | 0.09mi | 3/2.0 (+1) | 1,248 (+12%) | 4mo | $195,000 | $156 | 67 |
| 12024 SW 36th St | 0.15mi | 3/2.0 (+1) | 1,248 (+12%) | 1mo | $216,900 | $174 | 67 |
| 3633 Maggie Rd | 0.14mi | 3/2.0 (+1) | 1,249 (+12%) | 2mo | $204,534 | $164 | 67 |
| 3645 Maggie Rd | 0.13mi | 3/2.0 (+1) | 1,248 (+12%) | 3mo | $211,084 | $169 | 66 |
| 3116 Aidyn Ct | 0.48mi | 3/2.0 (+1) | 1,152 (+3%) | 4mo | $276,900 | $240 | 64 |
| 12033 SW 31st | 0.40mi | 3/2.0 (+1) | 1,012 (-9%) | 7mo | $196,999 | $195 | 55 |
| 3305 Little Creek Dr | 0.33mi | 3/2.0 (+1) | 1,248 (+12%) | 6mo | $222,400 | $178 | 54 |
Match score weights: distance 35% · size 25% · config 20% · recency 20%. Top-matched comps best support the ARV.
Projected returns pro-forma
-3.0% appreciation · 0.0% rent growth · sell at horizon
- IRR
- -24.9%
- Equity multiple
- 0.17×
- Total profit
- $-49,010
- Equity at exit
- $31,559
- IRR
- -33.4%
- Equity multiple
- -0.25×
- Total profit
- $-74,051
- Equity at exit
- $18,300
Cash invested: $59,265 (down + closing). Projections, not guarantees.
Landlord ↔ Tenant lean methodology
- Overall (STATE)
- 83 Strongly Landlord-Friendly
- State Oklahoma
- 83 Strongly Landlord-Friendly · R+20
- County
- — inherits STATE
- City
- — inherits STATE
ZIP-level market 73064
- Home prices YoY
- -17.9%
- Rents YoY
- -0.3%
- Active inventory
- 523
- Price-to-rent
- 9.6×
Monthly cashflow live
- Estimated rent
- $1,655 medium interval (Pro) →
- Mortgage (P&I)
- −$1,110
- Tax est. 1.5%
- −$265 /mo · $3,175/yr
- Insurance
- −$88
- HOA
- −$0
- Vacancy / Maint / Mgmt
- −$348
- Net cashflow
- $-155
Break-even live
Sensitivity live
| Price | -10% $-9 | -5% $-82 | +0% $-155 | +5% $-228 | +10% $-302 |
|---|---|---|---|---|---|
| Rent | -10% $-286 | -5% $-221 | +0% $-155 | +5% $-90 | +10% $-24 |
| Rate | -1.0pp $-49 | -0.5pp $-101 | base $-155 | +0.5pp $-210 | +1.0pp $-266 |
UW: 25.0% down · 7.5% · 30yr · 1.5% tax · 5.0% vac · 8.0% maint · 8.0% mgmt
Financing live
Cash to close
- Down payment
- $52,915
- Closing costs
- $6,350
- Reserves months
- —
- Total cash needed
- —
Loan-product check · same deal, 3 products live
Conventional
25% down · 7.5% · 30yr
- Down + closing
- —
- Monthly P&I
- —
- Monthly cashflow
- —
- DSCR
- —
- Eligible?
- —
Personal DTI + credit; lowest rate.
DSCR
20% down · 8.5% · 30yr
- Down + closing
- —
- Monthly P&I
- —
- Monthly cashflow
- —
- DSCR
- —
- Eligible?
- —
No personal income docs; deal must DSCR.
Hard money
10% down · 12.0% · 12mo
- Down + closing
- —
- Monthly P&I
- —
- Monthly cashflow
- —
- DSCR
- —
- Eligible?
- —
Short-term bridge; refi at stabilization.
Rent comps 2 comps
| Address | Beds | Baths | Sqft | Rent | $/sqft | DOM | Units | Dist |
|---|---|---|---|---|---|---|---|---|
| 3300 S Mustang Rd Yukon, OK | 1.0–2.0 | 1.0–2.0 | 818 | $1,693 | $2.07 | 3d | 16 | 1.10mi |
| 11521 SW 24th St Yukon, OK | 3.0 | 2.0 | 1398 | $1,595 | $1.14 | 6d | 1 | 1.26mi |
Listing history 14 events
-
2026-06-21days on market $189,900 Active 25 DOM
-
2026-06-18days on market $189,900 Active 22 DOM
-
2026-06-17days on market $189,900 Active 21 DOM
-
2026-06-16days on market $189,900 Active 20 DOM
-
2026-06-15days on market $189,900 Active 19 DOM
-
2026-06-13days on market $189,900 Active 17 DOM
-
2026-06-09days on market $189,900 Active 13 DOM
-
2026-06-08days on market $189,900 Active 12 DOM
-
2026-06-07days on market $189,900 Active 11 DOM
-
2026-06-05days on market $189,900 Active 8 DOM
-
2026-06-03days on market $189,900 Active 7 DOM
-
2026-06-02days on market $189,900 Active 6 DOM
-
2026-06-01days on market $189,900 Active 5 DOM
-
2026-05-31days on market $189,900 Active 4 DOM
ⓘ Source: listings_history table (triggers on properties + properties_extension) + one-shot
backfill from property_details.listing_events for pre-trigger history.
Nearby sold comps map
Loading sold comps map…
Walkable amenities ~0.75 mi
Loading nearby amenities…
Taxation est. · year 1
- Rental income
- $19,861
- − Mortgage interest
- −$11,856
- − Property taxes
- −$3,175
- − Insurance
- −$1,058
- − Repairs & maintenance
- −$1,589
- − Management
- −$1,589
- − Depreciation
- −$6,157
- Taxable loss
- −$5,564
- Est. tax savings @ 24.0%
- +$1,335
- After-tax cash flow
- $-527/yr
For passive investors: Depreciation is non-cash, so a rental often shows a tax loss while cash-flowing — sheltering income. Rental losses are passive: they offset passive income freely, and up to $25,000/yr can offset ordinary (W-2) income if you actively participate and your MAGI is under $100k (phasing out to $0 by $150k); unused losses carry forward. On sale, claimed depreciation is recaptured at up to 25%, and gains may owe capital-gains tax (a 1031 exchange can defer both). Figures are a year-1 estimate at your 24.0% rate — not tax advice; consult a CPA.
Condition & rehab AI · 4 photos
This single-story home presents as move-in ready with a good condition score and minimal repairs needed. The fresh paint and landscaping improvements would significantly enhance its resale and rental value.
Value-add opportunities
- Both Painting exterior and interior — Fresh paint enhances curb appeal and interior aesthetics
- Both Landscaping improvements — Enhances curb appeal and adds value
- Both HVAC maintenance — Ensures comfort and energy efficiency
Renovation cost estimate screening
Value-add ROI direction
- Both Painting exterior and interior — Fresh paint enhances curb appeal and interior aesthetics ↑
- Both Landscaping improvements — Enhances curb appeal and adds value ↑
- Both HVAC maintenance — Ensures comfort and energy efficiency ↑
ⓘ Cost ranges are severity-bucket heuristics (US national rule-of-thumb). Get contractor quotes + a written scope before underwriting a rehab budget.
Schools (NCES district)
- District
- Mustang
- NCES district ID
- 4021000
- Math proficiency
- 35% ▼ -10.00%
- Reading proficiency
- 33% ▼ -7.00%
- Median HH income
- $67,559
- Composite
- 31.21/100
- National rank
- #6038
- State rank
- #28 of 270 in OK
Livability — Oklahoma City
- Score
- 80/100
- State rank
- #3
- US rank
- #1635
Category grades
Schools grade is shown separately in the Schools card above.
Census & demographics
- Census place
- Oklahoma City, OK
- County
- Canadian County · 154,341 people
- City population
- 498,656
- Metro
- Oklahoma City, OK
- Population (ZIP)
- 28,919
- Household income
- $94,402
- Rent vs Own
- Severe rent burden
- 384.0
Population outlook (Canadian County) Hauer SSP2
- Today (2025)
- 174,062 people
- By 2030
- 195,170 · +12.1%
- By 2040
- 239,293 · +37.5%
- By 2050
- 285,457 · +64.0%
- By 2075
- 403,766 · +132.0%
- By 2100
- 498,766 · +186.5%
Race, ethnicity, and origin ACS 2023
- Neighborhood character
- Predominantly White (74%)
- Race & ethnicity
- White 74% Two or more races 11% Hispanic / Latino 10% Native American 3% Black 3% Asian 2%
- Hispanic origin (detail)
- Mexican 8%
- Common ancestry
- Italian 2% Scottish 2% Slovak 2%
- Foreign-born
- 4% · Canada, Vietnam
- Languages at home
- 93% English-only · Spanish 5% Other Indo-European 1% Tagalog/Filipino 1%
Political lean MEDSL · Canadian
- 2024 margin
- Solid R (+40.4) · D 28.8% · R 69.2% · Other 2.0%
- 2008→2024 swing
- +11.9pp toward D · 2008: -52.2pp · 2024: -40.4pp
- All cycles
- 2024: R+40.4 2020: R+43.3 2016: R+51.2 2012: R+54.4 2008: R+52.2
Not yet ingested
- Civics
- —
Market trends
- HPI YoY
- ▼ -56.66%
- Current HPI
- 260.2863
- Rent YoY
- ▼ -0.33%
- Metro
- Oklahoma City, OK
- State GDP YoY
- ▲ 1.55%
- F500 in state
- 6
Industry mix (Fortune 500 HQ in OK)
| Industry | F500 HQs | Revenue |
|---|---|---|
| Energy | 3 | $48B |
|
||
Cash-flow waterfall
monthlySold comps — $/sqft
last 12 mo · ≤1 miLoading sold comps…