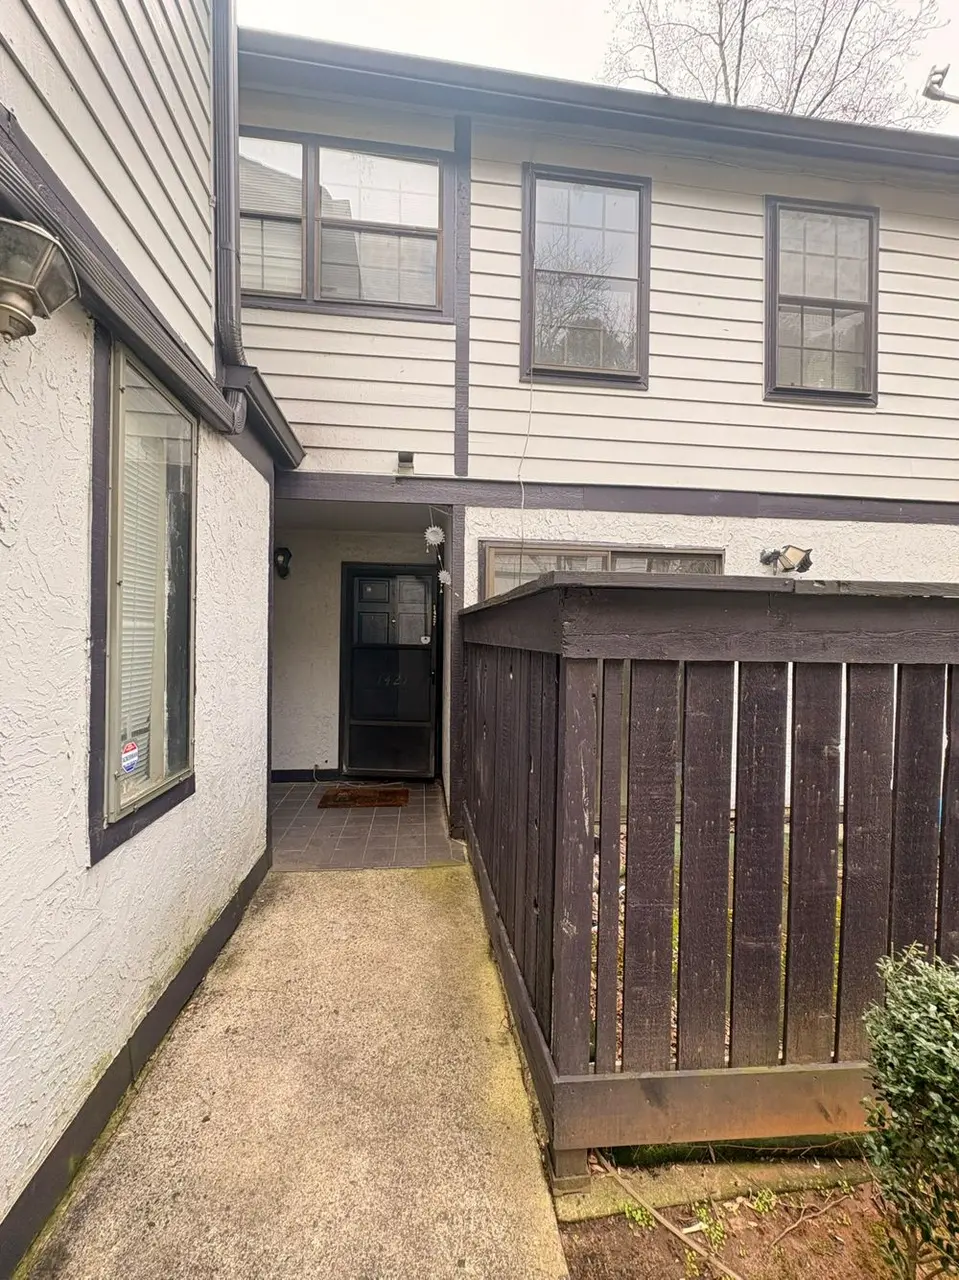
1427 Stone Mill Trce · Tucker, GA
Flood risk 1/10 · Minimal
- FEMA flood zone
- X (unshaded)
- Chance of flooding over 30 yrs
- 0.0%
- Est. flood insurance / yr
- $507 – $1,088
Fire risk 3/10 · Minor
- Est. fire insurance / yr
- $963 – $1,789
Heat risk 5/10 · Moderate
- Hot days now (above 104°F)
- 7 days/yr
- Hot days in 30 yrs
- 18 days/yr
Wind risk 5/10 · Moderate
- Chance of severe wind over 30 yrs
- 23.0%
Air-quality risk 6/10 · Moderate
- Unhealthy air days now
- 8 days/yr
- Unhealthy air days in 30 yrs
- 11 days/yr
Risk factors via First Street. Map © Google.
Why this score? — see what drove the B grade
The composite is a weighted blend of 9 inputs, each scored 0–100. Each bar is that input's sub-score; the figure is the points it added to the 100-point composite (weight × sub-score).
- Cash flow +30.0/30.0
- ARV discount +15.0/15.0
- 1% rule +10.0/10.0
- DSCR +10.0/10.0
- Rent growth +2.8/5.0
- Livability +2.5/5.0
- Condition / age +2.5/5.0
- Schools +2.1/10.0
- Appreciation +0.0/10.0
$65,000
🖨 Deal sheet 📄 Offer letter ✓ Due diligence
Listing remarks MLS
Discover the perfect blend of comfort, convenience, and peace of mind in this beautifully maintained 2bedroom, 1.5bath home, tucked away in a quiet, wellkept community. The spacious layout features generously sized bedrooms, an inviting living area, and an updated kitchen. All major systems and components replaced within the last year. Located just minutes from Stone Mountain Park, shopping, schools, and major commuter routes, this home offers the lifestyle and accessibility buyers want. The home price is set to sell, and the seller is highly motivated. Opportunities like this are rare and move quickly. Call today to schedule a viewing and make this home yours before its gone.
Key facts
- $385 HOA
- Garage
- Built 1974
Neighborhood map
What this means for you Summary
Snapshot
- This is a 3-bed/1.5-bath condo listed at $65k.
Deal economics
- At list price, monthly cash flow is $314 ($4k/yr) — positive.
- The deal already cash-flows at list — no discount required.
- Meets the 1% rule at list price ($2k rent vs $65k).
- Cap rate 12.1% vs local median 3.4% in Tucker — top-decile yield for the area; either an underpriced asset or a hidden risk that comps aren't pricing in. Stress-test before assuming the spread holds.
Location & tenants
- Location reads: area grade B — affects rentability + tenant quality, not the cash-flow math above.
- Dekalb County (suburban): math 19% / reading 28% proficiency, ranked #125 of 174 in GA (top 72%) — low school quality limits family demand, transient renter base, plan for 1-2y turnover; 68% free/reduced lunch — lower-income household profile, screen leases tightly.
- Market conditions: Rents rising (+1.3%/yr); 257 active listings in the ZIP; 34 comparable units currently listed for rent nearby; rentals at typical pace (median 17d on market — plan ~3-4 weeks tenant-placement turnaround); 1,240 units permitted in DeKalb County in 2024 (385 in 5+ unit buildings).
- This rent runs 36% of the median local income ($55k/yr) — at the standard rent-burdened threshold; future hikes will face affordability resistance.
Forward outlook
- Local home prices are declining (-3.0%/yr); year-one equity from $449 of loan paydown is wiped out by about $2k of value loss. Plan a longer hold.
- DeKalb County population projected at +28% by 2050 — long-run rental-demand tailwind backs the buy-and-hold thesis.
- At projected returns (-3.0% appreciation + 1.3% rent growth), your $18k cash investment doubles in ~8 years — after that, you're playing with house money.
Negotiation context
- Only 7 days on market — expect competitive offers; lowballing is unlikely to land.
- 5 sale attempts since 8y ago; this cycle's ask has dropped $5k (7%) from the opening price — seller is motivated, your offer sets the floor, not the list.
- Current owner paid $27k; list at $65k implies a 141% gain — meaningful room to come down on a strong offer.
Risks & watch-outs
- Watch-outs: property tax is 4.3% of price; HOA is 23% of rent.
- Climate carrying-cost: moderate wind risk, 23% chance of damaging wind over 30y; extreme-heat days projected 7→18/yr by 2055 (HVAC capex compounding) — expect insurance premiums to compound above CPI over the hold.
Questions for the listing agent
- Built in 1974 — when were the roof, HVAC, electrical panel, plumbing, and water heater last replaced?
- Property tax is high relative to price — has the assessment been appealed recently, and will the sale trigger a re-assessment?
- What does the HOA fee cover, when was the last increase, and are there any pending special assessments or reserve-fund shortfalls?
- Any open or pending special assessments — roof, HVAC, plumbing, elevator, façade? What's the per-unit balance and payoff schedule, and is the seller paying it off at close or rolling it to the buyer?
- Is there a deadline driving the sale (1031 exchange, divorce, estate, relocation)? That informs how much negotiation room exists.
- What's the average days-on-market for RENTAL listings here right now (not sales)? A rising rental-DOM trend means longer vacancies and softer asking-rent achievability than the comps imply.
- What's the recent tenant-quality profile in this submarket — average credit score on applications, eviction rate, late-payment / NSF rate, and stable-employment percentage? A property-management company in the area should have these aggregated.
- How much new apartment / multifamily construction is in the pipeline within 1–3 miles? Heavy new supply (>2% of stock underway) typically softens rents 12–24 months out; light construction supports rent growth.
Investment metrics
- 1% rule
- 2.53% ✓
- Cap rate
- 12.09%
- Cash-on-cash
- 20.69%
- DSCR
- 1.92
- GRM
- 3.3
CMA / ARV
- ARV (median comp)
- $101,667
- List price
- $65,000
- Delta
- -31.15%
- Verdict
- UNDERPRICED
- Comps
- 20 within 1.0 mi
Projected returns pro-forma
-3.0% appreciation · 1.31% rent growth · sell at horizon
- IRR
- 10.1%
- Equity multiple
- 1.39×
- Total profit
- $7,064
- Equity at exit
- $9,692
- IRR
- 17.0%
- Equity multiple
- 2.23×
- Total profit
- $22,434
- Equity at exit
- $5,620
Cash invested: $18,200 (down + closing). Projections, not guarantees.
Landlord ↔ Tenant lean methodology
- Overall (STATE)
- 90 Strongly Landlord-Friendly
- State Georgia
- 90 Strongly Landlord-Friendly · R+3
- County
- — inherits STATE
- City
- — inherits STATE
ZIP-level market 30083
- Rents YoY
- 1.3%
- Active inventory
- 257
- Price-to-rent
- 3.3×
Monthly cashflow live
- Estimated rent
- $1,642 high interval (Pro) →
- Mortgage (P&I)
- −$341
- Tax from tax record
- −$230 /mo · $2,763/yr
- Insurance
- −$27
- HOA
- −$385
- Vacancy / Maint / Mgmt
- −$345
- Net cashflow
- $314
Break-even live
UW: 25.0% down · 7.5% · 30yr · 1.5% tax · 5.0% vac · 8.0% maint · 8.0% mgmt
Financing live
Cash to close
- Down payment
- $16,250
- Closing costs
- $1,950
- Reserves months
- —
- Total cash needed
- —
Loan-product check · same deal, 3 products live
Conventional
25% down · 7.5% · 30yr
- Down + closing
- —
- Monthly P&I
- —
- Monthly cashflow
- —
- DSCR
- —
- Eligible?
- —
Personal DTI + credit; lowest rate.
DSCR
20% down · 8.5% · 30yr
- Down + closing
- —
- Monthly P&I
- —
- Monthly cashflow
- —
- DSCR
- —
- Eligible?
- —
No personal income docs; deal must DSCR.
Hard money
10% down · 12.0% · 12mo
- Down + closing
- —
- Monthly P&I
- —
- Monthly cashflow
- —
- DSCR
- —
- Eligible?
- —
Short-term bridge; refi at stabilization.
Rent comps 34 comps
| Address | Beds | Baths | Sqft | Rent | $/sqft | DOM | Units | Dist |
|---|---|---|---|---|---|---|---|---|
| 1900 Tree Mountain Pkwy Stone Mountain, GA | 1.0–2.0 | 1.0–2.5 | 1118 | $1,200 | $1.07 | 1d | 25 | 0.18mi |
| 1313 Stone Mill Way Stone Mountain, GA | 1.0–4.0 | 1.0–2.5 | 1004 | $1,633 | $1.63 | 15d | 12 | 0.31mi |
| 1310 Wood Bend Dr Stone Mountain, GA | 1.0–2.0 | 1.0–2.0 | 909 | $1,500 | $1.65 | 1d | 78 | 0.38mi |
| 4996 Sheila Ln Stone Mountain, GA | 4.0 | 2.0 | 1450 | $1,890 | $1.30 | 1d | 1 | 0.67mi |
| 4923 Sheila Ln Stone Mountain, GA | 3.0 | 2.0 | 1266 | $1,200 | $0.95 | 43d | 1 | 0.76mi |
| 4959 Demere Ct Stone Mountain, GA | 3.0 | 2.0 | 1695 | $2,000 | $1.18 | 12d | 1 | 0.79mi |
| 4840 Hairston Park Sq Stone Mountain, GA | 3.0 | 2.5 | 1560 | $1,795 | $1.15 | 3d | 1 | 0.84mi |
| 4840 Hairston Park Sq Stone Mountain, GA | 3.0 | 2.5 | 1560 | $1,845 | $1.18 | 43d | 1 | 0.84mi |
| 1248 Park Blvd Stone Mountain, GA | 3.0 | 2.0 | 1350 | $1,880 | $1.39 | 43d | 1 | 0.84mi |
| 4832 Hairston Park Sq Stone Mountain, GA | 3.0 | 2.5 | 1560 | $1,800 | $1.15 | 20d | 1 | 0.84mi |
| 4958 Central Dr Apt D Stone Mountain, GA | 2.0 | 1.0 | 900 | $995 | $1.11 | 22d | 1 | 0.86mi |
| 4900 Central Dr Stone Mountain, GA | 1.0–3.0 | 1.0–2.0 | 1100 | $1,725 | $1.57 | 1d | 15 | 0.88mi |
| 200 Summit Lake Dr Stone Mountain, GA | 3.0 | 2.0 | 1486 | $1,809 | $1.22 | 22d | 1 | 0.93mi |
| 200 Summit Lake Dr Stone Mountain, GA | 2.0 | 2.0 | 1175 | $1,389 | $1.18 | 12d | 1 | 0.93mi |
| 205 Summit Lake Dr Stone Mountain, GA | 2.0 | 2.0 | 1155 | $1,634 | $1.41 | 43d | 1 | 0.93mi |
| 205 Summit Lake Dr Stone Mountain, GA | 2.0 | 2.0 | 1175 | $1,559 | $1.33 | 12d | 1 | 0.93mi |
| 1047 Ridge Ave Stone Mountain, GA | 3.0 | 1.0 | 1402 | $2,150 | $1.53 | 24d | 1 | 0.99mi |
| 1 Chatfield Dr Stone Mountain, GA | 1.0–3.0 | 1.0–2.5 | 1060 | $1,565 | $1.48 | 2d | 20 | 1.01mi |
| 1010 Sexton Dr Stone Mountain, GA | 2.0 | 2.0 | 1000 | $1,250 | $1.25 | 12d | 1 | 1.02mi |
| 5100 W Mountain St Stone Mountain, GA | 1.0–3.0 | 1.0–2.0 | 1150 | $1,484 | $1.29 | 3d | 11 | 1.02mi |
| 1150 Rankin St Stone Mountain, GA | 2.0 | 2.5 | 1495 | $1,850 | $1.24 | 24d | 1 | 1.03mi |
| 1311 Old Countryside Cir Stone Mountain, GA | 3.0 | 2.5 | 1381 | $2,101 | $1.52 | 5d | 1 | 1.03mi |
| 1700 Weatherly Dr Stone Mountain, GA | 1.0–2.0 | 1.0–2.0 | 769 | $1,215 | $1.58 | 5d | 1 | 1.05mi |
| 1150 Rankin St Stone Mountain, GA | 2.0–3.0 | 2.5 | 1437 | $1,850 | $1.29 | 43d | 2 | 1.06mi |
| 5030 W Mountain St Stone Mountain, GA | 2.0 | 1.0 | 1175 | $1,199 | $1.02 | 43d | 1 | 1.06mi |
| 1305 Old Countryside Cir W Stone Mountain, GA | 3.0 | 2.0 | 1132 | $1,719 | $1.52 | 16d | 1 | 1.08mi |
| 1173 N Hairston Rd Stone Mountain, GA | 2.0 | 1.0–2.0 | 1161 | $1,426 | $1.23 | 1d | 30 | 1.09mi |
| 1259 Old Countryside Cir Stone Mountain, GA | 3.0 | 2.0 | 1309 | $1,795 | $1.37 | 43d | 1 | 1.12mi |
| 1075 N Hairston Rd Stone Mountain, GA | 1.0–3.0 | 1.0–2.0 | 992 | $1,540 | $1.55 | 5d | 12 | 1.13mi |
| 967 Pine Roc Dr Stone Mountain, GA | 3.0 | 2.0 | 1206 | $1,900 | $1.58 | 10d | 1 | 1.17mi |
| 1073 Thornwoode Ln Stone Mountain, GA | 3.0 | 2.5 | 1235 | $697 | $0.56 | 22d | 1 | 1.18mi |
| 1509 Kilmuir Way Stone Mountain, GA | 2.0 | 2.5 | 1160 | $1,550 | $1.34 | 43d | 1 | 1.19mi |
| 1059 Mariners Dr Stone Mountain, GA | 2.0 | 1.5 | 1328 | $1,600 | $1.20 | 43d | 1 | 1.36mi |
| 1010 Mariners Ct Stone Mountain, GA | 3.0 | 2.0 | 1739 | $1,475 | $0.85 | 43d | 1 | 1.39mi |
HOA detail condo
- Monthly dues
- $385 · $4,620/yr
- Assessments
- None detected in remarks — confirm with the listing agent.
Listing history 28 events
-
2026-06-18days on market $65,000 Active 7 DOM
-
2026-06-17days on market $65,000 Active 6 DOM
-
2026-06-16days on market $65,000 Active 5 DOM
-
2026-06-15days on market $65,000 Active 4 DOM
-
2026-06-13statusdays on market $65,000 Active 2 DOM
-
2026-06-10remarks 699-char remark
-
2026-06-10pricestatusdays on market $65,000 New 1 DOM
-
2026-06-03days on market $70,000 Active 84 DOM
-
2026-06-02days on market $70,000 Active 83 DOM
-
2026-06-01days on market $70,000 Active 82 DOM
-
2026-05-31days on market $70,000 Active 81 DOM
-
2026-03-11$70,000 Active 685-char remark
Show marketing remark (685 chars)
Discover the perfect blend of comfort, convenience, and peace of mind in this beautifully maintained 2bedroom, 1.5bath home, tucked away in a quiet, wellkept community. The spacious layout features generously sized bedrooms, an inviting living area, and an updated kitchen. All major systems and components replaced within the last year. Located just minutes from Stone Mountain Park, shopping, schools, and major commuter routes, this home offers the lifestyle and accessibility buyers want. The home price is set to sell, and the seller is highly motivated. Opportunities like this are rare and move quickly. Call today to schedule a viewing and make this home yours before its gone.
-
2026-03-11historical
Show marketing remark (685 chars)
Discover the perfect blend of comfort, convenience, and peace of mind in this beautifully maintained 2bedroom, 1.5bath home, tucked away in a quiet, wellkept community. The spacious layout features generously sized bedrooms, an inviting living area, and an updated kitchen. All major systems and components replaced within the last year. Located just minutes from Stone Mountain Park, shopping, schools, and major commuter routes, this home offers the lifestyle and accessibility buyers want. The home price is set to sell, and the seller is highly motivated. Opportunities like this are rare and move quickly. Call today to schedule a viewing and make this home yours before its gone.
-
2026-03-10$70,000 New
-
2026-01-03status Under Contract
-
2025-12-16historical
-
2025-12-11$85,000 New
-
2018-04-16soldstatus $27,000
-
2018-02-28soldstatus $27,000 Sold
-
2018-02-12status Under Contract
-
2018-02-09$29,500 New
-
2018-02-01historical
-
2018-01-27$29,500 New
-
2007-07-12soldstatus $69,000
-
2004-04-13soldstatus $70,000
-
2004-01-06soldstatus $40,000
-
1994-04-18soldstatus $42,500
-
1990-06-06soldstatus $40,800
ⓘ Source: listings_history table (triggers on properties + properties_extension) + one-shot
backfill from property_details.listing_events for pre-trigger history.
Tax reassessment forecast GA · Resets to sale price
- Current annual tax
- $2,763 · $230/mo
- Projected year-2 tax
- $2,763 · $230/mo
- Expected delta
- $0/yr ($0/mo · 0.0%)
ⓘ Screening estimate from a state-policy table — verify with the county assessor before closing.
Climate risk First Street
- Flood 1/10 Low FEMA zone X (unshaded) · 0% chance over 30 yrs
- Wildfire 3/10 Moderate
- Heat 5/10 Major 7 d/yr ≥104°F today · 18 d/yr by 30 yrs out
- Wind 5/10 Major 23% chance of damaging wind over 30 yrs
- Air quality 6/10 Major 8 unhealthy d/yr today · 11 by 30 yrs out
Nearby sold comps map
Loading sold comps map…
Walkable amenities ~0.75 mi
Loading nearby amenities…
Taxation est. · year 1
- Rental income
- $19,701
- − Mortgage interest
- −$3,641
- − Property taxes
- −$2,763
- − Insurance
- −$325
- − Repairs & maintenance
- −$1,576
- − Management
- −$1,576
- − HOA
- −$4,620
- − Depreciation
- −$1,891
- Taxable income
- $3,310
- Est. tax owed @ 24.0%
- −$794
- After-tax cash flow
- $2,972/yr
For passive investors: Depreciation is non-cash, so a rental often shows a tax loss while cash-flowing — sheltering income. Rental losses are passive: they offset passive income freely, and up to $25,000/yr can offset ordinary (W-2) income if you actively participate and your MAGI is under $100k (phasing out to $0 by $150k); unused losses carry forward. On sale, claimed depreciation is recaptured at up to 25%, and gains may owe capital-gains tax (a 1031 exchange can defer both). Figures are a year-1 estimate at your 24.0% rate — not tax advice; consult a CPA.
Schools (NCES district)
- District
- Dekalb County
- NCES district ID
- 1301740
- Math proficiency
- 19% ▼ -12.00%
- Reading proficiency
- 28% ▼ -7.00%
- Median HH income
- $51,448
- Composite
- 20.92/100
- National rank
- #8482
- State rank
- #125 of 174 in GA
Livability — Tucker
No livability data for this city. (Only ~50 U.S. cities are tracked.)
Census & demographics
- Census place
- Tucker, GA
- County
- Dekalb County · 782,738 people
- City population
- 38,242
- Metro
- Atlanta-Sandy Springs-Alpharetta, GA
- Population (ZIP)
- 62,724
- Household income
- $55,307
- Rent vs Own
- Severe rent burden
- 3574.0
Population outlook (DeKalb County) Hauer SSP2
- Today (2025)
- 839,977 people
- By 2030
- 891,768 · +6.2%
- By 2040
- 988,894 · +17.7%
- By 2050
- 1,074,583 · +27.9%
- By 2075
- 1,245,026 · +48.2%
- By 2100
- 1,303,135 · +55.1%
Race, ethnicity, and origin ACS 2023
- Neighborhood character
- Predominantly Black (75%)
- Race & ethnicity
- Black 75% White 8% Asian 8% Hispanic / Latino 5% Two or more races 5%
- Common ancestry
- Arab 1%
- Foreign-born
- 24% · Canada, Vietnam, India
- Languages at home
- 71% English-only · Spanish 4% Other Indo-European 4% Vietnamese 2%
Political lean MEDSL · DeKalb
- 2024 margin
- Solid D (+64.8) · D 81.9% · R 17.1% · Other 1.0%
- 2008→2024 swing
- +6.1pp toward D · 2008: 58.6pp · 2024: 64.8pp
- All cycles
- 2024: D+64.8 2020: D+67.4 2016: D+64.8 2012: D+56.8 2008: D+58.6
Not yet ingested
- Civics
- —
Market trends
- HPI YoY
- ▼ -213.61%
- Current HPI
- 216.2527
- Rent YoY
- ▲ 1.31%
- Metro
- Atlanta-Sandy Springs-Alpharetta, GA
- State GDP YoY
- ▲ 2.66%
- F500 in state
- 28
Industry mix (Fortune 500 HQ in GA)
| Industry | F500 HQs | Revenue |
|---|---|---|
| Paper / Packaging | 2 | $29B |
|
||
| Retail | 1 | $160B |
|
||
| Transportation / Logistics | 1 | $91B |
|
||
| Airlines | 1 | $62B |
|
||
| Consumer Goods | 1 | $47B |
|
||
| Utilities | 1 | $25B |
|
||
Price history
+71.6% since first listed17 events — show timeline
- 2026-03-11 Listed $70,000 ForSaleByOwner.com
- 2026-03-11 Listing Removed — GAMLS
- 2026-03-10 Listed $70,000 GAMLS
- 2026-01-03 Pending — GAMLS
- 2025-12-16 Listing Removed — GAMLS
- 2025-12-11 Listed $85,000 GAMLS
- 2018-04-16 Sold (Public Records) $27,000 Public Records
- 2018-02-28 Sold (MLS) $27,000 GAMLS
- 2018-02-12 Pending — GAMLS
- 2018-02-09 Listed $29,500 GAMLS
- 2018-02-01 Listing Removed — GAMLS
- 2018-01-27 Listed $29,500 GAMLS
- 2007-07-12 Sold (Public Records) $69,000 Public Records
- 2004-04-13 Sold (Public Records) $70,000 Public Records
- 2004-01-06 Sold (Public Records) $40,000 Public Records
- 1994-04-18 Sold (Public Records) $42,500 Public Records
- 1990-06-06 Sold (Public Records) $40,800 Public Records
Property tax history
+9.6%/yrLatest (2025): $2,763 · -18.3% YoY. Source: county tax records.
Cash-flow waterfall
monthlySold comps — $/sqft
last 12 mo · ≤1 miLoading sold comps…