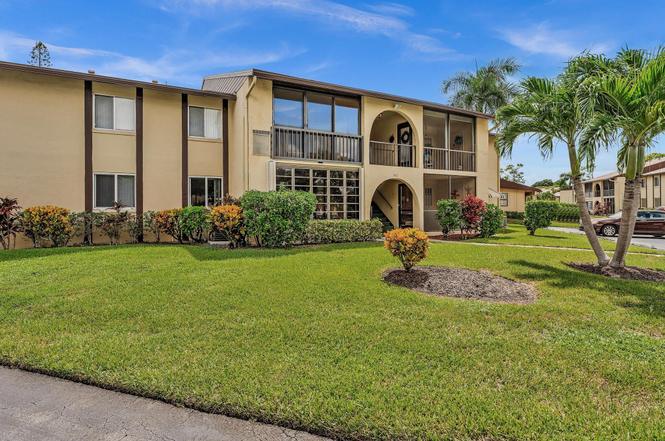
342 Pine Ridge Cir Unit D-2 · Greenacres, FL
Flood risk 1/10 · Minimal
- FEMA flood zone
- X (unshaded)
- Chance of flooding over 30 yrs
- 0.0%
- Est. flood insurance / yr
- $507 – $1,088
Fire risk 1/10 · Minimal
- Est. fire insurance / yr
- $947 – $1,759
Heat risk 9/10 · Severe
- Hot days now (above 105°F)
- 7 days/yr
- Hot days in 30 yrs
- 24 days/yr
Wind risk 10/10 · Severe
- Chance of severe wind over 30 yrs
- 99.0%
Air-quality risk 2/10 · Minimal
- Unhealthy air days now
- 0 days/yr
- Unhealthy air days in 30 yrs
- 2 days/yr
Risk factors via First Street. Map © Google.
Why this score? — see what drove the C- grade
The composite is a weighted blend of 9 inputs, each scored 0–100. Each bar is that input's sub-score; the figure is the points it added to the 100-point composite (weight × sub-score).
- Cash flow +19.4/30.0
- 1% rule +7.8/10.0
- ARV discount +7.5/15.0
- DSCR +6.1/10.0
- Schools +4.3/10.0
- Livability +3.5/5.0
- Rent growth +2.8/5.0
- Condition / age +2.5/5.0
- Appreciation +0.0/10.0
$125,000
🖨 Deal sheet 📄 Offer letter ✓ Due diligence
Listing remarks MLS
Location, Location, Location! This turnkey fully furnished condo is ready for you to call home! Located just a short walk from the clubhouse, pool, and tennis court.
Key facts
- Newer ac
- Screened patio
- New ss appliances
Tags
Property features AI
Finance
- HOA & community: Monthly HOA ($341) covering cable TV, insurance, grounds maintenance, trash and common areas; Community amenities: clubhouse, pool, tennis courts, community room, sidewalks, parking; Senior community; Pets allowed (restrictions possible)
Exterior
- Parking: Assigned parking
- Utilities: Public water; Public sewer; Cable available; Water available; Sewer available
- Home design: Condominium; 2-story building; Faces east; Resale property
- Construction: CBS construction
- Exterior features: Patio; Not waterfront
Interior
- Kitchen: Dishwasher; Microwave; Refrigerator
- Bedrooms: 1 main-level bedroom
- Flooring: Laminate
- Bathrooms: 1 full bathroom (main level)
- Heating & cooling: Central heating; Central air conditioning
- Interior features: Walk-in closet(s); Unfurnished
- Laundry & utility: Laundry inside
Neighborhood map
What this means for you Summary
Snapshot
- This is a 1-bed/1.0-bath condo listed at $125k.
Deal economics
- At list price, monthly cash flow is $140 ($2k/yr) — positive.
- The deal already cash-flows at list — no discount required.
- Meets the 1% rule at list price ($2k rent vs $125k).
- Recommended offer: $110k (12.0% below list) — sets the bar for market timing.
Location & tenants
- Location reads 69/100 on livability (#490 in FL) — a middle-class / working-renter tenant base. Strengths: cost of living A+, housing A+, health & safety A; Watch: employment D, amenities F, commute F.
- Palm Beach (suburban): math 46% / reading 53% proficiency, ranked #34 of 73 in FL (top 47%) — families likely to look elsewhere, expect single-tenant / working-renter base with shorter leases.
- Zoned schools: Liberty Park Elementary School (math 25% / reading 38%, grade F, #1,841 of 2,144 statewide, top 86%, 845 students, 76% FRL); L C Swain Middle School (math 26% / reading 33%, grade F, #469 of 571 statewide, top 84%, 1,451 students, 74% FRL) — zoned schools average 75% FRL vs 52% district-wide (23 pts higher); higher-poverty schools than district average — tighter screening recommended.
- Zoned-school proficiency averages 30% at this address vs 50% district-wide (-19 pts) — the specific schools serving this property underperform the Palm Beach average; the district grade overstates school quality for this exact location.
- Market conditions: Rents rising (+1.3%/yr); 346 active listings in the ZIP; 21 comparable units currently listed for rent nearby; rentals at typical pace (median 24d on market — plan ~3-4 weeks tenant-placement turnaround); 3,974 units permitted in Palm Beach County in 2024 (1,012 in 5+ unit buildings).
Forward outlook
- Local home prices are declining (-3.0%/yr); year-one equity from $864 of loan paydown is wiped out by about $4k of value loss. Plan a longer hold.
- Palm Beach County population projected at +30% by 2050 — long-run rental-demand tailwind backs the buy-and-hold thesis.
Negotiation context
- It's been on market 269 days — a 12% lower offer ($110k) is reasonable based on typical stale-listing flexibility.
- 2 sale attempts since 5y ago; this cycle's ask has dropped $10k (7%) from the opening price — seller is motivated, your offer sets the floor, not the list.
Risks & watch-outs
- Watch-outs: HOA is 21% of rent.
- Climate carrying-cost: severe wind risk, 99% chance of damaging wind over 30y; extreme-heat days projected 7→24/yr by 2055 (HVAC capex compounding) — expect insurance premiums to compound above CPI over the hold.
Questions for the listing agent
- It's been on market 269 days. Have you received any prior offers? Is the seller open to a 12% concession, seller financing, or rate buy-down credit?
- What does the HOA fee cover, when was the last increase, and are there any pending special assessments or reserve-fund shortfalls?
- Any open or pending special assessments — roof, HVAC, plumbing, elevator, façade? What's the per-unit balance and payoff schedule, and is the seller paying it off at close or rolling it to the buyer?
- Why hasn't it sold? Are there any deal-killer items the seller is aware of (foundation, flood, title, zoning, code violations)?
- Is there a deadline driving the sale (1031 exchange, divorce, estate, relocation)? That informs how much negotiation room exists.
- Schools are D-rated, which usually means shorter tenancies and higher turnover. Who's the typical renter profile here, and what's been the actual vacancy rate?
- What's the average days-on-market for RENTAL listings here right now (not sales)? A rising rental-DOM trend means longer vacancies and softer asking-rent achievability than the comps imply.
- What's the recent tenant-quality profile in this submarket — average credit score on applications, eviction rate, late-payment / NSF rate, and stable-employment percentage? A property-management company in the area should have these aggregated.
- How much new apartment / multifamily construction is in the pipeline within 1–3 miles? Heavy new supply (>2% of stock underway) typically softens rents 12–24 months out; light construction supports rent growth.
Investment metrics
- 1% rule
- 1.28% ✓
- Cap rate
- 7.64%
- Cash-on-cash
- 4.81%
- DSCR
- 1.21
- GRM
- 6.5
CMA / ARV
No comps found within radius.
Projected returns pro-forma
-3.0% appreciation · 1.33% rent growth · sell at horizon
- IRR
- -11.0%
- Equity multiple
- 0.61×
- Total profit
- $-13,778
- Equity at exit
- $18,638
- IRR
- -4.9%
- Equity multiple
- 0.71×
- Total profit
- $-10,248
- Equity at exit
- $10,808
Cash invested: $35,000 (down + closing). Projections, not guarantees.
Landlord ↔ Tenant lean methodology
- Overall (STATE)
- 87 Strongly Landlord-Friendly
- State Florida
- 87 Strongly Landlord-Friendly · R+3
- County
- — inherits STATE
- City
- — inherits STATE
ZIP-level market 33463
- Home prices YoY
- -30.9%
- Rents YoY
- 1.3%
- Active inventory
- 346
- Price-to-rent
- 6.5×
Monthly cashflow live
- Estimated rent
- $1,604 high interval (Pro) →
- Mortgage (P&I)
- −$656
- Tax from tax record
- −$78 /mo · $939/yr
- Insurance
- −$52
- HOA
- −$341
- Vacancy / Maint / Mgmt
- −$337
- Net cashflow
- $140
Break-even live
UW: 25.0% down · 7.5% · 30yr · 1.5% tax · 5.0% vac · 8.0% maint · 8.0% mgmt
Financing live
Cash to close
- Down payment
- $31,250
- Closing costs
- $3,750
- Reserves months
- —
- Total cash needed
- —
Loan-product check · same deal, 3 products live
Conventional
25% down · 7.5% · 30yr
- Down + closing
- —
- Monthly P&I
- —
- Monthly cashflow
- —
- DSCR
- —
- Eligible?
- —
Personal DTI + credit; lowest rate.
DSCR
20% down · 8.5% · 30yr
- Down + closing
- —
- Monthly P&I
- —
- Monthly cashflow
- —
- DSCR
- —
- Eligible?
- —
No personal income docs; deal must DSCR.
Hard money
10% down · 12.0% · 12mo
- Down + closing
- —
- Monthly P&I
- —
- Monthly cashflow
- —
- DSCR
- —
- Eligible?
- —
Short-term bridge; refi at stabilization.
Rent comps 21 comps
| Address | Beds | Baths | Sqft | Rent | $/sqft | DOM | Units | Dist |
|---|---|---|---|---|---|---|---|---|
| 5855 S 37th St Unit 5857 Greenacres, FL | 2.0 | 1.0 | 747 | $1,974 | $2.64 | 7d | 1 | 0.36mi |
| 2715 Emory Dr W Unit C West Palm Beach, FL | 1.0 | 1.5 | 661 | $1,425 | $2.16 | 17d | 1 | 0.68mi |
| 2854 Crosley Dr E Unit J West Palm Beach, FL | 1.0 | 1.0 | 612 | $1,300 | $2.12 | 24d | 1 | 0.74mi |
| 2805 Crosley Dr E Unit E West Palm Beach, FL | 1.0 | 1.5 | 662 | $1,250 | $1.89 | 24d | 1 | 0.75mi |
| 2647 Emory Dr W Unit C West Palm Beach, FL | 1.0 | 1.0 | 612 | $1,250 | $2.04 | 24d | 1 | 0.76mi |
| 2723 Dudley Dr W Unit G West Palm Beach, FL | 1.0 | 1.0 | 611 | $1,300 | $2.13 | 24d | 1 | 0.76mi |
| 2607 Dudley Dr W Unit L West Palm Beach, FL | 1.0 | 1.0 | 611 | $1,300 | $2.13 | 7d | 1 | 0.84mi |
| 4904 Dillon St Unit C Greenacres, FL | 1.0 | 1.0 | 699 | $1,450 | $2.07 | 24d | 1 | 0.85mi |
| 2551 Emory Dr W Unit A West Palm Beach, FL | 1.0 | 1.5 | 661 | $1,600 | $2.42 | 24d | 1 | 0.86mi |
| 2951 Ashley Dr W Unit D West Palm Beach, FL | 1.0 | 1.5 | 662 | $1,450 | $2.19 | 17d | 1 | 0.87mi |
| 2951 Ashley Dr W West Palm Beach, FL | 1.0 | 1.5 | 662 | $1,525 | $2.30 | 20d | 1 | 0.87mi |
| 2966 Ashley Dr E Unit C West Palm Beach, FL | 1.0 | 1.0 | 611 | $1,375 | $2.25 | 24d | 1 | 0.99mi |
| 1600 Island Shores Dr Greenacres, FL | 1.0–2.0 | 1.0–2.0 | 889 | $1,660 | $1.87 | 24d | 2 | 1.05mi |
| 2206 Laurel Way West Palm Beach, FL | 1.0–3.0 | 1.0–2.0 | 850 | $1,700 | $2.00 | 24d | 3 | 1.24mi |
| 2550 Lakehaven Rd West Palm Beach, FL | 1.0 | 1.0 | 400 | $1,500 | $3.75 | 24d | 1 | 1.26mi |
| 133 Lake Pine Cir Unit B1 Greenacres, FL | 1.0 | 1.0 | 639 | $1,450 | $2.27 | 24d | 1 | 1.29mi |
| 133 Lake Pine Cir Greenacres, FL | 1.0 | 1.0 | 639 | $1,300 | $2.03 | 18d | 1 | 1.29mi |
| 4819 Gladiator Cir Greenacres, FL | — | 1.0 | 440 | $1,500 | $3.41 | 22d | 1 | 1.40mi |
| 4120 Tivoli Ct #305 Lake Worth, FL | 1.0 | 1.0 | 704 | $1,750 | $2.49 | 24d | 1 | 1.42mi |
| 4230 Deste Ct Unit 305 Greenacres, FL | 1.0 | 1.0 | 716 | $1,900 | $2.65 | 5d | 1 | 1.46mi |
| 4236 Deste Ct #108 Greenacres, FL | 1.0 | 1.0 | 716 | $1,800 | $2.51 | 17d | 1 | 1.49mi |
HOA detail condo
- Monthly dues
- $341 · $4,092/yr
- Likely covers
- pool
- Assessments
- None detected in remarks — confirm with the listing agent.
Listing history 21 events
-
2026-06-18days on market $125,000 Active 269 DOM
-
2026-06-17days on market $125,000 Active 268 DOM
-
2026-06-16days on market $125,000 Active 267 DOM
-
2026-06-15days on market $125,000 Active 266 DOM
-
2026-06-13days on market $125,000 Active 264 DOM
-
2026-06-09days on market $125,000 Active 260 DOM
-
2026-06-07days on market $125,000 Active 258 DOM
-
2026-06-04days on market $125,000 Active 255 DOM
-
2026-06-03days on market $125,000 Active 254 DOM
-
2026-06-01days on market $125,000 Active 252 DOM
-
2026-05-31days on market $125,000 Active 251 DOM
-
2025-10-16price $125,000
-
2025-09-22$135,000 Active
-
2022-01-07soldstatus $110,500
-
2021-12-28soldstatus $110,500 Closed 165-char remark
Show marketing remark (165 chars)
Location, Location, Location! This turnkey fully furnished condo is ready for you to call home! Located just a short walk from the clubhouse, pool, and tennis court.
-
2021-12-08historical Active Under Contract 165-char remark
Show marketing remark (165 chars)
Location, Location, Location! This turnkey fully furnished condo is ready for you to call home! Located just a short walk from the clubhouse, pool, and tennis court.
-
2021-12-01$100,000 Active 165-char remark
Show marketing remark (165 chars)
Location, Location, Location! This turnkey fully furnished condo is ready for you to call home! Located just a short walk from the clubhouse, pool, and tennis court.
-
2021-11-29historical $100,000 165-char remark
Show marketing remark (165 chars)
Location, Location, Location! This turnkey fully furnished condo is ready for you to call home! Located just a short walk from the clubhouse, pool, and tennis court.
-
2013-04-30soldstatus $25,500
-
1990-10-25soldstatus $32,000
-
1980-04-01soldstatus $30,500
ⓘ Source: listings_history table (triggers on properties + properties_extension) + one-shot
backfill from property_details.listing_events for pre-trigger history.
Tax reassessment forecast FL · Resets to sale price
- Current annual tax
- $939 · $78/mo
- Projected year-2 tax
- $1,038 · $86/mo
- Expected delta
- +$99/yr (+$8/mo · 10.5%)
ⓘ Screening estimate from a state-policy table — verify with the county assessor before closing.
Climate risk First Street
- Flood 1/10 Low FEMA zone X (unshaded) · 0% chance over 30 yrs
- Wildfire 1/10 Low
- Heat 9/10 Extreme 7 d/yr ≥105°F today · 24 d/yr by 30 yrs out
- Wind 10/10 Extreme 99% chance of damaging wind over 30 yrs
- Air quality 2/10 Low 0 unhealthy d/yr today · 2 by 30 yrs out
Nearby sold comps map
Loading sold comps map…
Walkable amenities ~0.75 mi
Loading nearby amenities…
Taxation est. · year 1
- Rental income
- $19,249
- − Mortgage interest
- −$7,002
- − Property taxes
- −$939
- − Insurance
- −$625
- − Repairs & maintenance
- −$1,540
- − Management
- −$1,540
- − HOA
- −$4,092
- − Depreciation
- −$3,636
- Taxable loss
- −$125
- Est. tax savings @ 24.0%
- +$30
- After-tax cash flow
- $1,715/yr
For passive investors: Depreciation is non-cash, so a rental often shows a tax loss while cash-flowing — sheltering income. Rental losses are passive: they offset passive income freely, and up to $25,000/yr can offset ordinary (W-2) income if you actively participate and your MAGI is under $100k (phasing out to $0 by $150k); unused losses carry forward. On sale, claimed depreciation is recaptured at up to 25%, and gains may owe capital-gains tax (a 1031 exchange can defer both). Figures are a year-1 estimate at your 24.0% rate — not tax advice; consult a CPA.
Schools (NCES district)
- District
- Palm Beach
- NCES district ID
- 1201500
- Math proficiency
- 46% ▼ -16.00%
- Reading proficiency
- 53% ▼ -4.00%
- Median HH income
- $53,943
- Composite
- 42.72/100
- National rank
- #3160
- State rank
- #34 of 73 in FL
Livability — Greenacres
- Score
- 69/100
- State rank
- #490
- US rank
- #9008
Category grades
Schools grade is shown separately in the Schools card above.
Census & demographics
- Census place
- Greenacres, FL
- County
- Palm Beach County · 1,438,312 people
- City population
- 65,478
- Metro
- Miami-Fort Lauderdale-Pompano Beach, FL
- Population (ZIP)
- 65,478
- Household income
- $73,865
- Rent vs Own
- Severe rent burden
- 1466.0
Population outlook (Palm Beach County) Hauer SSP2
- Today (2025)
- 1,637,487 people
- By 2030
- 1,743,255 · +6.5%
- By 2040
- 1,948,712 · +19.0%
- By 2050
- 2,132,979 · +30.3%
- By 2075
- 2,530,027 · +54.5%
- By 2100
- 2,706,979 · +65.3%
Race, ethnicity, and origin ACS 2023
- Neighborhood character
- Diverse neighborhood (Simpson 0.70)
- Race & ethnicity
- Hispanic / Latino 38% Black 29% White 27% Two or more races 11% Asian 4%
- Hispanic origin (detail)
- Mexican 8% Puerto Rican 6% Cuban 5% Dominican 2%
- Common ancestry
- Hispanic 15% Romanian 1% Slovak 1%
- Foreign-born
- 39% · Canada, Jamaica, China
- Languages at home
- 45% English-only · Spanish 32% French/Haitian/Cajun 17% Other Indo-European 2%
Political lean MEDSL · Palm Beach
- 2024 margin
- Toss-up / Even · D 50.0% · R 49.2%
- 2008→2024 swing
- -22.1pp toward R · 2008: 22.9pp · 2024: 0.8pp
- All cycles
- 2024: D+0.8 2020: D+12.8 2016: D+15.3 2012: D+17.0 2008: D+22.9
Not yet ingested
- Civics
- —
Market trends
- HPI YoY
- ▼ -175.33%
- Current HPI
- 392.055
- Rent YoY
- ▲ 1.33%
- Metro
- Miami-Fort Lauderdale-Pompano Beach, FL
- State GDP YoY
- ▲ 3.28%
- F500 in state
- 36
Industry mix (Fortune 500 HQ in FL)
| Industry | F500 HQs | Revenue |
|---|---|---|
| Industrial Technology | 2 | $29B |
|
||
| Insurance | 2 | $17B |
|
||
| Retail | 1 | $60B |
|
||
| Technology Distribution | 1 | $58B |
|
||
| Homebuilding | 1 | $35B |
|
||
| Technology Manufacturing | 1 | $35B |
|
||
Price history
+309.8% since first listed10 events — show timeline
- 2025-10-16 Price Changed $125,000 Beaches MLS
- 2025-09-22 Listed $135,000 Beaches MLS
- 2022-01-07 Sold (Public Records) $110,500 Public Records
- 2021-12-28 Sold (MLS) $110,500 Beaches MLS
- 2021-12-08 Contingent — Beaches MLS
- 2021-12-01 Listed $100,000 Beaches MLS
- 2021-11-29 Coming Soon $100,000 Beaches MLS
- 2013-04-30 Sold (Public Records) $25,500 Public Records
- 1990-10-25 Sold (Public Records) $32,000 Public Records
- 1980-04-01 Sold (Public Records) $30,500 Public Records
Property tax history
+14.7%/yrLatest (2025): $939 · +5.6% YoY. Source: county tax records.
Cash-flow waterfall
monthlySold comps — $/sqft
last 12 mo · ≤1 miLoading sold comps…