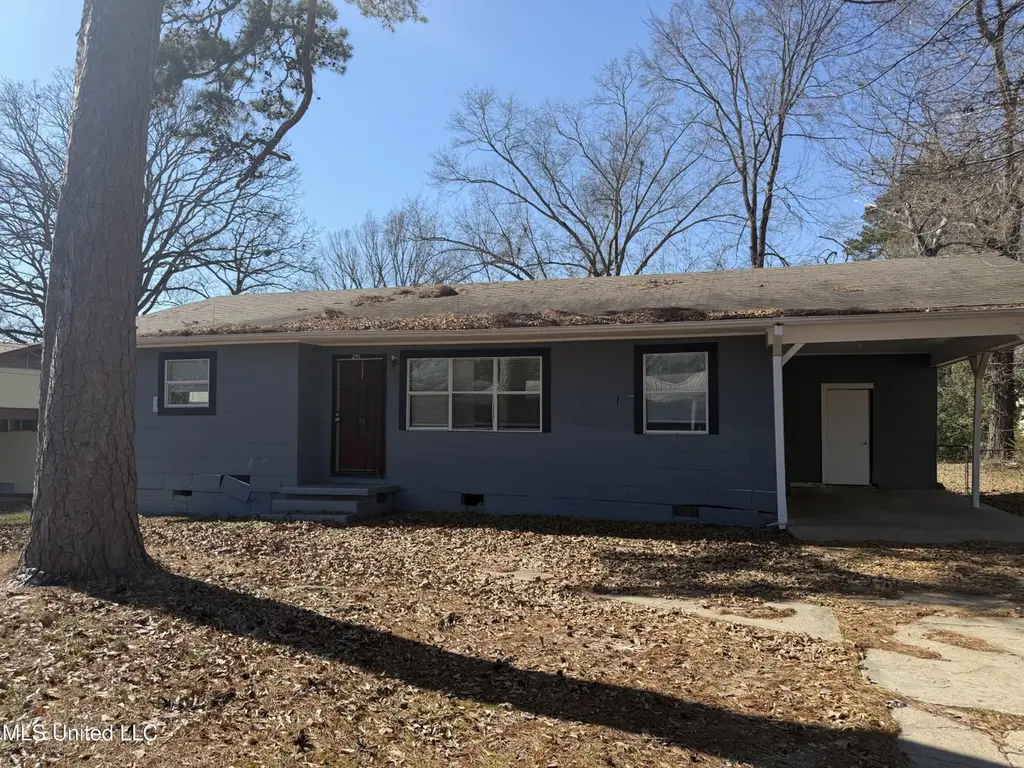
251 Maxine Dr · Pearl, MS
Flood risk 1/10 · Minimal
- FEMA flood zone
- X (unshaded)
- Chance of flooding over 30 yrs
- 0.0%
- Est. flood insurance / yr
- $507 – $1,088
Fire risk 2/10 · Minimal
- Est. fire insurance / yr
- $1,241 – $2,305
Heat risk 7/10 · Major
- Hot days now (above 108°F)
- 7 days/yr
- Hot days in 30 yrs
- 20 days/yr
Wind risk 8/10 · Major
- Chance of severe wind over 30 yrs
- 80.0%
Air-quality risk 2/10 · Minimal
- Unhealthy air days now
- 0 days/yr
- Unhealthy air days in 30 yrs
- 1 days/yr
Risk factors via First Street. Map © Google.
Why this score? — see what drove the B+ grade
The composite is a weighted blend of 9 inputs, each scored 0–100. Each bar is that input's sub-score; the figure is the points it added to the 100-point composite (weight × sub-score).
- Cash flow +30.0/30.0
- ARV discount +15.0/15.0
- DSCR +10.0/10.0
- 1% rule +9.5/10.0
- Rent growth +4.1/5.0
- Livability +3.7/5.0
- Schools +3.6/10.0
- Condition / age +2.5/5.0
- Appreciation +0.0/10.0
$119,900
🖨 Deal sheet 📄 Offer letter ✓ Due diligence
Listing remarks MLS
Welcome home to this freshly updated, move-in ready home featuring newer flooring throughout, fresh neutral paint, an updated kitchen with white cabinets and subway tile backsplash, refreshed bathroom with new tub/shower surround, and a functional layout with a dining area that flows into the main living space, plus a covered carport and a large fully fenced backyard with storage shed attached to carport—perfect for pets, play, or entertaining—so call your favorite agent today to schedule your private tour.
Key facts
- Covered carport
- Refreshed bathroom
- Updated kitchen
Tags
Neighborhood map
What this means for you Summary
Snapshot
- This is a 3-bed/1.0-bath single-family listed at $120k.
Deal economics
- At list price, monthly cash flow is $593 ($7k/yr) — positive.
- The deal already cash-flows at list — no discount required.
- Meets the 1% rule at list price ($2k rent vs $120k).
- Recommended offer: $106k (12.0% below list) — sets the bar for market timing.
- Cap rate 12.2% vs local median 5.5% in Pearl — top-decile yield for the area; either an underpriced asset or a hidden risk that comps aren't pricing in. Stress-test before assuming the spread holds.
Location & tenants
- Location reads 73/100 on livability (#19 in MS) — a middle-class / working-renter tenant base. Strengths: cost of living A+, housing A+, health & safety A+; Watch: schools D+, amenities F, commute F.
- Pearl Public School District (suburban): math 44% / reading 42% proficiency, ranked #32 of 130 in MS (top 25%) — families likely to look elsewhere, expect single-tenant / working-renter base with shorter leases.
- Market conditions: Rents rising fast (+6.3%/yr); 265 active listings in the ZIP; 2 comparable units currently listed for rent nearby; 343 units permitted in Rankin County in 2024 (0 in 5+ unit buildings).
- This rent runs 32% of the median local income ($65k/yr) — at the standard rent-burdened threshold; future hikes will face affordability resistance.
Forward outlook
- Local home prices are declining (-3.0%/yr); year-one equity from $829 of loan paydown is wiped out by about $4k of value loss. Plan a longer hold.
- Rankin County population projected at +17% by 2050 — long-run rental-demand tailwind backs the buy-and-hold thesis.
- At projected returns (-3.0% appreciation + 6.3% rent growth), your $34k cash investment doubles in ~5 years — after that, you're playing with house money.
Negotiation context
- It's been on market 133 days — a 12% lower offer ($106k) is reasonable based on typical stale-listing flexibility.
- 2 sale attempts since 21y ago; this cycle's ask has dropped $10k (8%) from the opening price — seller is motivated, your offer sets the floor, not the list.
Risks & watch-outs
- Climate carrying-cost: severe wind risk, 80% chance of damaging wind over 30y; extreme-heat days projected 7→20/yr by 2055 (HVAC capex compounding) — expect insurance premiums to compound above CPI over the hold.
Questions for the listing agent
- It's been on market 133 days. Have you received any prior offers? Is the seller open to a 12% concession, seller financing, or rate buy-down credit?
- Built in 1960 — when were the roof, HVAC, electrical panel, plumbing, and water heater last replaced?
- Why hasn't it sold? Are there any deal-killer items the seller is aware of (foundation, flood, title, zoning, code violations)?
- Is there a deadline driving the sale (1031 exchange, divorce, estate, relocation)? That informs how much negotiation room exists.
- Schools are D-rated, which usually means shorter tenancies and higher turnover. Who's the typical renter profile here, and what's been the actual vacancy rate?
- What's the average days-on-market for RENTAL listings here right now (not sales)? A rising rental-DOM trend means longer vacancies and softer asking-rent achievability than the comps imply.
- What's the recent tenant-quality profile in this submarket — average credit score on applications, eviction rate, late-payment / NSF rate, and stable-employment percentage? A property-management company in the area should have these aggregated.
- How much new for-sale + rental construction is in the pipeline within 1–3 miles? Heavy new supply typically softens prices + rents 12–24 months out; constrained supply supports both.
Investment metrics
- 1% rule
- 1.45% ✓
- Cap rate
- 12.23%
- Cash-on-cash
- 21.19%
- DSCR
- 1.94
- GRM
- 5.7
CMA / ARV
- ARV (median comp)
- $164,806
- List price
- $119,900
- Delta
- -27.25%
- Verdict
- UNDERPRICED
- Comps
- 20 within 1.0 mi
Show comp detail 12 sales within ~0.75 mi
| Address | Dist | Beds/Ba | Sqft | Sold | Price | $/sf | Match |
|---|---|---|---|---|---|---|---|
| 143 Pemberton Dr | 0.30mi | 3/1.0 | 1,075 (+2%) | 1mo | $150,000 | $140 | 82 |
| 3236 E Lisa Dr | 0.11mi | 3/1.0 | 1,011 (-4%) | 12mo | $174,900 | $173 | 78 |
| 179 Chotard Ave | 0.22mi | 3/1.5 | 1,032 (-2%) | 8mo | $123,480 | $120 | 77 |
| 3314 Dawn Dr | 0.42mi | 3/1.5 | 1,080 (+2%) | 1mo | $175,000 | $162 | 74 |
| 360 Mary Ann Dr | 0.03mi | 2/2.0 (-1) | 1,112 (+5%) | 12mo | $169,000 | $152 | 70 |
| 356 Saint Paul St | 0.67mi | 3/1.0 | 1,071 (+2%) | 4mo | $164,900 | $154 | 63 |
| 524 Sardis St | 0.23mi | 3/2.0 | 1,206 (+14%) | 3mo | $212,000 | $176 | 59 |
| 3454 Janet St | 0.70mi | 3/1.0 | 1,125 (+7%) | 1mo | $172,500 | $153 | 55 |
| 2709 Burma Dr | 0.68mi | 3/1.0 | 1,014 (-4%) | 9mo | $160,000 | $158 | 55 |
| 3237 Eastland Dr | 0.68mi | 3/1.0 | 1,022 (-3%) | 11mo | $175,000 | $171 | 54 |
| 484 Saint Jude St | 0.72mi | 3/1.0 | 1,107 (+5%) | 11mo | $174,900 | $158 | 49 |
| 259 Marilyn Dr | 0.74mi | 3/1.0 | 1,108 (+5%) | 13mo | $145,000 | $131 | 46 |
Match score weights: distance 35% · size 25% · config 20% · recency 20%. Top-matched comps best support the ARV.
Projected returns pro-forma
-3.0% appreciation · 6.34% rent growth · sell at horizon
- IRR
- 17.3%
- Equity multiple
- 1.73×
- Total profit
- $24,370
- Equity at exit
- $17,877
- IRR
- 28.0%
- Equity multiple
- 3.87×
- Total profit
- $96,414
- Equity at exit
- $10,367
Cash invested: $33,572 (down + closing). Projections, not guarantees.
Landlord ↔ Tenant lean methodology
- Overall (STATE)
- 90 Strongly Landlord-Friendly
- State Mississippi
- 90 Strongly Landlord-Friendly · R+11
- County
- — inherits STATE
- City
- — inherits STATE
ZIP-level market 39208
- Home prices YoY
- -20.3%
- Rents YoY
- 6.3%
- Active inventory
- 265
- Price-to-rent
- 5.7×
Monthly cashflow live
- Estimated rent
- $1,742 medium interval (Pro) →
- Mortgage (P&I)
- −$629
- Tax from tax record
- −$105 /mo · $1,254/yr
- Insurance
- −$50
- HOA
- −$0
- Vacancy / Maint / Mgmt
- −$366
- Net cashflow
- $593
Break-even live
UW: 25.0% down · 7.5% · 30yr · 1.5% tax · 5.0% vac · 8.0% maint · 8.0% mgmt
Financing live
Cash to close
- Down payment
- $29,975
- Closing costs
- $3,597
- Reserves months
- —
- Total cash needed
- —
Loan-product check · same deal, 3 products live
Conventional
25% down · 7.5% · 30yr
- Down + closing
- —
- Monthly P&I
- —
- Monthly cashflow
- —
- DSCR
- —
- Eligible?
- —
Personal DTI + credit; lowest rate.
DSCR
20% down · 8.5% · 30yr
- Down + closing
- —
- Monthly P&I
- —
- Monthly cashflow
- —
- DSCR
- —
- Eligible?
- —
No personal income docs; deal must DSCR.
Hard money
10% down · 12.0% · 12mo
- Down + closing
- —
- Monthly P&I
- —
- Monthly cashflow
- —
- DSCR
- —
- Eligible?
- —
Short-term bridge; refi at stabilization.
Rent comps 2 comps
| Address | Beds | Baths | Sqft | Rent | $/sqft | DOM | Units | Dist |
|---|---|---|---|---|---|---|---|---|
| 180 Pemberton Dr Pearl, MS | 3.0 | 2.0 | 1367 | $1,700 | $1.24 | 43d | 1 | 0.15mi |
| 3569 Old Brandon Rd Pearl, MS | 2.0 | 1.0 | 800 | $1,135 | $1.42 | 43d | 1 | 0.96mi |
Listing history 18 events
-
2026-06-18days on market $119,900 Active 133 DOM
-
2026-06-17days on market $119,900 Active 132 DOM
-
2026-06-16days on market $119,900 Active 131 DOM
-
2026-06-15days on market $119,900 Active 130 DOM
-
2026-06-14days on market $119,900 Active 128 DOM
-
2026-06-10days on market $119,900 Active 125 DOM
-
2026-06-09days on market $119,900 Active 124 DOM
-
2026-06-08days on market $119,900 Active 123 DOM
-
2026-06-07days on market $119,900 Active 122 DOM
-
2026-06-03days on market $119,900 Active 118 DOM
-
2026-06-02days on market $119,900 Active 117 DOM
-
2026-06-01days on market $119,900 Active 116 DOM
-
2026-05-31days on market $119,900 Active 115 DOM
-
2026-05-30days on market $119,900 Active 114 DOM
-
2026-05-08price $119,900 524-char remark
Show marketing remark (524 chars)
Welcome home to this freshly updated, move-in ready home featuring newer flooring throughout, fresh neutral paint, an updated kitchen with white cabinets and subway tile backsplash, refreshed bathroom with new tub/shower surround, and a functional layout with a dining area that flows into the main living space, plus a covered carport and a large fully fenced backyard with storage shed attached to carport—perfect for pets, play, or entertaining—so call your favorite agent today to schedule your private tour.
-
2026-02-05$129,900 Active 524-char remark
Show marketing remark (524 chars)
Welcome home to this freshly updated, move-in ready home featuring newer flooring throughout, fresh neutral paint, an updated kitchen with white cabinets and subway tile backsplash, refreshed bathroom with new tub/shower surround, and a functional layout with a dining area that flows into the main living space, plus a covered carport and a large fully fenced backyard with storage shed attached to carport—perfect for pets, play, or entertaining—so call your favorite agent today to schedule your private tour.
-
2005-10-31soldstatus 192-char remark
Show marketing remark (192 chars)
Great Price! This home would be a wonderful starter home or investment property. Three bedroom, one bath with security system and fence. Close to shopping and schools. Call list agent to show.
-
2005-06-08$63,300 192-char remark
Show marketing remark (192 chars)
Great Price! This home would be a wonderful starter home or investment property. Three bedroom, one bath with security system and fence. Close to shopping and schools. Call list agent to show.
ⓘ Source: listings_history table (triggers on properties + properties_extension) + one-shot
backfill from property_details.listing_events for pre-trigger history.
Tax reassessment forecast MS · Resets to sale price
- Current annual tax
- $1,254 · $105/mo
- Projected year-2 tax
- $1,254 · $105/mo
- Expected delta
- $0/yr ($0/mo · 0.0%)
ⓘ Screening estimate from a state-policy table — verify with the county assessor before closing.
Climate risk First Street
- Flood 1/10 Low FEMA zone X (unshaded) · 0% chance over 30 yrs
- Wildfire 2/10 Low
- Heat 7/10 Severe 7 d/yr ≥108°F today · 20 d/yr by 30 yrs out
- Wind 8/10 Severe 80% chance of damaging wind over 30 yrs
- Air quality 2/10 Low 0 unhealthy d/yr today · 1 by 30 yrs out
Nearby sold comps map
Loading sold comps map…
Walkable amenities ~0.75 mi
Loading nearby amenities…
Taxation est. · year 1
- Rental income
- $20,901
- − Mortgage interest
- −$6,716
- − Property taxes
- −$1,254
- − Insurance
- −$600
- − Repairs & maintenance
- −$1,672
- − Management
- −$1,672
- − Depreciation
- −$3,488
- Taxable income
- $5,499
- Est. tax owed @ 24.0%
- −$1,320
- After-tax cash flow
- $5,793/yr
For passive investors: Depreciation is non-cash, so a rental often shows a tax loss while cash-flowing — sheltering income. Rental losses are passive: they offset passive income freely, and up to $25,000/yr can offset ordinary (W-2) income if you actively participate and your MAGI is under $100k (phasing out to $0 by $150k); unused losses carry forward. On sale, claimed depreciation is recaptured at up to 25%, and gains may owe capital-gains tax (a 1031 exchange can defer both). Figures are a year-1 estimate at your 24.0% rate — not tax advice; consult a CPA.
Schools (NCES district)
- District
- Pearl Public School District
- NCES district ID
- 2803520
- Math proficiency
- 44% ▼ -9.00%
- Reading proficiency
- 42% ▼ -9.00%
- Median HH income
- $42,525
- Composite
- 36.29/100
- National rank
- #4699
- State rank
- #32 of 130 in MS
Livability — Pearl
- Score
- 73/100
- State rank
- #19
- US rank
- #5662
Category grades
Schools grade is shown separately in the Schools card above.
Census & demographics
- Census place
- Pearl, MS
- County
- Rankin County · 123,614 people
- City population
- 34,442
- Metro
- Jackson, MS
- Population (ZIP)
- 34,442
- Household income
- $65,480
- Rent vs Own
- Severe rent burden
- 1235.0
Population outlook (Rankin County) Hauer SSP2
- Today (2025)
- 164,317 people
- By 2030
- 171,013 · +4.1%
- By 2040
- 182,723 · +11.2%
- By 2050
- 192,376 · +17.1%
- By 2075
- 209,535 · +27.5%
- By 2100
- 209,534 · +27.5%
Race, ethnicity, and origin ACS 2023
- Neighborhood character
- Majority White (60%)
- Race & ethnicity
- White 60% Black 31% Hispanic / Latino 5% Two or more races 3% Asian 2%
- Common ancestry
- Italian 5% Slovak 1% Serbian 1%
- Foreign-born
- 3% · Canada, China
- Languages at home
- 93% English-only · Spanish 4% Other Indo-European 1% Other Asian/Pacific 1%
Political lean MEDSL · Rankin
- 2024 margin
- Solid R (+47.1) · D 25.9% · R 73.0% · Other 1.0%
- 2008→2024 swing
- +6.4pp toward D · 2008: -53.5pp · 2024: -47.1pp
- All cycles
- 2024: R+47.1 2020: R+45.4 2016: R+52.9 2012: R+51.9 2008: R+53.5
Not yet ingested
- Civics
- —
Market trends
- HPI YoY
- ▼ -49.11%
- Current HPI
- 193.0609
- Rent YoY
- ▲ 6.34%
- Metro
- Jackson, MS
- State GDP YoY
- —
- F500 in state
- 0
Price history
+89.4% since first listed4 events — show timeline
- 2026-05-08 Price Changed $119,900 MLSU
- 2026-02-05 Listed $129,900 MLSU
- 2005-10-31 Sold (MLS) — MLSU
- 2005-06-08 Listed $63,300 MLSU
Property tax history
+3.5%/yrLatest (2025): $1,254 · +0.0% YoY. Source: county tax records.
Cash-flow waterfall
monthlySold comps — $/sqft
last 12 mo · ≤1 miLoading sold comps…