611 Woods Dr NW · Atlanta, GA
Flood risk 1/10 · Minimal
- FEMA flood zone
- X (unshaded)
- Chance of flooding over 30 yrs
- 0.0%
- Est. flood insurance / yr
- $473 – $860
Fire risk 2/10 · Minimal
- Est. fire insurance / yr
- $963 – $1,789
Heat risk 5/10 · Moderate
- Hot days now (above 103°F)
- 7 days/yr
- Hot days in 30 yrs
- 17 days/yr
Wind risk 6/10 · Moderate
- Chance of severe wind over 30 yrs
- 27.0%
Air-quality risk 4/10 · Minor
- Unhealthy air days now
- 3 days/yr
- Unhealthy air days in 30 yrs
- 5 days/yr
Risk factors via First Street. Map © Google.
Why this score? — see what drove the B grade
The composite is a weighted blend of 9 inputs, each scored 0–100. Each bar is that input's sub-score; the figure is the points it added to the 100-point composite (weight × sub-score).
- Cash flow +27.4/30.0
- ARV discount +15.0/15.0
- DSCR +9.6/10.0
- 1% rule +8.5/10.0
- Livability +4.2/5.0
- Rent growth +3.3/5.0
- Schools +2.7/10.0
- Condition / age +2.5/5.0
- Appreciation +0.0/10.0
$150,000
🖨 Deal sheet 📄 Offer letter ✓ Due diligence
Listing remarks MLS
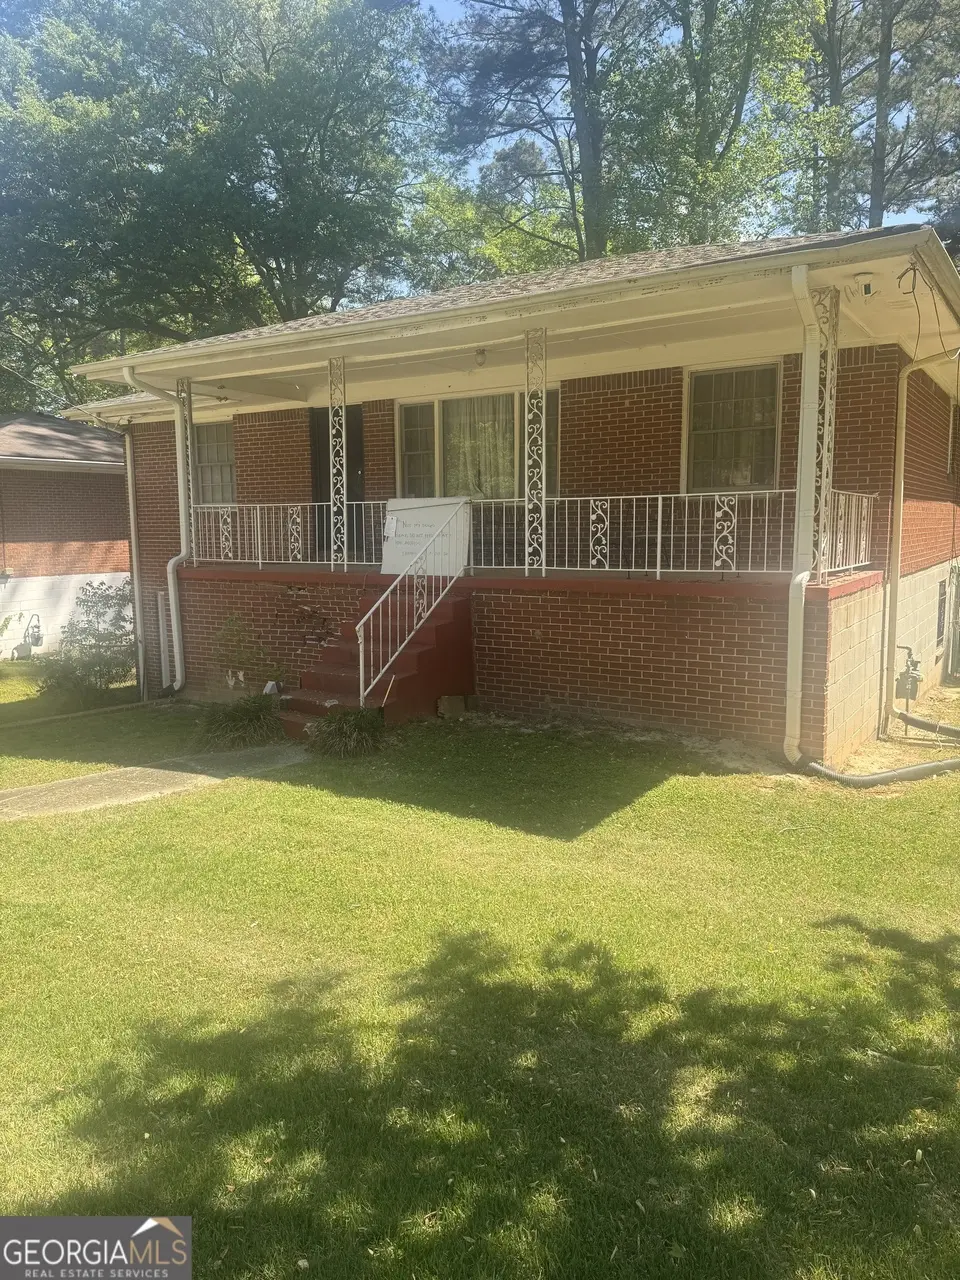
This house is sold AS IS and with a little TLC it can be restored to its original glory. Nice front porch to relax in the evening or have your morning coffee. Nice backyard for family outings. Rare find brick all the way around. Basement can be finished off for additional rooms. There are a lot of grants available for the city of Atlanta. Please check with your lender.
Key facts
- Front porch
- Backyard
- 0.28 acre lot
Tags
Neighborhood map
What this means for you Summary
Snapshot
- This is a 3-bed/1.0-bath single-family listed at $150k.
Deal economics
- At list price, monthly cash flow is $438 ($5k/yr) — positive.
- The deal already cash-flows at list — no discount required.
- Meets the 1% rule at list price ($2k rent vs $150k).
- Recommended offer: $146k (3.0% below list) — sets the bar for market timing.
- Cap rate 9.8% vs local median 3.1% in Atlanta — top-decile yield for the area; either an underpriced asset or a hidden risk that comps aren't pricing in. Stress-test before assuming the spread holds.
Location & tenants
- Location reads 83/100 on livability (#6 in GA, #919 nationally) — a professional / high-income tenant draw. Strengths: amenities A+, commute A+, housing A+; Watch: schools C-, cost of living C-.
- Atlanta Public Schools (urban): math 28% / reading 35% proficiency, ranked #80 of 174 in GA (top 46%) — families likely to look elsewhere, expect single-tenant / working-renter base with shorter leases; 71% free/reduced lunch — lower-income household profile, screen leases tightly.
- Market conditions: Rents rising (+3.3%/yr); 722 active listings in the ZIP; 40 comparable units currently listed for rent nearby; rentals at typical pace (median 24d on market — plan ~3-4 weeks tenant-placement turnaround); solid renter incomes; 11,565 units permitted in Fulton County in 2024 (8,159 in 5+ unit buildings).
Forward outlook
- Local home prices are declining (-3.0%/yr); year-one equity from $1k of loan paydown is wiped out by about $4k of value loss. Plan a longer hold.
- Fulton County population projected at +38% by 2050 — long-run rental-demand tailwind backs the buy-and-hold thesis.
- At projected returns (-3.0% appreciation + 3.3% rent growth), your $42k cash investment doubles in ~9 years — after that, you're playing with house money.
Negotiation context
- It's been on market 45 days — a 3% lower offer ($146k) is reasonable based on typical stale-listing flexibility.
Risks & watch-outs
- Watch-outs: property tax is 2.5% of price.
- Climate carrying-cost: major wind risk, 27% chance of damaging wind over 30y; extreme-heat days projected 7→17/yr by 2055 (HVAC capex compounding) — expect insurance premiums to compound above CPI over the hold.
Questions for the listing agent
- It's been on market 45 days. Have you received any prior offers? Is the seller open to a 3% concession, seller financing, or rate buy-down credit?
- Built in 1966 — when were the roof, HVAC, electrical panel, plumbing, and water heater last replaced?
- Property tax is high relative to price — has the assessment been appealed recently, and will the sale trigger a re-assessment?
- Is there a deadline driving the sale (1031 exchange, divorce, estate, relocation)? That informs how much negotiation room exists.
- What's the average days-on-market for RENTAL listings here right now (not sales)? A rising rental-DOM trend means longer vacancies and softer asking-rent achievability than the comps imply.
- What's the recent tenant-quality profile in this submarket — average credit score on applications, eviction rate, late-payment / NSF rate, and stable-employment percentage? A property-management company in the area should have these aggregated.
- How much new for-sale + rental construction is in the pipeline within 1–3 miles? Heavy new supply typically softens prices + rents 12–24 months out; constrained supply supports both.
Investment metrics
- 1% rule
- 1.35% ✓
- Cap rate
- 9.79%
- Cash-on-cash
- 12.51%
- DSCR
- 1.56
- GRM
- 6.2
CMA / ARV
- ARV (median comp)
- $296,643
- List price
- $150,000
- Delta
- -49.43%
- Verdict
- UNDERPRICED
- Comps
- 20 within 1.0 mi
Show comp detail 12 sales within ~0.75 mi
| Address | Dist | Beds/Ba | Sqft | Sold | Price | $/sf | Match |
|---|---|---|---|---|---|---|---|
| 563 Center Hill Ave NW | 0.23mi | 4/2.0 (+1) | 1,015 (+0%) | 4mo | $195,000 | $192 | 77 |
| 477 Center Hill Ave NW | 0.34mi | 3/1.5 | 1,040 (+3%) | 3mo | $159,600 | $153 | 75 |
| 648 Ozburn Rd NW | 0.49mi | 3/1.0 | 1,040 (+3%) | 10mo | $192,000 | $185 | 65 |
| 546 Hamilton E Holmes Dr NW | 0.33mi | 2/1.0 (-1) | 1,084 (+7%) | 6mo | $110,000 | $101 | 63 |
| 479 Aberdeen Dr NW | 0.58mi | 3/1.0 | 964 (-5%) | 3mo | $147,000 | $152 | 62 |
| 858 Commodore Dr NW | 0.56mi | 3/1.0 | 989 (-2%) | 9mo | $195,000 | $197 | 62 |
| 540 Hamilton E Holmes Dr NW | 0.32mi | 3/1.0 | 1,140 (+12%) | 3mo | $125,000 | $110 | 62 |
| 2294 Hill St NW | 0.61mi | 3/2.0 | 1,040 (+3%) | 2mo | $307,500 | $296 | 61 |
| 2105 Baker Rd NW | 0.65mi | 3/2.0 | 974 (-4%) | 2mo | $93,000 | $95 | 58 |
| 534 Hamilton E Holmes Dr | 0.32mi | 4/2.0 (+1) | 1,100 (+8%) | 5mo | $198,750 | $181 | 57 |
| 2600 NW Baker Rd | 0.40mi | 3/2.0 | 1,135 (+12%) | 4mo | $122,600 | $108 | 54 |
| 2720 Santa Barbara Dr NW | 0.58mi | 3/1.0 | 912 (-10%) | 9mo | $149,000 | $163 | 49 |
Match score weights: distance 35% · size 25% · config 20% · recency 20%. Top-matched comps best support the ARV.
Projected returns pro-forma
-3.0% appreciation · 3.26% rent growth · sell at horizon
- IRR
- 2.6%
- Equity multiple
- 1.10×
- Total profit
- $4,212
- Equity at exit
- $22,365
- IRR
- 12.5%
- Equity multiple
- 2.00×
- Total profit
- $42,209
- Equity at exit
- $12,969
Cash invested: $42,000 (down + closing). Projections, not guarantees.
Landlord ↔ Tenant lean methodology
- Overall (STATE)
- 90 Strongly Landlord-Friendly
- State Georgia
- 90 Strongly Landlord-Friendly · R+3
- County
- — inherits STATE
- City
- — inherits STATE
ZIP-level market 30318
- Rents YoY
- 3.3%
- Active inventory
- 722
- Price-to-rent
- 6.2×
Monthly cashflow live
- Estimated rent
- $2,031 high interval (Pro) →
- Mortgage (P&I)
- −$787
- Tax from tax record
- −$317 /mo · $3,809/yr
- Insurance
- −$62
- HOA
- −$0
- Vacancy / Maint / Mgmt
- −$426
- Net cashflow
- $438
Break-even live
UW: 25.0% down · 7.5% · 30yr · 1.5% tax · 5.0% vac · 8.0% maint · 8.0% mgmt
Financing live
Cash to close
- Down payment
- $37,500
- Closing costs
- $4,500
- Reserves months
- —
- Total cash needed
- —
Loan-product check · same deal, 3 products live
Conventional
25% down · 7.5% · 30yr
- Down + closing
- —
- Monthly P&I
- —
- Monthly cashflow
- —
- DSCR
- —
- Eligible?
- —
Personal DTI + credit; lowest rate.
DSCR
20% down · 8.5% · 30yr
- Down + closing
- —
- Monthly P&I
- —
- Monthly cashflow
- —
- DSCR
- —
- Eligible?
- —
No personal income docs; deal must DSCR.
Hard money
10% down · 12.0% · 12mo
- Down + closing
- —
- Monthly P&I
- —
- Monthly cashflow
- —
- DSCR
- —
- Eligible?
- —
Short-term bridge; refi at stabilization.
Rent comps 40 comps
| Address | Beds | Baths | Sqft | Rent | $/sqft | DOM | Units | Dist |
|---|---|---|---|---|---|---|---|---|
| 556 Church St NW Atlanta, GA | 2.0 | 2.0 | 1432 | $2,200 | $1.54 | 7d | 1 | 0.13mi |
| 717 Church St NW Atlanta, GA | 4.0 | 2.0 | 1328 | $2,000 | $1.51 | 24d | 1 | 0.19mi |
| 2364 Cross St NW Atlanta, GA | 3.0 | 1.0 | 1168 | $1,500 | $1.28 | 16d | 1 | 0.22mi |
| 2662 Hood Ave NW Atlanta, GA | 3.0 | 2.0 | 1450 | $2,000 | $1.38 | 24d | 1 | 0.23mi |
| 646 Robert St NW Atlanta, GA | 3.0 | 2.0 | 1374 | $2,400 | $1.75 | 18d | 1 | 0.27mi |
| 624 Robert St NW Atlanta, GA | 3.0 | 2.0 | 1221 | $3,000 | $2.46 | 24d | 1 | 0.27mi |
| 2705 Lincoln Ct NW Atlanta, GA | 3.0 | 2.0 | 1134 | $2,050 | $1.81 | 17d | 1 | 0.28mi |
| 838 Ridge Ave NW Atlanta, GA | 3.0 | 2.5 | 1452 | $1,953 | $1.35 | 24d | 1 | 0.37mi |
| 488 Park Valley Dr NW Atlanta, GA | 3.0 | 1.0 | 840 | $2,500 | $2.98 | 24d | 1 | 0.39mi |
| 848 Ridge Ave NW Unit A Atlanta, GA | 3.0 | 2.5 | 1410 | $1,875 | $1.33 | 24d | 1 | 0.42mi |
| 874 Center Hill Ave NW Atlanta, GA | 3.0 | 2.0 | 1176 | $1,695 | $1.44 | 24d | 1 | 0.54mi |
| 2740 Oldknow Dr NW Unit A Atlanta, GA | 2.0 | 2.0 | 1100 | $2,050 | $1.86 | 24d | 1 | 0.54mi |
| 854 N Grand Ave NW Atlanta, GA | 4.0 | 2.5 | 1436 | $1,824 | $1.27 | 24d | 1 | 0.54mi |
| 2762 Oldknow Dr NW Atlanta, GA | 2.0 | 1.0 | 880 | $1,600 | $1.82 | 24d | 1 | 0.59mi |
| 2355 Hill St NW Atlanta, GA | 3.0 | 3.0 | 1320 | $1,700 | $1.29 | 24d | 1 | 0.59mi |
| 2732 Baker Ridge Dr NW Atlanta, GA | 3.0 | 1.5 | 1322 | $1,750 | $1.32 | 24d | 1 | 0.60mi |
| 929 N Grand Ave NW Atlanta, GA | 3.0 | 2.0 | 1100 | $2,500 | $2.27 | 24d | 1 | 0.67mi |
| 991 Ada Ave NW Atlanta, GA | 4.0 | 2.0 | 1458 | $2,450 | $1.68 | 24d | 1 | 0.69mi |
| 2595 Elliott St NW Atlanta, GA | 4.0 | 2.0 | 1101 | $1,900 | $1.73 | 10d | 1 | 0.75mi |
| 2060 Baker Rd NW Atlanta, GA | 2.0 | 2.0 | 1436 | $2,100 | $1.46 | 3d | 1 | 0.75mi |
| 1006 Hightower Rd NW Atlanta, GA | 3.0 | 2.0 | 1320 | $2,065 | $1.56 | 13d | 1 | 0.81mi |
| 2059 Detroit Ave NW Atlanta, GA | 2.0 | 1.0 | 750 | $1,340 | $1.79 | 22d | 1 | 0.82mi |
| 24 S Eugenia Pl NW Atlanta, GA | 4.0 | 2.5 | 1410 | $1,725 | $1.22 | 24d | 1 | 0.83mi |
| 2199 Tiger Flowers Dr NW Atlanta, GA | 3.0 | 1.0 | 936 | $1,325 | $1.42 | 24d | 1 | 0.89mi |
| 714 Emily Pl NW Atlanta, GA | 3.0 | 2.0 | 1492 | $2,700 | $1.81 | 2d | 1 | 0.91mi |
| 1958 Maywood Pl NW Atlanta, GA | 2.0 | 1.0 | 829 | $1,425 | $1.72 | 5d | 1 | 0.91mi |
| 2590 Godfrey Dr NW Atlanta, GA | 3.0 | 2.0 | 1308 | $1,995 | $1.53 | 16d | 1 | 0.92mi |
| 156 Fairfield Pl NW Unit B-9 Atlanta, GA | 2.0 | 1.0 | 750 | $1,199 | $1.60 | 24d | 1 | 0.97mi |
| 38 Hollywood Dr NW Atlanta, GA | 4.0 | 2.0 | 1400 | $2,200 | $1.57 | 24d | 1 | 0.97mi |
| 511 Emily Pl NW Atlanta, GA | 3.0 | 1.0 | 1101 | $1,745 | $1.58 | 24d | 1 | 0.99mi |
| 273 Wadley St NW Atlanta, GA | 3.0 | 2.0 | 1406 | $1,990 | $1.42 | 24d | 1 | 1.04mi |
| 1948 Detroit Ave NW Unit A Atlanta, GA | 3.0 | 2.5 | 1205 | $1,900 | $1.58 | 24d | 1 | 1.05mi |
| 1894 North Ave NW Atlanta, GA | 2.0 | 1.5 | 1098 | $1,995 | $1.82 | 24d | 1 | 1.10mi |
| 308 Anderson Ave NW Unit A Atlanta, GA | 4.0 | 3.0 | 1250 | $2,200 | $1.76 | 24d | 1 | 1.11mi |
| 2284 Alvin Dr NW Unit B 1 Atlanta, GA | 3.0 | 1.0 | 875 | $1,025 | $1.17 | 2d | 1 | 1.12mi |
| 2284 Alvin Dr NW Unit D Atlanta, GA | 2.0 | 1.0 | 868 | $995 | $1.15 | 2d | 1 | 1.12mi |
| 1026 Sims Ave NW Unit B Atlanta, GA | 4.0 | 3.0 | 1492 | $2,842 | $1.90 | 24d | 1 | 1.14mi |
| 1110 Cato St NW Atlanta, GA | 3.0 | 1.0 | 1050 | $1,400 | $1.33 | 24d | 1 | 1.15mi |
| 340 Dixie Hills Cir NW Unit C1 Atlanta, GA | 2.0 | 1.0 | 775 | $1,099 | $1.42 | 24d | 1 | 1.18mi |
| 1916 Joseph E. Boone Blvd NW Unit A Atlanta, GA | 3.0 | 1.0 | 1100 | $1,550 | $1.41 | 20d | 1 | 1.18mi |
Listing history 7 events
-
2026-06-07statusdays on market $150,000 Under Contract 45 DOM
-
2026-06-04days on market $150,000 Active 43 DOM
-
2026-06-03days on market $150,000 Active 42 DOM
-
2026-06-02days on market $150,000 Active 41 DOM
-
2026-06-01days on market $150,000 Active 40 DOM
-
2026-05-31days on market $150,000 Active 39 DOM
-
2026-04-22$150,000 New 373-char remark
Show marketing remark (373 chars)
This house is sold AS IS and with a little TLC it can be restored to its original glory. Nice front porch to relax in the evening or have your morning coffee. Nice backyard for family outings. Rare find brick all the way around. Basement can be finished off for additional rooms. There are a lot of grants available for the city of Atlanta. Please check with your lender.
ⓘ Source: listings_history table (triggers on properties + properties_extension) + one-shot
backfill from property_details.listing_events for pre-trigger history.
Tax reassessment forecast GA · Resets to sale price
- Current annual tax
- $3,809 · $317/mo
- Projected year-2 tax
- $3,809 · $317/mo
- Expected delta
- $0/yr ($0/mo · 0.0%)
ⓘ Screening estimate from a state-policy table — verify with the county assessor before closing.
Climate risk First Street
- Flood 1/10 Low FEMA zone X (unshaded) · 0% chance over 30 yrs
- Wildfire 2/10 Low
- Heat 5/10 Major 7 d/yr ≥103°F today · 17 d/yr by 30 yrs out
- Wind 6/10 Major 27% chance of damaging wind over 30 yrs
- Air quality 4/10 Moderate 3 unhealthy d/yr today · 5 by 30 yrs out
Nearby sold comps map
Loading sold comps map…
Walkable amenities ~0.75 mi
Loading nearby amenities…
Taxation est. · year 1
- Rental income
- $24,368
- − Mortgage interest
- −$8,402
- − Property taxes
- −$3,809
- − Insurance
- −$750
- − Repairs & maintenance
- −$1,949
- − Management
- −$1,949
- − Depreciation
- −$4,364
- Taxable income
- $3,144
- Est. tax owed @ 24.0%
- −$755
- After-tax cash flow
- $4,498/yr
For passive investors: Depreciation is non-cash, so a rental often shows a tax loss while cash-flowing — sheltering income. Rental losses are passive: they offset passive income freely, and up to $25,000/yr can offset ordinary (W-2) income if you actively participate and your MAGI is under $100k (phasing out to $0 by $150k); unused losses carry forward. On sale, claimed depreciation is recaptured at up to 25%, and gains may owe capital-gains tax (a 1031 exchange can defer both). Figures are a year-1 estimate at your 24.0% rate — not tax advice; consult a CPA.
Schools (NCES district)
- District
- Atlanta Public Schools
- NCES district ID
- 1300120
- Math proficiency
- 28% ▼ -6.00%
- Reading proficiency
- 35% ▼ -2.00%
- Median HH income
- $48,306
- Composite
- 27.27/100
- National rank
- #7006
- State rank
- #80 of 174 in GA
Livability — Atlanta
- Score
- 83/100
- State rank
- #6
- US rank
- #919
Category grades
Schools grade is shown separately in the Schools card above.
Census & demographics
- Census place
- Atlanta, GA
- County
- Fulton County · 1,094,430 people
- City population
- 629,525
- Metro
- Atlanta-Sandy Springs-Alpharetta, GA
- Population (ZIP)
- 59,609
- Household income
- $83,116
- Rent vs Own
- Severe rent burden
- 4182.0
Population outlook (Fulton County) Hauer SSP2
- Today (2025)
- 1,203,707 people
- By 2030
- 1,299,706 · +8.0%
- By 2040
- 1,488,256 · +23.6%
- By 2050
- 1,664,580 · +38.3%
- By 2075
- 2,036,072 · +69.2%
- By 2100
- 2,222,402 · +84.6%
Race, ethnicity, and origin ACS 2023
- Neighborhood character
- Diverse neighborhood (Simpson 0.63)
- Race & ethnicity
- Black 49% White 35% Hispanic / Latino 7% Two or more races 6% Asian 5%
- Hispanic origin (detail)
- Mexican 2% Puerto Rican 1%
- Common ancestry
- Lithuanian 2% Slovak 2% Romanian 1%
- Foreign-born
- 8% · Canada, China, South Korea
- Languages at home
- 88% English-only · Spanish 4% Other Indo-European 2% Other Asian/Pacific 1%
Political lean MEDSL · Fulton
- 2024 margin
- Solid D (+44.9) · D 71.9% · R 27.0% · Other 1.1%
- 2008→2024 swing
- +9.8pp toward D · 2008: 35.0pp · 2024: 44.9pp
- All cycles
- 2024: D+44.9 2020: D+46.4 2016: D+42.1 2012: D+29.6 2008: D+35.0
Not yet ingested
- Civics
- —
Market trends
- HPI YoY
- ▼ -470.82%
- Current HPI
- 224.1493
- Rent YoY
- ▲ 3.26%
- Metro
- Atlanta-Sandy Springs-Alpharetta, GA
- State GDP YoY
- ▲ 2.66%
- F500 in state
- 28
Industry mix (Fortune 500 HQ in GA)
| Industry | F500 HQs | Revenue |
|---|---|---|
| Paper / Packaging | 2 | $29B |
|
||
| Retail | 1 | $160B |
|
||
| Transportation / Logistics | 1 | $91B |
|
||
| Airlines | 1 | $62B |
|
||
| Consumer Goods | 1 | $47B |
|
||
| Utilities | 1 | $25B |
|
||
Price history
1 event — show timeline
- 2026-04-22 Listed $150,000 GAMLS
Property tax history
+23.1%/yrLatest (2025): $3,809 · +0.6% YoY. Source: county tax records.
Cash-flow waterfall
monthlySold comps — $/sqft
last 12 mo · ≤1 miLoading sold comps…