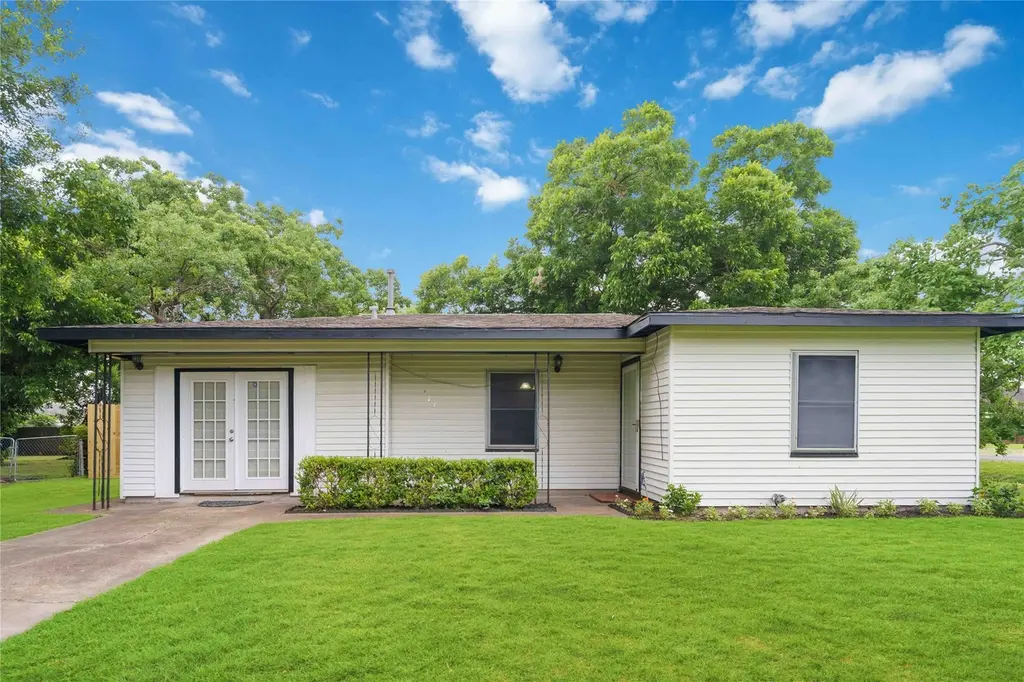
271 Muriel St · La Marque, TX
Flood risk 8/10 · Major
- FEMA flood zone
- X
- Chance of flooding over 30 yrs
- 0.6%
- Est. flood insurance / yr
- $507 – $1,088
Fire risk 2/10 · Minimal
- Est. fire insurance / yr
- $1,222 – $2,270
Heat risk 10/10 · Severe
- Hot days now (above 109°F)
- 7 days/yr
- Hot days in 30 yrs
- 27 days/yr
Wind risk 10/10 · Severe
- Chance of severe wind over 30 yrs
- 99.0%
Air-quality risk 3/10 · Minor
- Unhealthy air days now
- 2 days/yr
- Unhealthy air days in 30 yrs
- 2 days/yr
Risk factors via First Street. Map © Google.
Why this score? — see what drove the D grade
The composite is a weighted blend of 9 inputs, each scored 0–100. Each bar is that input's sub-score; the figure is the points it added to the 100-point composite (weight × sub-score).
- Cash flow +19.5/30.0
- DSCR +6.2/10.0
- 1% rule +6.0/10.0
- Rent growth +3.5/5.0
- Livability +3.0/5.0
- Condition / age +2.5/5.0
- Schools +2.4/10.0
- ARV discount +0.0/15.0
- Appreciation +0.0/10.0
$175,000
🖨 Deal sheet (PDF) 📄 Offer letter ✓ Due diligence
Listing remarks MLS
Investor’s Dream! This charming 3-bedroom, 1.5-bathroom home sits on an oversized corner lot, offering endless potential for expansion or redevelopment. The property features a spacious layout with a bonus room perfect for a home office, game room, or potential 4th bedroom. Inside, you’ll find a light-filled living area, a functional kitchen with ample cabinet space, and generously sized bedrooms. The full bathroom includes a shower/tub combo, while the convenient half-bath adds extra comfort for guests. The large yard offers plenty of room for additions, a pool, or outdoor entertainment, making this property an ideal opportunity for investors, flippers, or buyers looking to build equity. Don’t miss this one—it’s a rare find with solid bones and major upside potential!
Key facts
- Oversized corner lot
- Functional kitchen
- Bonus room
Tags
Neighborhood map
What this means for you Summary
Snapshot
- This is a 3-bed/1.5-bath single-family listed at $175k.
Deal economics
- At list price, monthly cash flow is $132 ($2k/yr) — positive.
- The deal already cash-flows at list — no discount required.
- Meets the 1% rule at list price ($2k rent vs $175k).
- Recommended offer: $154k (12.0% below list) — sets the bar for market timing.
- Cap rate 7.7% vs local median 5.6% in La Marque — top-decile yield for the area; either an underpriced asset or a hidden risk that comps aren't pricing in. Stress-test before assuming the spread holds.
Location & tenants
- Location reads 59/100 on livability (#1,136 in TX) — a working-class tenant base; expect higher turnover. Strengths: cost of living A+, housing A+; Watch: employment D, schools F, crime F.
- Texas City ISD (suburban): math 28% / reading 29% proficiency, ranked #655 of 826 in TX (top 79%) — low school quality limits family demand, transient renter base, plan for 1-2y turnover; 66% free/reduced lunch — lower-income household profile, screen leases tightly.
- Market conditions: Rents rising (+4.0%/yr); 661 active listings in the ZIP; 8 comparable units currently listed for rent nearby; rentals at typical pace (median 26d on market — plan ~3-4 weeks tenant-placement turnaround); 3,258 units permitted in Galveston County in 2024 (0 in 5+ unit buildings).
- This rent runs 31% of the median local income ($75k/yr) — at the standard rent-burdened threshold; future hikes will face affordability resistance.
Forward outlook
- Local home prices are declining (-3.0%/yr); year-one equity from $1k of loan paydown is wiped out by about $5k of value loss. Plan a longer hold.
- Galveston County population projected at +43% by 2050 — long-run rental-demand tailwind backs the buy-and-hold thesis.
Negotiation context
- It's been on market 335 days — a 12% lower offer ($154k) is reasonable based on typical stale-listing flexibility.
- 2 sale attempts with the ask held roughly flat each time — persistent listings suggest the price (not the market) is what's stuck; bring a comps-based counter.
Risks & watch-outs
- Watch-outs: flood insurance adds $66/mo.
- Climate carrying-cost: severe flood risk; severe wind risk, 99% chance of damaging wind over 30y; extreme-heat days projected 7→27/yr by 2055 (HVAC capex compounding) — expect insurance premiums to compound above CPI over the hold.
Questions for the listing agent
- It's been on market 335 days. Have you received any prior offers? Is the seller open to a 12% concession, seller financing, or rate buy-down credit?
- Built in 1970 — when were the roof, HVAC, electrical panel, plumbing, and water heater last replaced?
- What's the actual annual flood-insurance premium (NFIP or private), and is the property in a SFHA with mandatory coverage?
- Why hasn't it sold? Are there any deal-killer items the seller is aware of (foundation, flood, title, zoning, code violations)?
- Is there a deadline driving the sale (1031 exchange, divorce, estate, relocation)? That informs how much negotiation room exists.
- Schools are F-rated, which usually means shorter tenancies and higher turnover. Who's the typical renter profile here, and what's been the actual vacancy rate?
- Crime grade is F in this area — have there been break-ins, vandalism, or insurance claims at this property in the last 3 years? What carrier currently insures it and at what premium?
- The area grade is low — what's the realistic commute time and amenity access for the typical tenant pool here? Any planned neighborhood developments (good or bad) we should know about?
- What's the average days-on-market for RENTAL listings here right now (not sales)? A rising rental-DOM trend means longer vacancies and softer asking-rent achievability than the comps imply.
- What's the recent tenant-quality profile in this submarket — average credit score on applications, eviction rate, late-payment / NSF rate, and stable-employment percentage? A property-management company in the area should have these aggregated.
- How much new for-sale + rental construction is in the pipeline within 1–3 miles? Heavy new supply typically softens prices + rents 12–24 months out; constrained supply supports both.
Investment metrics
- 1% rule
- 1.10% ✓
- Cap rate
- 7.66%
- Cash-on-cash
- 4.87%
- DSCR
- 1.22
- GRM
- 7.6
CMA / ARV
- ARV (median comp)
- $146,643
- List price
- $175,000
- Delta
- 19.34%
- Verdict
- OVERPRICED
- Comps
- 20 within 1.0 mi
Show comp detail 12 sales within ~0.75 mi
| Address | Dist | Beds/Ba | Sqft | Sold | Price | $/sf | Match |
|---|---|---|---|---|---|---|---|
| 810 Stubbs St | 0.38mi | 3/2.0 | 1,350 (+0%) | 5mo | $199,000 | $147 | 76 |
| 252 Muriel St | 0.06mi | 4/2.0 (+1) | 1,232 (-8%) | 3mo | $120,960 | $98 | 74 |
| 821 Cypress St | 0.39mi | 3/1.5 | 1,414 (+5%) | 4mo | $119,900 | $85 | 70 |
| 431 Grafton St | 0.28mi | 4/2.0 (+1) | 1,436 (+7%) | 2mo | $169,900 | $118 | 67 |
| 904 Stubbs St | 0.40mi | 3/2.0 | 1,416 (+5%) | 5mo | $114,900 | $81 | 66 |
| 1603 S Oak St | 0.39mi | 3/1.0 | 1,271 (-6%) | 7mo | $199,900 | $157 | 65 |
| 401 Honeysuckle Dr | 0.43mi | 4/1.0 (+1) | 1,274 (-5%) | 3mo | $85,000 | $67 | 62 |
| 316 Avenue B | 0.74mi | 4/2.0 (+1) | 1,354 (+1%) | 2mo | $170,000 | $126 | 56 |
| 1019 Spruce St | 0.36mi | 2/1.5 (-1) | 1,192 (-11%) | 6mo | $150,000 | $126 | 54 |
| 1729 Hawthorne St | 0.62mi | 2/1.5 (-1) | 1,236 (-8%) | 1mo | $165,000 | $133 | 52 |
| 1010 Ross St | 0.46mi | 3/2.5 | 1,520 (+13%) | 3mo | $269,000 | $177 | 50 |
| 612 Honeysuckle Dr | 0.57mi | 3/2.0 | 1,504 (+12%) | 4mo | $159,000 | $106 | 48 |
Match score weights: distance 35% · size 25% · config 20% · recency 20%. Top-matched comps best support the ARV.
Projected returns pro-forma
-3.0% appreciation · 3.95% rent growth · sell at horizon
- IRR
- -9.9%
- Equity multiple
- 0.63×
- Total profit
- $-17,922
- Equity at exit
- $26,093
- IRR
- 1.0%
- Equity multiple
- 1.07×
- Total profit
- $3,610
- Equity at exit
- $15,131
Cash invested: $49,000 (down + closing). Projections, not guarantees.
Landlord ↔ Tenant lean methodology
- Overall (STATE)
- 87 Strongly Landlord-Friendly
- State Texas
- 87 Strongly Landlord-Friendly · R+5
- County
- — inherits STATE
- City
- — inherits STATE
ZIP-level market 77568
- Home prices YoY
- -22.7%
- Rents YoY
- 4.0%
- Active inventory
- 661
- Price-to-rent
- 7.6×
Monthly cashflow live
- Estimated rent
- $1,928 high interval (Pro) →
- Mortgage (P&I)
- −$918
- Tax from tax record
- −$334 /mo · $4,006/yr
- Insurance
- −$73
- Flood insurance flood zone
- −$66 /mo · $798/yr
- HOA
- −$0
- Vacancy / Maint / Mgmt
- −$405
- Net cashflow
- $132
Break-even live
Sensitivity live
| Price | -10% $231 | -5% $182 | +0% $132 | +5% $83 | +10% $33 |
|---|---|---|---|---|---|
| Rent | -10% $-20 | -5% $56 | +0% $132 | +5% $209 | +10% $285 |
| Rate | -1.0pp $221 | -0.5pp $177 | base $132 | +0.5pp $87 | +1.0pp $41 |
UW: 25.0% down · 7.5% · 30yr · 1.5% tax · 5.0% vac · 8.0% maint · 8.0% mgmt
Financing live
Cash to close
- Down payment
- $43,750
- Closing costs
- $5,250
- Reserves months
- —
- Total cash needed
- —
Loan-product check · same deal, 3 products live
Conventional
25% down · 7.5% · 30yr
- Down + closing
- —
- Monthly P&I
- —
- Monthly cashflow
- —
- DSCR
- —
- Eligible?
- —
Personal DTI + credit; lowest rate.
DSCR
20% down · 8.5% · 30yr
- Down + closing
- —
- Monthly P&I
- —
- Monthly cashflow
- —
- DSCR
- —
- Eligible?
- —
No personal income docs; deal must DSCR.
Hard money
10% down · 12.0% · 12mo
- Down + closing
- —
- Monthly P&I
- —
- Monthly cashflow
- —
- DSCR
- —
- Eligible?
- —
Short-term bridge; refi at stabilization.
Rent comps 8 comps
| Address | Beds | Baths | Sqft | Rent | $/sqft | DOM | Units | Dist |
|---|---|---|---|---|---|---|---|---|
| 509 Bluebonnet Dr La Marque, TX | 4.0 | 1.0 | 1223 | $1,550 | $1.27 | 45d | 1 | 0.39mi |
| 105 Plum St La Marque, TX | 4.0 | 1.5 | 1329 | $2,100 | $1.58 | 5d | 1 | 0.77mi |
| 4417 Edward St Texas City, TX | 2.0 | 2.0 | 983 | $1,150 | $1.17 | 4d | 1 | 1.08mi |
| 4417 Edward St Texas City, TX | 2.0 | 2.0 | 983 | $1,100 | $1.12 | 5d | 1 | 1.08mi |
| 113 N Pecan Dr Texas City, TX | 4.0 | 2.0 | 1468 | $3,000 | $2.04 | 45d | 1 | 1.13mi |
| 203 Beatrice St La Marque, TX | 3.0 | 1.0 | 1304 | $1,395 | $1.07 | 26d | 1 | 1.17mi |
| 1825 Bayou Rd La Marque, TX | 2.0 | 1.0 | 1200 | $1,195 | $1.00 | 45d | 1 | 1.21mi |
| 1230 Kirsten St La Marque, TX | 3.0 | 2.0 | 1704 | $1,660 | $0.97 | 4d | 1 | 1.24mi |
Listing history 18 events
-
2026-06-21days on market $175,000 Active 335 DOM
-
2026-06-18days on market $175,000 Active 332 DOM
-
2026-06-17days on market $175,000 Active 331 DOM
-
2026-06-16days on market $175,000 Active 330 DOM
-
2026-06-15days on market $175,000 Active 329 DOM
-
2026-06-13days on market $175,000 Active 327 DOM
-
2026-06-09days on market $175,000 Active 323 DOM
-
2026-06-08days on market $175,000 Active 322 DOM
-
2026-06-07days on market $175,000 Active 321 DOM
-
2026-06-04days on market $175,000 Active 318 DOM
-
2026-06-03days on market $175,000 Active 317 DOM
-
2026-06-02days on market $175,000 Active 316 DOM
-
2026-06-01days on market $175,000 Active 315 DOM
-
2026-05-31days on market $175,000 Active 314 DOM
-
2025-07-21historical
Show marketing remark (809 chars)
Investor’s Dream! This charming 3-bedroom, 1.5-bathroom home sits on an oversized corner lot, offering endless potential for expansion or redevelopment. The property features a spacious layout with a bonus room perfect for a home office, game room, or potential 4th bedroom. Inside, you’ll find a light-filled living area, a functional kitchen with ample cabinet space, and generously sized bedrooms. The full bathroom includes a shower/tub combo, while the convenient half-bath adds extra comfort for guests. The large yard offers plenty of room for additions, a pool, or outdoor entertainment, making this property an ideal opportunity for investors, flippers, or buyers looking to build equity. Don’t miss this one—it’s a rare find with solid bones and major upside potential!
-
2025-07-21$175,000 Active 809-char remark
Show marketing remark (809 chars)
Investor’s Dream! This charming 3-bedroom, 1.5-bathroom home sits on an oversized corner lot, offering endless potential for expansion or redevelopment. The property features a spacious layout with a bonus room perfect for a home office, game room, or potential 4th bedroom. Inside, you’ll find a light-filled living area, a functional kitchen with ample cabinet space, and generously sized bedrooms. The full bathroom includes a shower/tub combo, while the convenient half-bath adds extra comfort for guests. The large yard offers plenty of room for additions, a pool, or outdoor entertainment, making this property an ideal opportunity for investors, flippers, or buyers looking to build equity. Don’t miss this one—it’s a rare find with solid bones and major upside potential!
-
2025-06-13$175,000 Active
-
2025-06-02historical
ⓘ Source: listings_history table (triggers on properties + properties_extension) + one-shot
backfill from property_details.listing_events for pre-trigger history.
Tax reassessment forecast TX · Resets to sale price
- Current annual tax
- $4,006 · $334/mo
- Projected year-2 tax
- $4,006 · $334/mo
- Expected delta
- $0/yr ($0/mo · 0.0%)
ⓘ Screening estimate from a state-policy table — verify with the county assessor before closing.
Climate risk First Street
- Flood 8/10 Severe FEMA zone X · 60% chance over 30 yrs
- Wildfire 2/10 Low
- Heat 10/10 Extreme 7 d/yr ≥109°F today · 27 d/yr by 30 yrs out
- Wind 10/10 Extreme 99% chance of damaging wind over 30 yrs
- Air quality 3/10 Moderate 2 unhealthy d/yr today · 2 by 30 yrs out
Nearby sold comps map
Loading sold comps map…
Walkable amenities ~0.75 mi
Loading nearby amenities…
Taxation est. · year 1
- Rental income
- $23,140
- − Mortgage interest
- −$9,803
- − Property taxes
- −$4,006
- − Insurance
- −$1,672
- − Repairs & maintenance
- −$1,851
- − Management
- −$1,851
- − Depreciation
- −$5,091
- Taxable loss
- −$1,135
- Est. tax savings @ 24.0%
- +$272
- After-tax cash flow
- $1,861/yr
For passive investors: Depreciation is non-cash, so a rental often shows a tax loss while cash-flowing — sheltering income. Rental losses are passive: they offset passive income freely, and up to $25,000/yr can offset ordinary (W-2) income if you actively participate and your MAGI is under $100k (phasing out to $0 by $150k); unused losses carry forward. On sale, claimed depreciation is recaptured at up to 25%, and gains may owe capital-gains tax (a 1031 exchange can defer both). Figures are a year-1 estimate at your 24.0% rate — not tax advice; consult a CPA.
Schools (NCES district)
- District
- Texas City ISD
- NCES district ID
- 4842510
- Math proficiency
- 28% ▼ -10.00%
- Reading proficiency
- 29% ▼ -4.00%
- Median HH income
- $44,875
- Composite
- 24.47/100
- National rank
- #7664
- State rank
- #655 of 826 in TX
Livability — La Marque
- Score
- 59/100
- State rank
- #1136
- US rank
- #20037
Category grades
Schools grade is shown separately in the Schools card above.
Census & demographics
- Census place
- La Marque, TX
- County
- Galveston County · 357,330 people
- City population
- 23,083
- Metro
- Houston-The Woodlands-Sugar Land, TX
- Population (ZIP)
- 23,083
- Household income
- $74,694
- Rent vs Own
- Severe rent burden
- 700.0
Population outlook (Galveston County) Hauer SSP2
- Today (2025)
- 390,640 people
- By 2030
- 425,226 · +8.9%
- By 2040
- 493,765 · +26.4%
- By 2050
- 559,698 · +43.3%
- By 2075
- 719,260 · +84.1%
- By 2100
- 819,628 · +109.8%
Race, ethnicity, and origin ACS 2023
- Neighborhood character
- Highly diverse neighborhood (Simpson 0.71)
- Race & ethnicity
- White 37% Hispanic / Latino 29% Black 26% Two or more races 17% Asian 3%
- Hispanic origin (detail)
- Mexican 22% Puerto Rican 1%
- Common ancestry
- Lithuanian 1% Italian 1% Serbian 1%
- Foreign-born
- 8% · Canada
- Languages at home
- 77% English-only · Spanish 21% Tagalog/Filipino 1% Other Asian/Pacific 1%
Political lean MEDSL · Galveston
- 2024 margin
- Strong R (+27.4) · D 35.7% · R 63.1% · Other 1.2%
- 2008→2024 swing
- -7.9pp toward R · 2008: -19.5pp · 2024: -27.4pp
- All cycles
- 2024: R+27.4 2020: R+22.6 2016: R+22.6 2012: R+26.9 2008: R+19.5
Not yet ingested
- Civics
- —
Market trends
- HPI YoY
- ▼ -69.39%
- Current HPI
- 236.0239
- Rent YoY
- ▲ 3.95%
- Metro
- Houston-The Woodlands-Sugar Land, TX
- State GDP YoY
- ▲ 3.95%
- F500 in state
- 110
Industry mix (Fortune 500 HQ in TX)
| Industry | F500 HQs | Revenue |
|---|---|---|
| Energy | 16 | $1,198B |
|
||
| Technology | 5 | $198B |
|
||
| Engineering / Construction | 4 | $72B |
|
||
| Energy Services | 3 | $60B |
|
||
| Utilities | 3 | $41B |
|
||
| Healthcare | 2 | $330B |
|
||
Price history
+0.0% since first listed4 events — show timeline
- 2025-07-21 Listed $175,000 HARMLS
- 2025-07-21 Listing Removed — HARMLS
- 2025-06-13 Listed $175,000 HARMLS
- 2025-06-02 Coming Soon — HARMLS
Property tax history
+15.5%/yrLatest (2025): $4,006 · +16.8% YoY. Source: county tax records.
Cash-flow waterfall
monthlySold comps — $/sqft
last 12 mo · ≤1 miLoading sold comps…