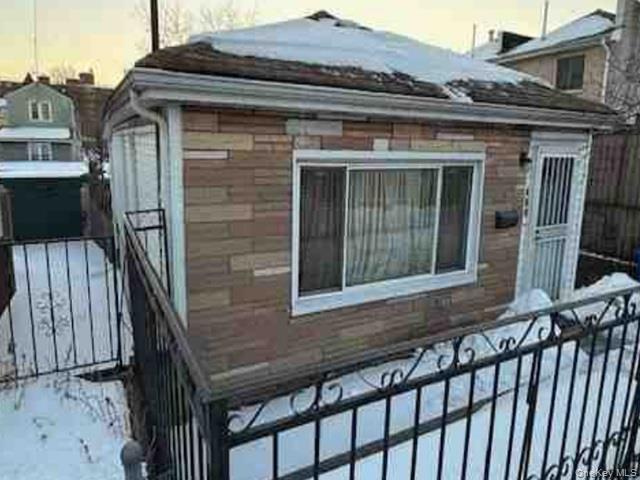
865 Euclid Ave · New York, NY
Flood risk 8/10 · Major
- FEMA flood zone
- X (unshaded)
- Chance of flooding over 30 yrs
- 0.78%
- Est. flood insurance / yr
- $507 – $1,088
Fire risk 1/10 · Minimal
- Est. fire insurance / yr
- $691 – $1,283
Heat risk 7/10 · Major
- Hot days now (above 99°F)
- 7 days/yr
- Hot days in 30 yrs
- 15 days/yr
Wind risk 6/10 · Moderate
- Chance of severe wind over 30 yrs
- 69.0%
Air-quality risk 5/10 · Moderate
- Unhealthy air days now
- 6 days/yr
- Unhealthy air days in 30 yrs
- 8 days/yr
Risk factors via First Street. Map © Google.
Why this score? — see what drove the C- grade
The composite is a weighted blend of 9 inputs, each scored 0–100. Each bar is that input's sub-score; the figure is the points it added to the 100-point composite (weight × sub-score).
- ARV discount +15.0/15.0
- Cash flow +13.5/30.0
- Schools +5.0/10.0
- DSCR +4.1/10.0
- Rent growth +4.0/5.0
- Livability +3.8/5.0
- 1% rule +3.0/10.0
- Condition / age +2.5/5.0
- Appreciation +0.0/10.0
$439,000
🖨 Deal sheet (PDF) 📄 Offer letter ✓ Due diligence
Listing remarks
AUCTION/OCCUPIED. 2 bedroom, 1 bath 1 family home in East New York on a 3,000 square foot lot. Home has 1,360 square feet of space and new A, C and 3 trains. Property is sold “as is” with NO property disclosures, NO inspection reports, NO interior photos, NO lease in place, NO access- The seller does not represent or guarantee occupancy status. NO VIEWINGS of this property. Please DO NOT DISTURB the occupant. Buyer is responsible for obtaining possession of the property upon closing.
Key facts
- 3,000 sq ft lot
- Built 1925
- Listed 100 days
Property features AI
Exterior
- Parking: On-street parking; No carport
- Utilities: Public sewer; Electricity available
- Home design: Single family residence; Living area reported from public records (1360 total building area)
- Construction: Built with other construction materials
- Exterior features: Other construction materials; Other foundation details; Not waterfront
Interior
- Kitchen: Other appliances
- Bedrooms: 4 total rooms (includes bedrooms and living spaces)
- Bathrooms: 1 full bathroom
- Heating & cooling: Other heating; No central cooling
- Interior features: Other interior features
- Laundry & utility: No basement
Neighborhood map
What this means for you Summary
Snapshot
- This is a 2-bed/1.0-bath single-family listed at $439k.
Deal economics
- At list price, monthly cash flow is $-49 ($-585/yr) — negative.
- To cash-flow at today's rent, offer at most $430k (2.0% below list).
- To meet the 1% rule (rent ≥ 1% of price), the offer needs to be $350k (20.3% below list).
- Recommended offer: $350k (20.3% below list) — sets the bar for 1% rule.
- Cap rate 6.3% vs local median 2.6% in New York — top-decile yield for the area; either an underpriced asset or a hidden risk that comps aren't pricing in. Stress-test before assuming the spread holds.
Location & tenants
- Location reads 75/100 on livability (#268 in NY, #4,188 nationally) — a middle-class / working-renter tenant base. Strengths: amenities A+, commute A+, health & safety A; Watch: crime F, cost of living F.
- Zoned schools: Elm Tree Elementary School (math 27% / reading 52%, grade F, #1,444 of 2,108 statewide, top 71%, 806 students, 94% FRL); Jhs 383 Philippa Schuyler (math 32% / reading 67%, grade C, #280 of 729 statewide, top 40%, 822 students, 85% FRL); Midwood High School (math 94% / reading 96%, grade A+, #83 of 1,100 statewide, top 8%, 4,062 students, 73% FRL).
- Market conditions: Rents rising fast (+6.1%/yr); 193 active listings in the ZIP; 6 comparable units currently listed for rent nearby; rentals at typical pace (median 27d on market — plan ~3-4 weeks tenant-placement turnaround); 10,063 units permitted in Kings County in 2024 (9,789 in 5+ unit buildings).
- At $3,500/mo this rent would consume 68% of the median local household income ($62k/yr) (locally 7574% of renters already pay >50% of income on rent) — very limited rent-growth headroom before tenants either downsize or default.
Forward outlook
- Local home prices are declining (-3.0%/yr); year-one equity from $3k of loan paydown is wiped out by about $13k of value loss. Plan a longer hold.
- Kings County population projected at +13% by 2050 — modest demand growth; plan on rents tracking national, not racing it.
Negotiation context
- It's been on market 101 days — a 9% lower offer ($399k) is reasonable based on typical stale-listing flexibility.
Risks & watch-outs
- Watch-outs: flood insurance adds $66/mo; built in 1925 — expect roof / HVAC / electrical / plumbing capex.
- Climate carrying-cost: severe flood risk; major wind risk, 69% chance of damaging wind over 30y; extreme-heat days projected 7→15/yr by 2055 (HVAC capex compounding) — expect insurance premiums to compound above CPI over the hold.
Questions for the listing agent
- What do current leases actually rent for vs. the listed asking? Can we see a recent rent roll and the last 12 months of T-12 income?
- It's been on market 101 days. Have you received any prior offers? Is the seller open to a 20% concession, seller financing, or rate buy-down credit?
- Built in 1925 — when were the roof, HVAC, electrical panel, plumbing, and water heater last replaced?
- What's the actual annual flood-insurance premium (NFIP or private), and is the property in a SFHA with mandatory coverage?
- Why hasn't it sold? Are there any deal-killer items the seller is aware of (foundation, flood, title, zoning, code violations)?
- Is there a deadline driving the sale (1031 exchange, divorce, estate, relocation)? That informs how much negotiation room exists.
- Schools are B-rated — typically a magnet for longer-tenancy family renters. What's the average tenant stay here, and is there a school-zone premium baked into asking?
- Crime grade is F in this area — have there been break-ins, vandalism, or insurance claims at this property in the last 3 years? What carrier currently insures it and at what premium?
- What's the average days-on-market for RENTAL listings here right now (not sales)? A rising rental-DOM trend means longer vacancies and softer asking-rent achievability than the comps imply.
- What's the recent tenant-quality profile in this submarket — average credit score on applications, eviction rate, late-payment / NSF rate, and stable-employment percentage? A property-management company in the area should have these aggregated.
- How much new for-sale + rental construction is in the pipeline within 1–3 miles? Heavy new supply typically softens prices + rents 12–24 months out; constrained supply supports both.
Investment metrics
- 1% rule
- 0.80% ✗
- Cap rate
- 6.34%
- Cash-on-cash
- 0.17%
- DSCR
- 1.01
- GRM
- 10.5
CMA / ARV
- ARV (on-the-fly)
- $708,560
- Comps found
- 4
Show comp detail 4 sales within ~0.75 mi
| Address | Dist | Beds/Ba | Sqft | Sold | Price | $/sf | Match |
|---|---|---|---|---|---|---|---|
| 589 Milford St | 0.18mi | 3/1.0 (+1) | 1,308 (-4%) | 5mo | $650,000 | $497 | 76 |
| 727 Euclid Ave | 0.24mi | 3/2.5 (+1) | 1,296 (-5%) | 2mo | $675,000 | $521 | 68 |
| 270 Milford St | 0.63mi | 3/3.0 (+1) | 1,440 (+6%) | 10mo | $750,000 | $521 | 40 |
| 613 Elton St | 0.67mi | 3/1.5 (+1) | 1,200 (-12%) | 4mo | $655,000 | $546 | 38 |
Match score weights: distance 35% · size 25% · config 20% · recency 20%. Top-matched comps best support the ARV.
Projected returns pro-forma
-3.0% appreciation · 6.14% rent growth · sell at horizon
- IRR
- -13.9%
- Equity multiple
- 0.49×
- Total profit
- $-62,922
- Equity at exit
- $65,456
- IRR
- -1.0%
- Equity multiple
- 0.93×
- Total profit
- $-9,207
- Equity at exit
- $37,957
Cash invested: $122,920 (down + closing). Projections, not guarantees.
Landlord ↔ Tenant lean methodology
- Overall (CITY)
- 0 Strongly Tenant-Friendly
- State New York
- 15 Strongly Tenant-Friendly · D+10
- County
- — inherits STATE
- City New York
- 0 Strongly Tenant-Friendly · D+34
ZIP-level market 11208
- Rents YoY
- 6.1%
- Active inventory
- 193
- Price-to-rent
- 10.5×
Monthly cashflow live
- Estimated rent
- $3,500 high interval (Pro) →
- Mortgage (P&I)
- −$2,302
- Tax from tax record
- −$262 /mo · $3,146/yr
- Insurance
- −$183
- Flood insurance flood zone
- −$66 /mo · $798/yr
- HOA
- −$0
- Lot rent
- −$0
- Vacancy / Maint / Mgmt
- −$735
- Net cashflow
- $-49
Break-even live
Sensitivity live
| Price | -10% $200 | -5% $75 | +0% $-49 | +5% $-173 | +10% $-297 |
|---|---|---|---|---|---|
| Rent | -10% $-325 | -5% $-187 | +0% $-49 | +5% $89 | +10% $228 |
| Rate | -1.0pp $172 | -0.5pp $63 | base $-49 | +0.5pp $-163 | +1.0pp $-278 |
UW: 25.0% down · 7.5% · 30yr · 1.5% tax · 5.0% vac · 8.0% maint · 8.0% mgmt
Financing live
Cash to close
- Down payment
- $109,750
- Closing costs
- $13,170
- Reserves months
- —
- Total cash needed
- —
Loan-product check · same deal, 3 products live
Conventional
25% down · 7.5% · 30yr
- Down + closing
- —
- Monthly P&I
- —
- Monthly cashflow
- —
- DSCR
- —
- Eligible?
- —
Personal DTI + credit; lowest rate.
DSCR
20% down · 8.5% · 30yr
- Down + closing
- —
- Monthly P&I
- —
- Monthly cashflow
- —
- DSCR
- —
- Eligible?
- —
No personal income docs; deal must DSCR.
Hard money
10% down · 12.0% · 12mo
- Down + closing
- —
- Monthly P&I
- —
- Monthly cashflow
- —
- DSCR
- —
- Eligible?
- —
Short-term bridge; refi at stabilization.
Rent comps 6 comps
| Address | Beds | Baths | Sqft | Rent | $/sqft | DOM | Units | Dist |
|---|---|---|---|---|---|---|---|---|
| 156-49 76th St Unit 2 Jamaica, NY | 3.0 | 2.0 | 1250 | $3,300 | $2.64 | 19d | 1 | 0.76mi |
| 14912 83rd St Howard Beach, NY | 3.0 | 2.0 | 1250 | $3,200 | $2.56 | 27d | 1 | 0.90mi |
| 13214 81st St Ozone Park, NY | 3.0 | 1.0 | 1280 | $4,100 | $3.20 | 13d | 1 | 0.92mi |
| 132-13 81st St #1 Jamaica, NY | 3.0 | 1.0 | 1280 | $4,100 | $3.20 | 5d | 1 | 0.94mi |
| 10541 90th St Ozone Park, NY | 3.0 | 2.0 | 1264 | $4,111 | $3.25 | 27d | 1 | 1.42mi |
| 90-18 77th St Unit 2 Jamaica, NY | 3.0 | 1.0 | 913 | $3,295 | $3.61 | 27d | 1 | 1.48mi |
Listing history 6 events
-
2026-05-20price $439,000
-
2026-03-23price $508,300
-
2026-03-06price $515,300
-
2026-02-14$524,700 Active
-
2006-04-21soldstatus $430,000
-
1981-11-01soldstatus $44,545
ⓘ Source: listings_history table (triggers on properties + properties_extension) + one-shot
backfill from property_details.listing_events for pre-trigger history.
Tax reassessment forecast NY · Partial reset (capped growth)
- Current annual tax
- $3,146 · $262/mo
- Projected year-2 tax
- $5,283 · $440/mo
- Expected delta
- +$2,137/yr (+$178/mo · 67.9%)
ⓘ Screening estimate from a state-policy table — verify with the county assessor before closing.
Climate risk First Street
- Flood 8/10 Severe FEMA zone X (unshaded) · 78% chance over 30 yrs
- Wildfire 1/10 Low
- Heat 7/10 Severe 7 d/yr ≥99°F today · 15 d/yr by 30 yrs out
- Wind 6/10 Major 69% chance of damaging wind over 30 yrs
- Air quality 5/10 Major 6 unhealthy d/yr today · 8 by 30 yrs out
Nearby sold comps map
Loading sold comps map…
Walkable amenities ~0.75 mi
Loading nearby amenities…
Taxation est. · year 1
- Rental income
- $41,999
- − Mortgage interest
- −$24,591
- − Property taxes
- −$3,146
- − Insurance
- −$2,992
- − Repairs & maintenance
- −$3,360
- − Management
- −$3,360
- − Depreciation
- −$12,771
- Taxable loss
- −$8,221
- Est. tax savings @ 24.0%
- +$1,973
- After-tax cash flow
- $1,388/yr
For passive investors: Depreciation is non-cash, so a rental often shows a tax loss while cash-flowing — sheltering income. Rental losses are passive: they offset passive income freely, and up to $25,000/yr can offset ordinary (W-2) income if you actively participate and your MAGI is under $100k (phasing out to $0 by $150k); unused losses carry forward. On sale, claimed depreciation is recaptured at up to 25%, and gains may owe capital-gains tax (a 1031 exchange can defer both). Figures are a year-1 estimate at your 24.0% rate — not tax advice; consult a CPA.
Schools (NCES district)
No district data.
Livability — New York
- Score
- 75/100
- State rank
- #268
- US rank
- #4188
Category grades
Schools grade is shown separately in the Schools card above.
Census & demographics
- Census place
- New York, NY
- County
- Kings County · 2,614,986 people
- City population
- 7,731,280
- Metro
- New York-Newark-Jersey City, NY-NJ-PA
- Population (ZIP)
- 105,428
- Household income
- $62,077
- Rent vs Own
- Severe rent burden
- 7574.0
Population outlook (Kings County) Hauer SSP2
- Today (2025)
- 2,847,441 people
- By 2030
- 2,937,006 · +3.1%
- By 2040
- 3,095,491 · +8.7%
- By 2050
- 3,228,968 · +13.4%
- By 2075
- 3,321,723 · +16.7%
- By 2100
- 3,111,387 · +9.3%
Race, ethnicity, and origin ACS 2023
- Neighborhood character
- Diverse neighborhood (Simpson 0.66)
- Race & ethnicity
- Black 42% Hispanic / Latino 39% Asian 10% Two or more races 8% White 3%
- Hispanic origin (detail)
- Mexican 2% Puerto Rican 9% Dominican 16%
- Common ancestry
- Hispanic 1%
- Foreign-born
- 40% · Canada, China, Mexico
- Languages at home
- 48% English-only · Spanish 36% Other Indo-European 11% French/Haitian/Cajun 1%
Political lean MEDSL · Kings
- 2024 margin
- Solid D (+44.0) · D 72.0% · R 28.0%
- 2008→2024 swing
- -15.5pp toward R · 2008: 59.4pp · 2024: 44.0pp
- All cycles
- 2024: D+44.0 2020: D+54.8 2016: D+61.8 2012: D+63.9 2008: D+59.4
Not yet ingested
- Civics
- —
Market trends
- HPI YoY
- ▼ -546.38%
- Current HPI
- 376.1489
- Rent YoY
- ▲ 6.14%
- Metro
- New York-Newark-Jersey City, NY-NJ-PA
- State GDP YoY
- ▲ 2.60%
- F500 in state
- 92
Industry mix (Fortune 500 HQ in NY)
| Industry | F500 HQs | Revenue |
|---|---|---|
| Financial Services | 10 | $950B |
|
||
| Consumer Goods | 9 | $162B |
|
||
| Insurance | 4 | $225B |
|
||
| Telecommunications | 2 | $144B |
|
||
| Pharmaceuticals | 2 | $112B |
|
||
| Media / Entertainment | 2 | $69B |
|
||
Price history
+885.5% since first listed6 events — show timeline
- 2026-05-20 Price Changed $439,000 OneKey® MLS as Distributed by MLS Grid
- 2026-03-23 Price Changed $508,300 OneKey® MLS as Distributed by MLS Grid
- 2026-03-06 Price Changed $515,300 OneKey® MLS as Distributed by MLS Grid
- 2026-02-14 Listed $524,700 OneKey® MLS as Distributed by MLS Grid
- 2006-04-21 Sold (Public Records) $430,000 Public Records
- 1981-11-01 Sold (Public Records) $44,545 Public Records
Property tax history
+4.7%/yrLatest (2025): $3,146 · -2.4% YoY. Source: county tax records.
Cash-flow waterfall
monthlySold comps — $/sqft
last 12 mo · ≤1 miLoading sold comps…