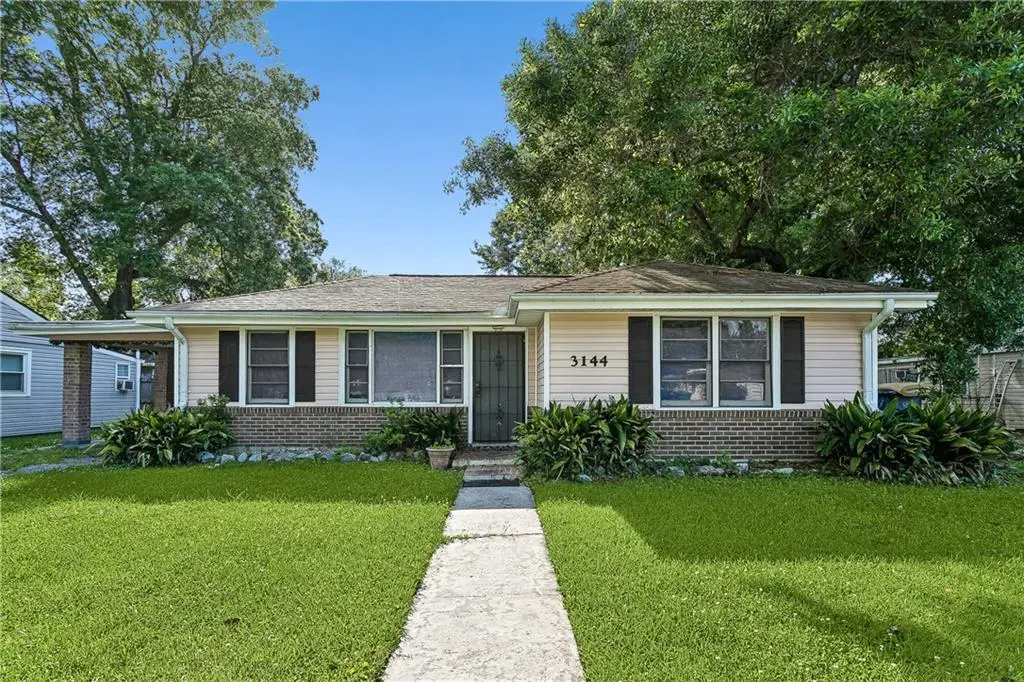
3144 Carey St · Slidell, LA
Flood risk No data
- FEMA flood zone
- —
- Chance of flooding over 30 yrs
- —
- Est. flood insurance / yr
- —
Fire risk No data
- Est. fire insurance / yr
- —
Heat risk No data
- Hot days now (above threshold)
- —
- Hot days in 30 yrs
- —
Wind risk No data
- Chance of severe wind over 30 yrs
- —
Air-quality risk No data
- Unhealthy air days now
- —
- Unhealthy air days in 30 yrs
- —
Risk factors via First Street. Map © Google.
Why this score? — see what drove the D grade
The composite is a weighted blend of 9 inputs, each scored 0–100. Each bar is that input's sub-score; the figure is the points it added to the 100-point composite (weight × sub-score).
- Cash flow +18.2/30.0
- DSCR +5.7/10.0
- 1% rule +4.5/10.0
- Schools +4.3/10.0
- Livability +3.5/5.0
- Rent growth +2.9/5.0
- Condition / age +2.5/5.0
- ARV discount +1.5/15.0
- Appreciation +0.0/10.0
$162,000
🖨 Deal sheet (PDF) 📄 Offer letter ✓ Due diligence
Listing remarks MLS
Charming 2 bedroom, 1 bath home in a convenient Slidell centrally located to shopping, dining, schools, and everyday amenities. This property offers plenty of potential for a buyer with vision and creativity to transform it into something truly special. Inside, you'll find a fully enclosed sunroom that provides additional living space and endless possibilities for a home office, playroom, hobby room, or relaxing retreat. Outside, the home features a covered carport with an attached storage room, a spacious fenced backyard, and a detached workshop complete with its own covered patio and carport area. Whether you're looking for your next home, an investment opportunity, or a project to make your own, this property offers a solid foundation and room to bring your ideas to life. Don't miss the chance to unlock its full potential.
Key facts
- 3 parking spots
- Built 1980
- Listed 17 days
Property features AI
Finance
- Other: Workshop on the property; Lot dimensions approximately 60 x 120
Exterior
- Parking: Covered carport; Carport; Driveway; Three or more parking spaces
- Utilities: Public water; Public sewer
- Home design: Single-story home
- Construction: Brick construction; Shingle roof; Slab foundation; Built in a single story
- Exterior features: Fenced yard; Permeable paving; Outside city limits; Rectangular lot
Interior
- Kitchen: Oven; Range
- Bathrooms: 1 full bathroom
- Heating & cooling: Central heating; Central air conditioning
- Interior features: Total of 4 rooms; Very good condition
- Laundry & utility: Washer; Dryer
Neighborhood map
What this means for you Summary
Snapshot
- This is a 2-bed/1.0-bath single-family listed at $162k.
Deal economics
- At list price, monthly cash flow is $146 ($2k/yr) — positive.
- The deal already cash-flows at list — no discount required.
- To meet the 1% rule (rent ≥ 1% of price), the offer needs to be $153k (5.4% below list).
- Recommended offer: $153k (5.4% below list) — sets the bar for 1% rule.
- Cap rate 7.4% vs local median 5.9% in Slidell — meaningfully above typical; check what's discounted (condition, days-on-market, listing class) to confirm the premium yield is real.
Location & tenants
- Location reads 70/100 on livability (#57 in LA) — a middle-class / working-renter tenant base. Strengths: cost of living A+, housing A+, health & safety A+; Watch: amenities F, commute F.
- St. Tammany Parish (suburban): math 43% / reading 55% proficiency, ranked #11 of 98 in LA (top 11%) — families likely to look elsewhere, expect single-tenant / working-renter base with shorter leases.
- Zoned schools: Glynn H. Brock Elementary School (math 32% / reading 42%, grade F, #251 of 646 statewide, top 41%, 320 students, 79% FRL); St. Tammany Junior High School (math 19% / reading 41%, grade F, #114 of 218 statewide, top 53%, 793 students, 68% FRL); Salmen High School (math 15% / reading 27%, grade F, #179 of 265 statewide, top 68%, 1,216 students, 62% FRL) — zoned schools average 70% FRL vs 40% district-wide (30 pts higher); higher-poverty schools than district average — tighter screening recommended.
- Zoned-school proficiency averages 29% at this address vs 49% district-wide (-20 pts) — the specific schools serving this property underperform the St. Tammany Parish average; the district grade overstates school quality for this exact location.
- Market conditions: Rents rising (+1.5%/yr); 489 active listings in the ZIP; 20 comparable units currently listed for rent nearby; rentals at typical pace (median 26d on market — plan ~3-4 weeks tenant-placement turnaround); 40% of comp listings sitting > 30 days — soft ceiling on asking rent; 1,064 units permitted in St. Tammany Parish in 2024 (0 in 5+ unit buildings).
Forward outlook
- Local home prices are declining (-3.0%/yr); year-one equity from $1k of loan paydown is wiped out by about $5k of value loss. Plan a longer hold.
- St. Tammany County population projected at +27% by 2050 — long-run rental-demand tailwind backs the buy-and-hold thesis.
Negotiation context
- It's been on market 17 days — a 2% lower offer ($160k) is reasonable based on typical stale-listing flexibility.
- 4 sale attempts with the ask held roughly flat each time — persistent listings suggest the price (not the market) is what's stuck; bring a comps-based counter.
Questions for the listing agent
- Is there a deadline driving the sale (1031 exchange, divorce, estate, relocation)? That informs how much negotiation room exists.
- Schools are B-rated — typically a magnet for longer-tenancy family renters. What's the average tenant stay here, and is there a school-zone premium baked into asking?
- The area grade is low — what's the realistic commute time and amenity access for the typical tenant pool here? Any planned neighborhood developments (good or bad) we should know about?
- What's the average days-on-market for RENTAL listings here right now (not sales)? A rising rental-DOM trend means longer vacancies and softer asking-rent achievability than the comps imply.
- What's the recent tenant-quality profile in this submarket — average credit score on applications, eviction rate, late-payment / NSF rate, and stable-employment percentage? A property-management company in the area should have these aggregated.
- How much new for-sale + rental construction is in the pipeline within 1–3 miles? Heavy new supply typically softens prices + rents 12–24 months out; constrained supply supports both.
Investment metrics
- 1% rule
- 0.95% ✗
- Cap rate
- 7.37%
- Cash-on-cash
- 3.85%
- DSCR
- 1.17
- GRM
- 8.8
CMA / ARV
- ARV (median comp)
- $142,875
- List price
- $162,000
- Delta
- 11.99%
- Verdict
- OVERPRICED
- Comps
- 20 within 1.0 mi
Show comp detail 12 sales within ~0.75 mi
| Address | Dist | Beds/Ba | Sqft | Sold | Price | $/sf | Match |
|---|---|---|---|---|---|---|---|
| 2725 College St | 0.42mi | 2/1.5 | 1,278 (-2%) | 1mo | $179,000 | $140 | 74 |
| 241 Jacob Dr | 0.19mi | 2/2.0 | 1,208 (-8%) | 2mo | $89,000 | $74 | 72 |
| 2872 Slidell Ave | 0.47mi | 3/1.0 (+1) | 1,338 (+2%) | 1mo | $139,000 | $104 | 69 |
| 328 Hickory Dr | 0.45mi | 3/1.0 (+1) | 1,350 (+3%) | 4mo | $137,000 | $101 | 65 |
| 3637 Riviera Dr | 0.41mi | 3/2.0 (+1) | 1,200 (-8%) | 2mo | $138,000 | $115 | 56 |
| 808 Pine Tree St | 0.65mi | 2/2.0 | 1,241 (-5%) | 7mo | $145,000 | $117 | 51 |
| 176 Southpark Dr | 0.38mi | 3/2.0 (+1) | 1,442 (+10%) | 8mo | $170,000 | $118 | 50 |
| 2731 Harris Ave | 0.70mi | 2/1.0 | 1,172 (-11%) | 2mo | $100,000 | $85 | 49 |
| 931 Hailey Ave | 0.59mi | 3/2.0 (+1) | 1,445 (+10%) | 2mo | $141,000 | $98 | 44 |
| 2651 2nd St | 0.58mi | 3/2.0 (+1) | 1,184 (-10%) | 4mo | $175,000 | $148 | 44 |
| 471 Olive Dr | 0.72mi | 3/2.0 (+1) | 1,238 (-6%) | 6mo | $150,000 | $121 | 43 |
| 3844 Riviera Dr | 0.68mi | 3/1.5 (+1) | 1,466 (+12%) | 6mo | $150,000 | $102 | 37 |
Match score weights: distance 35% · size 25% · config 20% · recency 20%. Top-matched comps best support the ARV.
Projected returns pro-forma
-3.0% appreciation · 1.47% rent growth · sell at horizon
- IRR
- -11.9%
- Equity multiple
- 0.57×
- Total profit
- $-19,309
- Equity at exit
- $24,155
- IRR
- -5.1%
- Equity multiple
- 0.69×
- Total profit
- $-14,158
- Equity at exit
- $14,007
Cash invested: $45,360 (down + closing). Projections, not guarantees.
Landlord ↔ Tenant lean methodology
- Overall (STATE)
- 90 Strongly Landlord-Friendly
- State Louisiana
- 90 Strongly Landlord-Friendly · R+12
- County
- — inherits STATE
- City
- — inherits STATE
ZIP-level market 70458
- Rents YoY
- 1.5%
- Active inventory
- 489
- Price-to-rent
- 8.8×
Monthly cashflow live
- Estimated rent
- $1,532 high interval (Pro) →
- Mortgage (P&I)
- −$850
- Tax from tax record
- −$148 /mo · $1,776/yr
- Insurance
- −$68
- HOA
- −$0
- Vacancy / Maint / Mgmt
- −$322
- Net cashflow
- $146
Break-even live
Sensitivity live
| Price | -10% $237 | -5% $192 | +0% $146 | +5% $100 | +10% $54 |
|---|---|---|---|---|---|
| Rent | -10% $25 | -5% $85 | +0% $146 | +5% $206 | +10% $267 |
| Rate | -1.0pp $227 | -0.5pp $187 | base $146 | +0.5pp $104 | +1.0pp $61 |
UW: 25.0% down · 7.5% · 30yr · 1.5% tax · 5.0% vac · 8.0% maint · 8.0% mgmt
Financing live
Cash to close
- Down payment
- $40,500
- Closing costs
- $4,860
- Reserves months
- —
- Total cash needed
- —
Loan-product check · same deal, 3 products live
Conventional
25% down · 7.5% · 30yr
- Down + closing
- —
- Monthly P&I
- —
- Monthly cashflow
- —
- DSCR
- —
- Eligible?
- —
Personal DTI + credit; lowest rate.
DSCR
20% down · 8.5% · 30yr
- Down + closing
- —
- Monthly P&I
- —
- Monthly cashflow
- —
- DSCR
- —
- Eligible?
- —
No personal income docs; deal must DSCR.
Hard money
10% down · 12.0% · 12mo
- Down + closing
- —
- Monthly P&I
- —
- Monthly cashflow
- —
- DSCR
- —
- Eligible?
- —
Short-term bridge; refi at stabilization.
Rent comps 20 comps
| Address | Beds | Baths | Sqft | Rent | $/sqft | DOM | Units | Dist |
|---|---|---|---|---|---|---|---|---|
| 3152 College St Slidell, LA | 3.0 | 1.0 | 1373 | $1,750 | $1.27 | 45d | 1 | 0.06mi |
| 2864 Slidell Ave Slidell, LA | 3.0 | 1.0 | 963 | $1,395 | $1.45 | 5d | 1 | 0.47mi |
| 2594 Front St Unit 2 Slidell, LA | 1.0 | 1.0 | 1200 | $1,450 | $1.21 | 16d | 1 | 0.58mi |
| 110 Canulette Rd #12 Slidell, LA | 1.0 | 1.0 | 1300 | $1,000 | $0.77 | 23d | 1 | 0.62mi |
| 901 Old Spanish Trl Slidell, LA | 2.0 | 1.5 | 1070 | $1,120 | $1.05 | 13d | 1 | 0.72mi |
| 3839 Oxford St Slidell, LA | 3.0 | 2.0 | 1660 | $1,700 | $1.02 | 45d | 1 | 0.74mi |
| 3304 Bridge Dr Slidell, LA | 3.0 | 2.0 | 1250 | $1,700 | $1.36 | 45d | 1 | 0.76mi |
| 3159 Dee St Slidell, LA | 3.0 | 1.0 | 898 | $1,400 | $1.56 | 45d | 1 | 0.76mi |
| 96 Chamale Cv Slidell, LA | 2.0 | 2.5 | 1432 | $1,500 | $1.05 | 25d | 1 | 0.98mi |
| 96 Chamale Cv Slidell, LA | 3.0 | 2.5 | 1432 | $1,500 | $1.05 | 45d | 1 | 0.98mi |
| 48 Chamale Cv E Slidell, LA | 2.0 | 2.0 | 1432 | $1,650 | $1.15 | 45d | 1 | 1.01mi |
| 517 Erlanger Ave Unit A Slidell, LA | 3.0 | 2.0 | 1134 | $1,400 | $1.23 | 45d | 1 | 1.11mi |
| 517 Erlanger Ave Unit A Slidell, LA | 3.0 | 2.0 | 1134 | $1,375 | $1.21 | 16d | 1 | 1.11mi |
| 2004 5th St Unit A Slidell, LA | 2.0 | 1.0 | 900 | $1,250 | $1.39 | 25d | 1 | 1.13mi |
| 516 Erlanger Ave Slidell, LA | 2.0 | 2.0 | 1250 | $1,750 | $1.40 | 45d | 1 | 1.14mi |
| 301 Spartan Dr Slidell, LA | 1.0–2.0 | 1.0–2.0 | 880 | $1,502 | $1.71 | 5d | 8 | 1.18mi |
| 102 Spartan Trace Blvd Slidell, LA | 3.0 | 2.0 | 1516 | $2,000 | $1.32 | 25d | 1 | 1.18mi |
| 519 Spartan Dr #9101 Slidell, LA | 2.0 | 2.0 | 1304 | $1,400 | $1.07 | 25d | 1 | 1.28mi |
| 2001 Tenth St Unit B Slidell, LA | 3.0 | 2.0 | 1137 | $1,550 | $1.36 | 19d | 1 | 1.31mi |
| 1303 Town Center Pkwy Slidell, LA | 3.0 | 1.0–2.0 | 990 | $1,588 | $1.60 | 3d | 31 | 1.45mi |
Listing history 15 events
-
2026-06-21days on market $162,000 Active 17 DOM
-
2026-06-18days on market $162,000 Active 14 DOM
-
2026-06-17days on market $162,000 Active 13 DOM
-
2026-06-16days on market $162,000 Active 12 DOM
-
2026-06-15days on market $162,000 Active 11 DOM
-
2026-06-13days on market $162,000 Active 9 DOM
-
2026-06-10days on market $162,000 Active 6 DOM
-
2026-06-09days on market $162,000 Active 5 DOM
-
2026-06-08days on market $162,000 Active 4 DOM
-
2026-06-07pricedays on market $162,000 Active 3 DOM
-
2026-06-01days on market $160,000 Active 45 DOM
-
2026-05-31days on market $160,000 Active 44 DOM
-
2026-04-17$160,000 Active 1188-char remark
-
2026-04-17$160,000 Active 1182-char remark
-
2025-08-29$170,000 Active
ⓘ Source: listings_history table (triggers on properties + properties_extension) + one-shot
backfill from property_details.listing_events for pre-trigger history.
Tax reassessment forecast LA · Resets to sale price
- Current annual tax
- $1,776 · $148/mo
- Projected year-2 tax
- $1,776 · $148/mo
- Expected delta
- $0/yr ($0/mo · 0.0%)
ⓘ Screening estimate from a state-policy table — verify with the county assessor before closing.
Nearby sold comps map
Loading sold comps map…
Walkable amenities ~0.75 mi
Loading nearby amenities…
Taxation est. · year 1
- Rental income
- $18,390
- − Mortgage interest
- −$9,075
- − Property taxes
- −$1,776
- − Insurance
- −$810
- − Repairs & maintenance
- −$1,471
- − Management
- −$1,471
- − Depreciation
- −$4,713
- Taxable loss
- −$925
- Est. tax savings @ 24.0%
- +$222
- After-tax cash flow
- $1,970/yr
For passive investors: Depreciation is non-cash, so a rental often shows a tax loss while cash-flowing — sheltering income. Rental losses are passive: they offset passive income freely, and up to $25,000/yr can offset ordinary (W-2) income if you actively participate and your MAGI is under $100k (phasing out to $0 by $150k); unused losses carry forward. On sale, claimed depreciation is recaptured at up to 25%, and gains may owe capital-gains tax (a 1031 exchange can defer both). Figures are a year-1 estimate at your 24.0% rate — not tax advice; consult a CPA.
Schools (NCES district)
- District
- St. Tammany Parish
- NCES district ID
- 2201650
- Math proficiency
- 43% ▼ -32.00%
- Reading proficiency
- 55% ▼ -26.00%
- Median HH income
- $61,752
- Composite
- 43.04/100
- National rank
- #3098
- State rank
- #11 of 98 in LA
Livability — Slidell
- Score
- 70/100
- State rank
- #57
- US rank
- #7673
Category grades
Schools grade is shown separately in the Schools card above.
Census & demographics
- Census place
- Slidell, LA
- County
- Saint Tammany Parish · 228,296 people
- City population
- 95,511
- Metro
- New Orleans-Metairie, LA
- Population (ZIP)
- 39,034
- Household income
- $72,843
- Rent vs Own
- Severe rent burden
- 1331.0
Population outlook (St. Tammany County) Hauer SSP2
- Today (2025)
- 286,725 people
- By 2030
- 304,175 · +6.1%
- By 2040
- 336,203 · +17.3%
- By 2050
- 364,590 · +27.2%
- By 2075
- 433,362 · +51.1%
- By 2100
- 470,333 · +64.0%
Race, ethnicity, and origin ACS 2023
- Neighborhood character
- Predominantly White (66%)
- Race & ethnicity
- White 66% Black 17% Two or more races 10% Hispanic / Latino 9% Native American 2% Asian 1%
- Hispanic origin (detail)
- Mexican 3% Puerto Rican 1%
- Common ancestry
- Lithuanian 15% Slovak 2% Romanian 1%
- Foreign-born
- 3% · Canada, Vietnam
- Languages at home
- 93% English-only · Spanish 5% Vietnamese 1%
Political lean MEDSL · St. Tammany
- 2024 margin
- Solid R (+43.8) · D 27.3% · R 71.1% · Other 1.6%
- 2008→2024 swing
- +9.6pp toward D · 2008: -53.4pp · 2024: -43.8pp
- All cycles
- 2024: R+43.8 2020: R+44.2 2016: R+50.8 2012: R+52.2 2008: R+53.4
Not yet ingested
- Civics
- —
Market trends
- HPI YoY
- ▼ -173.60%
- Current HPI
- 147.4749
- Rent YoY
- ▲ 1.47%
- Metro
- New Orleans-Metairie, LA
- State GDP YoY
- ▲ 3.29%
- F500 in state
- 10
Industry mix (Fortune 500 HQ in LA)
| Industry | F500 HQs | Revenue |
|---|---|---|
| Telecommunications | 2 | $23B |
|
||
| Utilities | 1 | $12B |
|
||
| Wholesale / Distribution | 1 | $5B |
|
||
| Advertising | 1 | $2B |
|
||
Price history
-4.7% since first listed4 events — show timeline
- 2026-06-04 Listed $162,000 AcadianaMLS
- 2026-06-04 Listed $162,000 GSREIN
- 2026-04-17 Listed $160,000 AcadianaMLS
- 2025-08-29 Listed $170,000 AcadianaMLS
Property tax history
+12.8%/yrLatest (2025): $1,776 · -6.2% YoY. Source: county tax records.
Cash-flow waterfall
monthlySold comps — $/sqft
last 12 mo · ≤1 miLoading sold comps…