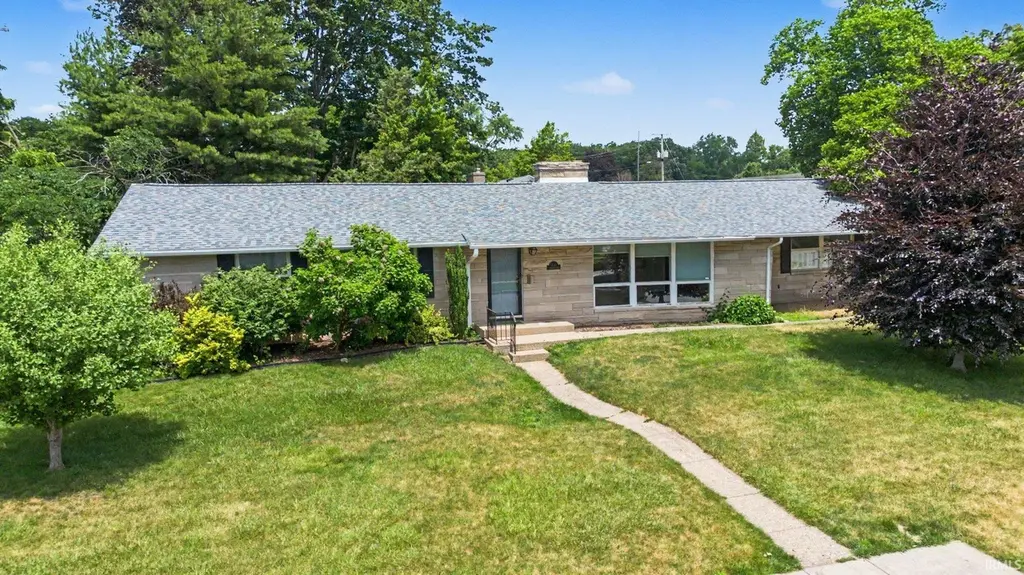
1733 Southwood Ave · South Bend, IN
Flood risk 1/10 · Minimal
- FEMA flood zone
- X (unshaded)
- Chance of flooding over 30 yrs
- 0.0%
- Est. flood insurance / yr
- $473 – $860
Fire risk 1/10 · Minimal
- Est. fire insurance / yr
- $717 – $1,331
Heat risk 3/10 · Minor
- Hot days now (above 99°F)
- 7 days/yr
- Hot days in 30 yrs
- 16 days/yr
Wind risk 2/10 · Minimal
- Chance of severe wind over 30 yrs
- —
Air-quality risk 3/10 · Minor
- Unhealthy air days now
- 2 days/yr
- Unhealthy air days in 30 yrs
- 3 days/yr
Risk factors via First Street. Map © Google.
Why this score? — see what drove the F grade
The composite is a weighted blend of 9 inputs, each scored 0–100. Each bar is that input's sub-score; the figure is the points it added to the 100-point composite (weight × sub-score).
- ARV discount +11.6/15.0
- Cash flow +7.5/30.0
- Rent growth +4.1/5.0
- Livability +3.2/5.0
- Condition / age +2.5/5.0
- 1% rule +1.7/10.0
- DSCR +1.6/10.0
- Schools +1.4/10.0
- Appreciation +0.0/10.0
$259,900
🖨 Deal sheet (PDF) 📄 Offer letter ✓ Due diligence
Listing remarks
Investor special alert for this Mid-Century Modern limestone ranch that is a literal stone’s throw from Potowatami Zoo & Park in the heart of Sunnymede. 4 bedrooms, 2 full bathrooms and less than 2 miles from Notre Dame in the same neighborhood as IUSB, Adams High School, and the farmer’s market. This home needs TLC before it can go on HGTV but it’s priced accordingly. A remodeler could easily lean into the MCM architecture and wraparound fireplace feature wall. Roof is 2 years old, HVAC is newer, and a whole home inspection from June 2026 is appended to the Seller’s Disclosure. Make no mistake, this home is being sold as-is. Which investor has the vision to ma
Key facts
- Roof is 2 years old
- Newer hvac
- 0.23 acre lot
Tags
Property features AI
Exterior
- Parking: Attached garage with concrete driveway; 1 garage space
- Utilities: Public water; Public sewer; Natural gas available
- Home design: Single-family, site-built home; One-story
- Construction: Slab foundation; Asphalt shingle roof
- Exterior features: Patio; Full privacy fencing; Corner lot; Sloped lot
Interior
- Kitchen: Dishwasher; Refrigerator; Indoor grill; Electric range
- Flooring: Laminate counters noted (flooring type not specified)
- Bathrooms: Two full bathrooms (both on the main level)
- Heating & cooling: Forced air heating (natural gas); Central air conditioning
- Interior features: Breakfast bar; Eat-in kitchen; Laminate counters; Built-in features; Wood-burning fireplace in the living room
- Laundry & utility: Main-level laundry; Gas water heater
Neighborhood map
What this means for you Summary
Snapshot
- This is a 4-bed/2.0-bath single-family listed at $260k.
Deal economics
- At list price, monthly cash flow is $-328 ($-4k/yr) — negative.
- To cash-flow at today's rent, offer at most $202k (22.3% below list).
- To meet the 1% rule (rent ≥ 1% of price), the offer needs to be $174k (32.9% below list).
- Recommended offer: $174k (32.9% below list) — sets the bar for 1% rule.
Location & tenants
- Location reads 64/100 on livability (#365 in IN) — a middle-class / working-renter tenant base. Strengths: cost of living A+, housing A+, health & safety A+; Watch: amenities D, employment D, crime F.
- South Bend Community School Corporation (urban): math 12% / reading 21% proficiency, ranked #284 of 301 in IN (top 94%) — low school quality limits family demand, transient renter base, plan for 1-2y turnover; 66% free/reduced lunch — lower-income household profile, screen leases tightly.
- Zoned schools: Nuner Fine Arts Academy (math 8% / reading 12%, grade F, #921 of 994 statewide, top 94%, 479 students, 90% FRL); Jefferson Traditional School (math 12% / reading 22%, grade F, #284 of 330 statewide, top 87%, 516 students, 64% FRL); Adams High School (math 28% / reading 57%, grade F, #195 of 369 statewide, top 53%, 1,976 students, 56% FRL) — zoned schools at 70% FRL track the district average.
- Market conditions: Rents rising fast (+6.3%/yr); 76 active listings in the ZIP; 11 comparable units currently listed for rent nearby; rentals at typical pace (median 23d on market — plan ~3-4 weeks tenant-placement turnaround); 754 units permitted in St. Joseph County in 2024 (460 in 5+ unit buildings).
- This rent runs 33% of the median local income ($63k/yr) — at the standard rent-burdened threshold; future hikes will face affordability resistance.
Forward outlook
- Local home prices are declining (-3.0%/yr); year-one equity from $2k of loan paydown is wiped out by about $8k of value loss. Plan a longer hold.
Negotiation context
- Only 10 days on market — expect competitive offers; lowballing is unlikely to land.
Risks & watch-outs
- Watch-outs: built in 1953 — expect roof / HVAC / electrical / plumbing capex.
Questions for the listing agent
- What do current leases actually rent for vs. the listed asking? Can we see a recent rent roll and the last 12 months of T-12 income?
- Built in 1953 — when were the roof, HVAC, electrical panel, plumbing, and water heater last replaced?
- Is there a deadline driving the sale (1031 exchange, divorce, estate, relocation)? That informs how much negotiation room exists.
- Schools are F-rated, which usually means shorter tenancies and higher turnover. Who's the typical renter profile here, and what's been the actual vacancy rate?
- Crime grade is F in this area — have there been break-ins, vandalism, or insurance claims at this property in the last 3 years? What carrier currently insures it and at what premium?
- The area grade is low — what's the realistic commute time and amenity access for the typical tenant pool here? Any planned neighborhood developments (good or bad) we should know about?
- What's the average days-on-market for RENTAL listings here right now (not sales)? A rising rental-DOM trend means longer vacancies and softer asking-rent achievability than the comps imply.
- What's the recent tenant-quality profile in this submarket — average credit score on applications, eviction rate, late-payment / NSF rate, and stable-employment percentage? A property-management company in the area should have these aggregated.
- How much new for-sale + rental construction is in the pipeline within 1–3 miles? Heavy new supply typically softens prices + rents 12–24 months out; constrained supply supports both.
Investment metrics
- 1% rule
- 0.67% ✗
- Cap rate
- 4.78%
- Cash-on-cash
- -5.40%
- DSCR
- 0.76
- GRM
- 12.4
CMA / ARV
- ARV (on-the-fly)
- $285,945
- Comps found
- 12
Show comp detail 12 sales within ~0.75 mi
| Address | Dist | Beds/Ba | Sqft | Sold | Price | $/sf | Match |
|---|---|---|---|---|---|---|---|
| 1437 E Monroe St | 0.31mi | 3/1.5 (-1) | 1,848 (+7%) | 0mo | $365,000 | $198 | 68 |
| 1510 Sunnymede Ave | 0.27mi | 3/2.5 (-1) | 1,848 (+7%) | 3mo | $450,000 | $244 | 67 |
| 1716 E Wayne St | 0.22mi | 3/1.5 (-1) | 1,919 (+11%) | 1mo | $427,500 | $223 | 64 |
| 1406 Longfellow Ave | 0.34mi | 3/1.0 (-1) | 1,848 (+7%) | 1mo | $219,000 | $119 | 64 |
| 742 S 26th St | 0.58mi | 3/1.0 (-1) | 1,744 (+1%) | 1mo | $185,000 | $106 | 62 |
| 1603 Hoover Ave | 0.14mi | 3/1.5 (-1) | 1,950 (+12%) | 5mo | $300,000 | $154 | 61 |
| 118 S Greenlawn Ave | 0.45mi | 3/1.5 (-1) | 1,604 (-7%) | 1mo | $271,000 | $169 | 59 |
| 1113 S 23rd St | 0.60mi | 3/1.0 (-1) | 1,680 (-3%) | 1mo | $185,000 | $110 | 58 |
| 1352 E South St | 0.36mi | 3/1.5 (-1) | 1,561 (-10%) | 5mo | $285,000 | $183 | 56 |
| 2605 Mishawaka St | 0.63mi | 3/1.0 (-1) | 1,785 (+3%) | 4mo | $175,000 | $98 | 53 |
| 1201 S Twyckenham Dr | 0.53mi | 3/2.0 (-1) | 1,530 (-12%) | 4mo | $228,900 | $150 | 47 |
| 1706 Mckinley Ave | 0.72mi | 3/1.5 (-1) | 1,970 (+14%) | 1mo | $325,000 | $165 | 36 |
Match score weights: distance 35% · size 25% · config 20% · recency 20%. Top-matched comps best support the ARV.
Projected returns pro-forma
-3.0% appreciation · 6.27% rent growth · sell at horizon
- IRR
- -22.2%
- Equity multiple
- 0.22×
- Total profit
- $-57,086
- Equity at exit
- $38,752
- IRR
- -10.1%
- Equity multiple
- 0.30×
- Total profit
- $-50,698
- Equity at exit
- $22,471
Cash invested: $72,772 (down + closing). Projections, not guarantees.
Landlord ↔ Tenant lean methodology
- Overall (STATE)
- 90 Strongly Landlord-Friendly
- State Indiana
- 90 Strongly Landlord-Friendly · R+11
- County
- — inherits STATE
- City
- — inherits STATE
ZIP-level market 46615
- Home prices YoY
- -34.0%
- Rents YoY
- 6.3%
- Active inventory
- 76
- Price-to-rent
- 12.4×
Monthly cashflow live
- Estimated rent
- $1,743 high interval (Pro) →
- Mortgage (P&I)
- −$1,363
- Tax from tax record
- −$234 /mo · $2,804/yr
- Insurance
- −$108
- HOA
- −$0
- Vacancy / Maint / Mgmt
- −$366
- Net cashflow
- $-328
Break-even live
Sensitivity live
| Price | -10% $-180 | -5% $-254 | +0% $-328 | +5% $-401 | +10% $-475 |
|---|---|---|---|---|---|
| Rent | -10% $-465 | -5% $-396 | +0% $-328 | +5% $-259 | +10% $-190 |
| Rate | -1.0pp $-197 | -0.5pp $-262 | base $-328 | +0.5pp $-395 | +1.0pp $-463 |
UW: 25.0% down · 7.5% · 30yr · 1.5% tax · 5.0% vac · 8.0% maint · 8.0% mgmt
Financing live
Cash to close
- Down payment
- $64,975
- Closing costs
- $7,797
- Reserves months
- —
- Total cash needed
- —
Loan-product check · same deal, 3 products live
Conventional
25% down · 7.5% · 30yr
- Down + closing
- —
- Monthly P&I
- —
- Monthly cashflow
- —
- DSCR
- —
- Eligible?
- —
Personal DTI + credit; lowest rate.
DSCR
20% down · 8.5% · 30yr
- Down + closing
- —
- Monthly P&I
- —
- Monthly cashflow
- —
- DSCR
- —
- Eligible?
- —
No personal income docs; deal must DSCR.
Hard money
10% down · 12.0% · 12mo
- Down + closing
- —
- Monthly P&I
- —
- Monthly cashflow
- —
- DSCR
- —
- Eligible?
- —
Short-term bridge; refi at stabilization.
Rent comps 11 comps
| Address | Beds | Baths | Sqft | Rent | $/sqft | DOM | Units | Dist |
|---|---|---|---|---|---|---|---|---|
| 819 S 24th St South Bend, IN | 3.0 | 2.0 | 1480 | $1,795 | $1.21 | 45d | 1 | 0.46mi |
| 1106 S 20th St South Bend, IN | 1.0–3.0 | 1.0–2.0 | 885 | $1,200 | $1.36 | 15d | 1 | 0.51mi |
| 1126 E Broadway St South Bend, IN | 4.0 | 2.0 | 1492 | $1,365 | $0.91 | 22d | 1 | 0.95mi |
| 913 E Washington St South Bend, IN | 4.0 | 1.5 | 1312 | $1,295 | $0.99 | 22d | 1 | 0.98mi |
| 1149 E Indiana Ave South Bend, IN | 4.0 | 2.0 | 1344 | $1,200 | $0.89 | 15d | 1 | 1.00mi |
| 116 N Notre Dame Ave South Bend, IN | 3.0 | 1.5 | 1524 | $1,295 | $0.85 | 15d | 1 | 1.01mi |
| 724 Northwood Dr South Bend, IN | 4.0 | 2.0 | 1594 | $2,600 | $1.63 | 45d | 1 | 1.07mi |
| 931 S 34th St South Bend, IN | 3.0 | 1.5 | 1656 | $1,550 | $0.94 | 45d | 1 | 1.12mi |
| 1912 Miami St Unit 1912 South Bend, IN | 3.0 | 1.5 | 1300 | $1,400 | $1.08 | 45d | 1 | 1.29mi |
| 1824 Peachtree Ln South Bend, IN | 3.0 | 1.5 | 1852 | $2,700 | $1.46 | 22d | 1 | 1.46mi |
| 300 E Lasalle Ave South Bend, IN | 3.0 | 1.0–3.0 | 1013 | $3,009 | $2.97 | 15d | 31 | 1.48mi |
Listing history 8 events
-
2026-06-22days on market $259,900 Active 10 DOM
-
2026-06-18days on market $259,900 Active 7 DOM
-
2026-06-17days on market $259,900 Active 6 DOM
-
2026-06-16days on market $259,900 Active 5 DOM
-
2026-06-15days on market $259,900 Active 4 DOM
-
2026-06-14days on market $259,900 Active 2 DOM
-
2026-06-13remarks 671-char remark
-
2026-06-13$259,900 Active 1 DOM
ⓘ Source: listings_history table (triggers on properties + properties_extension) + one-shot
backfill from property_details.listing_events for pre-trigger history.
Tax reassessment forecast IN · Partial reset (capped growth)
- Current annual tax
- $2,804 · $234/mo
- Projected year-2 tax
- $2,804 · $234/mo
- Expected delta
- $0/yr ($0/mo · 0.0%)
ⓘ Screening estimate from a state-policy table — verify with the county assessor before closing.
Climate risk First Street
- Flood 1/10 Low FEMA zone X (unshaded) · 0% chance over 30 yrs
- Wildfire 1/10 Low
- Heat 3/10 Moderate 7 d/yr ≥99°F today · 16 d/yr by 30 yrs out
- Wind 2/10 Low
- Air quality 3/10 Moderate 2 unhealthy d/yr today · 3 by 30 yrs out
Nearby sold comps map
Loading sold comps map…
Walkable amenities ~0.75 mi
Loading nearby amenities…
Taxation est. · year 1
- Rental income
- $20,921
- − Mortgage interest
- −$14,558
- − Property taxes
- −$2,804
- − Insurance
- −$1,300
- − Repairs & maintenance
- −$1,674
- − Management
- −$1,674
- − Depreciation
- −$7,561
- Taxable loss
- −$8,649
- Est. tax savings @ 24.0%
- +$2,076
- After-tax cash flow
- $-1,855/yr
For passive investors: Depreciation is non-cash, so a rental often shows a tax loss while cash-flowing — sheltering income. Rental losses are passive: they offset passive income freely, and up to $25,000/yr can offset ordinary (W-2) income if you actively participate and your MAGI is under $100k (phasing out to $0 by $150k); unused losses carry forward. On sale, claimed depreciation is recaptured at up to 25%, and gains may owe capital-gains tax (a 1031 exchange can defer both). Figures are a year-1 estimate at your 24.0% rate — not tax advice; consult a CPA.
Schools (NCES district)
- District
- South Bend Community School Corporation
- NCES district ID
- 1810290
- Math proficiency
- 12% ▼ -10.00%
- Reading proficiency
- 21% ▼ -6.00%
- Median HH income
- $41,935
- Composite
- 14.21/100
- National rank
- #9452
- State rank
- #284 of 301 in IN
Livability — South Bend
- Score
- 64/100
- State rank
- #365
- US rank
- #13730
Category grades
Schools grade is shown separately in the Schools card above.
Census & demographics
- Census place
- South Bend, IN
- County
- Saint Joseph County · 189,048 people
- City population
- 99,767
- Metro
- South Bend-Mishawaka, IN-MI
- Population (ZIP)
- 14,190
- Household income
- $62,964
- Rent vs Own
- Severe rent burden
- 420.0
Population outlook (St. Joseph County) Hauer SSP2
- Today (2025)
- 273,186 people
- By 2030
- 273,594 · +0.1%
- By 2040
- 271,641 · -0.6%
- By 2050
- 269,187 · -1.5%
- By 2075
- 263,136 · -3.7%
- By 2100
- 245,659 · -10.1%
Race, ethnicity, and origin ACS 2023
- Neighborhood character
- Predominantly White (65%)
- Race & ethnicity
- White 65% Black 14% Two or more races 11% Hispanic / Latino 10% Asian 3%
- Hispanic origin (detail)
- Mexican 8%
- Common ancestry
- Romanian 6% Italian 2% Serbian 2%
- Foreign-born
- 8% · Canada, Vietnam
- Languages at home
- 87% English-only · Spanish 7% Tagalog/Filipino 1% Other Indo-European 1%
Political lean MEDSL · St. Joseph
- 2024 margin
- Toss-up / Even · D 50.0% · R 48.5% · Other 1.5%
- 2008→2024 swing
- -15.6pp toward R · 2008: 17.1pp · 2024: 1.5pp
- All cycles
- 2024: D+1.5 2020: D+5.8 2016: D+0.2 2012: D+3.5 2008: D+17.1
Not yet ingested
- Civics
- —
Market trends
- HPI YoY
- ▼ -124.82%
- Current HPI
- 242.1938
- Rent YoY
- ▲ 6.27%
- Metro
- South Bend-Mishawaka, IN-MI
- State GDP YoY
- ▲ 2.90%
- F500 in state
- 18
Industry mix (Fortune 500 HQ in IN)
| Industry | F500 HQs | Revenue |
|---|---|---|
| Industrial Machinery | 2 | $37B |
|
||
| Healthcare | 1 | $177B |
|
||
| Pharmaceuticals | 1 | $45B |
|
||
| Metals / Steel | 1 | $18B |
|
||
| Agriculture | 1 | $17B |
|
||
| Packaging | 1 | $12B |
|
||
Price history
1 event — show timeline
- 2026-06-11 Listed $259,900 IRMLS
Property tax history
-0.8%/yrLatest (2025): $2,804 · +4.7% YoY. Source: county tax records.
Cash-flow waterfall
monthlySold comps — $/sqft
last 12 mo · ≤1 miLoading sold comps…