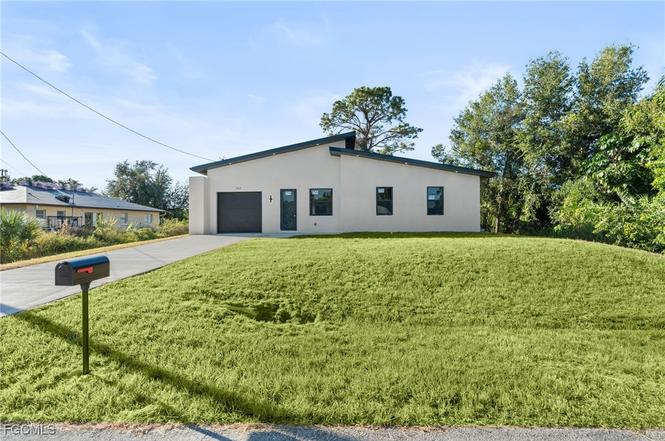
2603 3rd St SW · Lehigh Acres, FL
Flood risk 1/10 · Minimal
- FEMA flood zone
- X (unshaded)
- Chance of flooding over 30 yrs
- 0.0%
- Est. flood insurance / yr
- $507 – $1,088
Fire risk 1/10 · Minimal
- Est. fire insurance / yr
- $947 – $1,759
Heat risk 10/10 · Severe
- Hot days now (above 107°F)
- 7 days/yr
- Hot days in 30 yrs
- 28 days/yr
Wind risk 10/10 · Severe
- Chance of severe wind over 30 yrs
- 99.0%
Air-quality risk 2/10 · Minimal
- Unhealthy air days now
- 1 days/yr
- Unhealthy air days in 30 yrs
- 1 days/yr
Risk factors via First Street. Map © Google.
Why this score? — see what drove the D grade
The composite is a weighted blend of 9 inputs, each scored 0–100. Each bar is that input's sub-score; the figure is the points it added to the 100-point composite (weight × sub-score).
- Appreciation +10.0/10.0
- Cash flow +8.9/30.0
- ARV discount +7.5/15.0
- Schools +4.1/10.0
- Livability +3.0/5.0
- Condition / age +2.5/5.0
- DSCR +2.4/10.0
- Rent growth +2.1/5.0
- 1% rule +1.5/10.0
$289,999
🖨 Deal sheet 📄 Offer letter ✓ Due diligence
Listing remarks MLS
Great location in the desirable SW area of Lehigh Acres. This property is situated in an area with rapid growth and a lot of new construction. Build your dream home or invest in this great piece of property! Close to Lee Blvd. and close to restaurants, schools, and Walmart. Fast and easy access to state road 82. This lot is very clean.
Key facts
- Impact doors
- Large backyard
- Open concept layout
Tags
Property features AI
Finance
- Financial info: Pets allowed
- HOA & community: No association fee
Exterior
- Parking: Attached garage with garage door opener; Driveway; Paved parking; 1 covered/garage space
- Security: High impact/security doors
- Utilities: Septic tank; Well water; Cable not available
- Home design: Single-story home; New construction; Faces West; Exposed to the East
- Construction: Built with block, concrete and stucco; Shingle roof; New construction
- Exterior features: Security/high impact doors; Paved road
Interior
- Kitchen: Dishwasher; Freezer; Disposal; Microwave; Refrigerator
- Bedrooms: Other (room type listed as Other)
- Flooring: Tile
- Bathrooms: 3 full bathrooms
- Heating & cooling: Central heating (electric); Central air conditioning; Ceiling fans; Electric cooling
- Interior features: Living/dining room; Split bedrooms; Separate shower; Shower only; Multiple shower heads; Other
Neighborhood map
What this means for you Summary
Snapshot
- This is a 3-bed/3.0-bath land listed at $290k.
Deal economics
- At list price, monthly cash flow is $-236 ($-3k/yr) — negative.
- To cash-flow at today's rent, offer at most $248k (14.4% below list).
- To meet the 1% rule (rent ≥ 1% of price), the offer needs to be $187k (35.5% below list).
- Recommended offer: $187k (35.5% below list) — sets the bar for 1% rule.
Location & tenants
- Location reads 59/100 on livability (#826 in FL) — a working-class tenant base; expect higher turnover. Strengths: cost of living A+, housing A+; Watch: crime C-, employment D+, schools D-.
- Lee (suburban): math 47% / reading 50% proficiency, ranked #42 of 73 in FL (top 58%) — families likely to look elsewhere, expect single-tenant / working-renter base with shorter leases.
- Market conditions: Rents soft (-1.5%/yr); 786 active listings in the ZIP; 40 comparable units currently listed for rent nearby; rentals at typical pace (median 24d on market — plan ~3-4 weeks tenant-placement turnaround); 15,411 units permitted in Lee County in 2024 (4,686 in 5+ unit buildings).
- This rent runs 31% of the median local income ($73k/yr) — at the standard rent-burdened threshold; future hikes will face affordability resistance.
Forward outlook
- In year one you build about $31k of equity ($2k loan paydown + $29k appreciation (10.0% local appreciation)).
- Lee County population projected at +44% by 2050 — long-run rental-demand tailwind backs the buy-and-hold thesis.
- By year 2, paydown + projected appreciation supports a ~$50k cash-out refi (75% LTV) — recoverable capital for the next deal without selling this one.
Negotiation context
- It's been on market 117 days — a 9% lower offer ($264k) is reasonable based on typical stale-listing flexibility.
- 5 sale attempts since 3y ago; this cycle's ask is 14400% above the opening price — seller raised mid-cycle; expect resistance to lowballs.
- Current owner paid $23k; list at $290k implies a 1161% gain — meaningful room to come down on a strong offer.
Risks & watch-outs
- Climate carrying-cost: severe wind risk, 99% chance of damaging wind over 30y; extreme-heat days projected 7→28/yr by 2055 (HVAC capex compounding) — expect insurance premiums to compound above CPI over the hold.
Questions for the listing agent
- What do current leases actually rent for vs. the listed asking? Can we see a recent rent roll and the last 12 months of T-12 income?
- It's been on market 117 days. Have you received any prior offers? Is the seller open to a 35% concession, seller financing, or rate buy-down credit?
- Why hasn't it sold? Are there any deal-killer items the seller is aware of (foundation, flood, title, zoning, code violations)?
- Is there a deadline driving the sale (1031 exchange, divorce, estate, relocation)? That informs how much negotiation room exists.
- Schools are D-rated, which usually means shorter tenancies and higher turnover. Who's the typical renter profile here, and what's been the actual vacancy rate?
- The area grade is low — what's the realistic commute time and amenity access for the typical tenant pool here? Any planned neighborhood developments (good or bad) we should know about?
- What's the average days-on-market for RENTAL listings here right now (not sales)? A rising rental-DOM trend means longer vacancies and softer asking-rent achievability than the comps imply.
- What's the recent tenant-quality profile in this submarket — average credit score on applications, eviction rate, late-payment / NSF rate, and stable-employment percentage? A property-management company in the area should have these aggregated.
- How much new for-sale + rental construction is in the pipeline within 1–3 miles? Heavy new supply typically softens prices + rents 12–24 months out; constrained supply supports both.
Investment metrics
- 1% rule
- 0.65% ✗
- Cap rate
- 5.32%
- Cash-on-cash
- -3.49%
- DSCR
- 0.84
- GRM
- 12.9
CMA / ARV
No comps found within radius.
Projected returns pro-forma
10.0% appreciation · 0.0% rent growth · sell at horizon
- IRR
- 21.0%
- Equity multiple
- 2.69×
- Total profit
- $137,289
- Equity at exit
- $261,254
- IRR
- 18.5%
- Equity multiple
- 6.00×
- Total profit
- $405,989
- Equity at exit
- $563,404
Cash invested: $81,200 (down + closing). Projections, not guarantees.
Landlord ↔ Tenant lean methodology
- Overall (STATE)
- 87 Strongly Landlord-Friendly
- State Florida
- 87 Strongly Landlord-Friendly · R+3
- County
- — inherits STATE
- City
- — inherits STATE
ZIP-level market 33976
- Home prices YoY
- 6.8%
- Rents YoY
- -1.5%
- Active inventory
- 786
- Price-to-rent
- 12.9×
Monthly cashflow live
- Estimated rent
- $1,871 high interval (Pro) →
- Mortgage (P&I)
- −$1,521
- Tax from tax record
- −$72 /mo · $865/yr
- Insurance
- −$121
- HOA
- −$0
- Vacancy / Maint / Mgmt
- −$393
- Net cashflow
- $-236
Break-even live
UW: 25.0% down · 7.5% · 30yr · 1.5% tax · 5.0% vac · 8.0% maint · 8.0% mgmt
Financing live
Cash to close
- Down payment
- $72,500
- Closing costs
- $8,700
- Reserves months
- —
- Total cash needed
- —
Loan-product check · same deal, 3 products live
Conventional
25% down · 7.5% · 30yr
- Down + closing
- —
- Monthly P&I
- —
- Monthly cashflow
- —
- DSCR
- —
- Eligible?
- —
Personal DTI + credit; lowest rate.
DSCR
20% down · 8.5% · 30yr
- Down + closing
- —
- Monthly P&I
- —
- Monthly cashflow
- —
- DSCR
- —
- Eligible?
- —
No personal income docs; deal must DSCR.
Hard money
10% down · 12.0% · 12mo
- Down + closing
- —
- Monthly P&I
- —
- Monthly cashflow
- —
- DSCR
- —
- Eligible?
- —
Short-term bridge; refi at stabilization.
Rent comps 40 comps
| Address | Beds | Baths | Sqft | Rent | $/sqft | DOM | Units | Dist |
|---|---|---|---|---|---|---|---|---|
| 1507 Markdale St E Lehigh Acres, FL | 2.0 | 1.0 | 997 | $1,300 | $1.30 | 3d | 1 | 0.29mi |
| 209 Punta Alta Ct Lehigh Acres, FL | 4.0 | 2.0 | 1860 | $1,950 | $1.05 | 19d | 1 | 0.34mi |
| 312 Grovewood Ave S Lehigh Acres, FL | 2.0 | 2.0 | 1325 | $1,800 | $1.36 | 24d | 1 | 0.38mi |
| 2812 4th St SW Lehigh Acres, FL | 3.0 | 2.0 | 1751 | $1,856 | $1.06 | 24d | 1 | 0.48mi |
| 1407 Juddale St E Lehigh Acres, FL | 2.0 | 1.0 | 997 | $1,450 | $1.45 | 3d | 1 | 0.55mi |
| 1405 Juddale St E Lehigh Acres, FL | 2.0 | 2.0 | 1302 | $1,400 | $1.08 | 24d | 1 | 0.57mi |
| 219 Beth Stacey Blvd Lehigh Acres, FL | 2.0 | 2.0 | 997 | $1,300 | $1.30 | 21d | 1 | 0.58mi |
| 111 Yellowtail Loop #3 Lehigh Acres, FL | 2.0 | 2.0 | 1100 | $1,750 | $1.59 | 24d | 1 | 0.61mi |
| 2916 7th St SW Lehigh Acres, FL | 3.0 | 2.0 | 1357 | $1,900 | $1.40 | 24d | 1 | 0.70mi |
| 2612 7th St W Lehigh Acres, FL | 3.0 | 2.0 | 1492 | $2,295 | $1.54 | 24d | 1 | 0.72mi |
| 1423 Caywood Cir S Lehigh Acres, FL | 2.0 | 2.0 | 960 | $1,376 | $1.43 | 3d | 1 | 0.75mi |
| 28 Cosmopolitan Dr #13 Lehigh Acres, FL | 2.0 | 2.0 | 973 | $1,375 | $1.41 | 14d | 1 | 0.84mi |
| 2906 14th St SW Lehigh Acres, FL | 3.0 | 2.0 | 1563 | $2,450 | $1.57 | 24d | 1 | 0.89mi |
| 8350 Tortoise Isle Ct Lehigh Acres, FL | 3.0 | 2.0 | 1478 | $1,595 | $1.08 | 3d | 1 | 0.90mi |
| 8046 Gopher Tortoise Trl Lehigh Acres, FL | 4.0 | 2.0 | 1828 | $2,300 | $1.26 | 24d | 1 | 0.90mi |
| 2902 7th St W Lehigh Acres, FL | 3.0 | 2.0 | 1841 | $2,085 | $1.13 | 2d | 1 | 0.92mi |
| 2902 7th St W Lehigh Acres, FL | 3.0 | 2.0 | 1841 | $2,215 | $1.20 | 14d | 1 | 0.92mi |
| 10 Beth Stacey Blvd #206 Lehigh Acres, FL | 2.0 | 2.0 | 1012 | $1,100 | $1.09 | 3d | 1 | 0.93mi |
| 2909 15th St SW Lehigh Acres, FL | 3.0 | 2.0 | 1291 | $1,800 | $1.39 | 21d | 1 | 0.97mi |
| 59 Camelot Gardens Blvd #110 Lehigh Acres, FL | 2.0 | 2.0 | 1166 | $1,800 | $1.54 | 24d | 1 | 0.99mi |
| 8187 Gopher Tortoise Trl Lehigh Acres, FL | 3.0 | 2.0 | 1555 | $2,000 | $1.29 | 24d | 1 | 1.05mi |
| 2916 9th St W Lehigh Acres, FL | 3.0 | 2.0 | 1053 | $1,750 | $1.66 | 24d | 1 | 1.08mi |
| 9099 Aegean Cir Lehigh Acres, FL | 2.0 | 2.0 | 1120 | $1,499 | $1.34 | 24d | 1 | 1.09mi |
| 3103 11th St SW Lehigh Acres, FL | 3.0 | 2.0 | 1212 | $1,800 | $1.49 | 24d | 1 | 1.09mi |
| 2805 20th St SW Lehigh Acres, FL | 3.0 | 2.0 | 1151 | $1,699 | $1.48 | 3d | 1 | 1.10mi |
| 9123 Aegean Cir Lehigh Acres, FL | 2.0 | 2.0 | 1120 | $1,474 | $1.32 | 3d | 1 | 1.12mi |
| 9112 Aegean Cir Lehigh Acres, FL | 3.0 | 2.0 | 1409 | $1,600 | $1.14 | 3d | 1 | 1.13mi |
| 9131 Aegean Cir Lehigh Acres, FL | 3.0 | 2.0 | 1400 | $1,574 | $1.12 | 24d | 1 | 1.13mi |
| 9131 Aegean Cir Lehigh Acres, FL | 3.0 | 2.0 | 1400 | $1,574 | $1.12 | 21d | 1 | 1.13mi |
| 1120 Vineyard St Lehigh Acres, FL | 2.0 | 1.0 | 1028 | $1,300 | $1.26 | 24d | 1 | 1.14mi |
| 9137 Aegean Cir Lehigh Acres, FL | 2.0 | 2.0 | 1120 | $1,474 | $1.32 | 24d | 1 | 1.14mi |
| 9137 Aegean Cir Lehigh Acres, FL | 2.0 | 2.0 | 1120 | $1,474 | $1.32 | 3d | 1 | 1.14mi |
| 1113 Vineyard St Lehigh Acres, FL | 3.0 | 2.0 | 1004 | $1,500 | $1.49 | 24d | 1 | 1.15mi |
| 18303 Gibraltar Ln Lehigh Acres, FL | 4.0 | 2.0 | 1203 | $1,549 | $1.29 | 14d | 1 | 1.19mi |
| 18303 Gibraltar Ln Lehigh Acres, FL | 4.0 | 2.0 | 1203 | $1,599 | $1.33 | 24d | 1 | 1.19mi |
| 9161 Aegean Cir Lehigh Acres, FL | 2.0 | 2.0 | 1120 | $1,650 | $1.47 | 14d | 1 | 1.20mi |
| 18266 Minorea Ln Lehigh Acres, FL | 3.0 | 2.0 | 1408 | $1,650 | $1.17 | 24d | 1 | 1.20mi |
| 3109 8th St SW Lehigh Acres, FL | 3.0 | 2.0 | 1324 | $1,845 | $1.39 | 21d | 1 | 1.21mi |
| 18321 Gibraltar Ln Lehigh Acres, FL | 4.0 | 2.0 | 1203 | $1,675 | $1.39 | 24d | 1 | 1.21mi |
| 18261 Minorea Ln Lehigh Acres, FL | 2.0 | 2.0 | 1402 | $1,595 | $1.14 | 3d | 1 | 1.22mi |
Listing history 17 events
-
2026-05-17status Pending
-
2026-04-29$2,000
-
2026-04-28historical $2,000
-
2026-04-15price $2,000
-
2026-03-08price $289,999
-
2026-02-16$2,250
-
2026-02-13price $279,999
-
2026-01-19$299,999 Active
-
2025-12-17historical
-
2025-10-05price $309,000
-
2025-07-14price $314,000
-
2025-06-17$329,995 Active
-
2023-07-27soldstatus $23,000
-
2023-07-10status Pending 337-char remark
Show marketing remark (337 chars)
Great location in the desirable SW area of Lehigh Acres. This property is situated in an area with rapid growth and a lot of new construction. Build your dream home or invest in this great piece of property! Close to Lee Blvd. and close to restaurants, schools, and Walmart. Fast and easy access to state road 82. This lot is very clean.
-
2023-07-10soldstatus $23,000 Closed 337-char remark
Show marketing remark (337 chars)
Great location in the desirable SW area of Lehigh Acres. This property is situated in an area with rapid growth and a lot of new construction. Build your dream home or invest in this great piece of property! Close to Lee Blvd. and close to restaurants, schools, and Walmart. Fast and easy access to state road 82. This lot is very clean.
-
2023-06-09$24,988 Active 337-char remark
Show marketing remark (337 chars)
Great location in the desirable SW area of Lehigh Acres. This property is situated in an area with rapid growth and a lot of new construction. Build your dream home or invest in this great piece of property! Close to Lee Blvd. and close to restaurants, schools, and Walmart. Fast and easy access to state road 82. This lot is very clean.
-
2023-06-08soldstatus $17,500
ⓘ Source: listings_history table (triggers on properties + properties_extension) + one-shot
backfill from property_details.listing_events for pre-trigger history.
Tax reassessment forecast FL · Resets to sale price
- Current annual tax
- $865 · $72/mo
- Projected year-2 tax
- $2,407 · $201/mo
- Expected delta
- +$1,542/yr (+$129/mo · 178.3%)
ⓘ Screening estimate from a state-policy table — verify with the county assessor before closing.
Climate risk First Street
- Flood 1/10 Low FEMA zone X (unshaded) · 0% chance over 30 yrs
- Wildfire 1/10 Low
- Heat 10/10 Extreme 7 d/yr ≥107°F today · 28 d/yr by 30 yrs out
- Wind 10/10 Extreme 99% chance of damaging wind over 30 yrs
- Air quality 2/10 Low 1 unhealthy d/yr today · 1 by 30 yrs out
Nearby sold comps map
Loading sold comps map…
Walkable amenities ~0.75 mi
Loading nearby amenities…
Taxation est. · year 1
- Rental income
- $22,448
- − Mortgage interest
- −$16,244
- − Property taxes
- −$865
- − Insurance
- −$1,450
- − Repairs & maintenance
- −$1,796
- − Management
- −$1,796
- − Depreciation
- −$8,436
- Taxable loss
- −$8,139
- Est. tax savings @ 24.0%
- +$1,953
- After-tax cash flow
- $-877/yr
For passive investors: Depreciation is non-cash, so a rental often shows a tax loss while cash-flowing — sheltering income. Rental losses are passive: they offset passive income freely, and up to $25,000/yr can offset ordinary (W-2) income if you actively participate and your MAGI is under $100k (phasing out to $0 by $150k); unused losses carry forward. On sale, claimed depreciation is recaptured at up to 25%, and gains may owe capital-gains tax (a 1031 exchange can defer both). Figures are a year-1 estimate at your 24.0% rate — not tax advice; consult a CPA.
Schools (NCES district)
- District
- Lee
- NCES district ID
- 1201080
- Math proficiency
- 47% ▼ -11.00%
- Reading proficiency
- 50% ▼ -4.00%
- Median HH income
- $49,518
- Composite
- 41.49/100
- National rank
- #3458
- State rank
- #42 of 73 in FL
Livability — Lehigh Acres
- Score
- 59/100
- State rank
- #826
- US rank
- #20055
Category grades
Schools grade is shown separately in the Schools card above.
Census & demographics
- Census place
- Lehigh Acres, FL
- County
- Lee County · 788,662 people
- City population
- 130,638
- Metro
- Cape Coral-Fort Myers, FL
- Population (ZIP)
- 20,277
- Household income
- $72,679
- Rent vs Own
- Severe rent burden
- 574.0
Population outlook (Lee County) Hauer SSP2
- Today (2025)
- 871,946 people
- By 2030
- 955,468 · +9.6%
- By 2040
- 1,113,587 · +27.7%
- By 2050
- 1,256,891 · +44.1%
- By 2075
- 1,560,270 · +78.9%
- By 2100
- 1,726,848 · +98.0%
Race, ethnicity, and origin ACS 2023
- Neighborhood character
- Diverse neighborhood (Simpson 0.65)
- Race & ethnicity
- Hispanic / Latino 50% Two or more races 30% White 24% Black 20% Asian 3%
- Hispanic origin (detail)
- Mexican 8% Puerto Rican 8% Cuban 18% Dominican 4%
- Common ancestry
- Hispanic 8% Slovak 1% Lithuanian 1%
- Foreign-born
- 35% · Canada, Jamaica, Vietnam
- Languages at home
- 46% English-only · Spanish 43% French/Haitian/Cajun 8% Vietnamese 1%
Political lean MEDSL · Lee
- 2024 margin
- Strong R (+28.4) · D 35.5% · R 63.9%
- 2008→2024 swing
- -18.0pp toward R · 2008: -10.4pp · 2024: -28.4pp
- All cycles
- 2024: R+28.4 2020: R+19.2 2016: R+20.4 2012: R+16.6 2008: R+10.4
Not yet ingested
- Civics
- —
Market trends
- HPI YoY
- ▲ 21.77%
- Current HPI
- 340.4255
- Rent YoY
- ▼ -1.54%
- Metro
- Cape Coral-Fort Myers, FL
- State GDP YoY
- ▲ 3.28%
- F500 in state
- 36
Industry mix (Fortune 500 HQ in FL)
| Industry | F500 HQs | Revenue |
|---|---|---|
| Industrial Technology | 2 | $29B |
|
||
| Insurance | 2 | $17B |
|
||
| Retail | 1 | $60B |
|
||
| Technology Distribution | 1 | $58B |
|
||
| Homebuilding | 1 | $35B |
|
||
| Technology Manufacturing | 1 | $35B |
|
||
Price history
-88.6% since first listed17 events — show timeline
- 2026-05-17 Pending — FORTMLS
- 2026-04-29 Listed for Rent $2,000 TURBOTENANT
- 2026-04-28 Rental Removed $2,000 TURBOTENANT
- 2026-04-15 Price Changed $2,000 TURBOTENANT
- 2026-03-08 Price Changed $289,999 FORTMLS
- 2026-02-16 Listed for Rent $2,250 TURBOTENANT
- 2026-02-13 Price Changed $279,999 FORTMLS
- 2026-01-19 Listed $299,999 FORTMLS
- 2025-12-17 Listing Removed — FORTMLS
- 2025-10-05 Price Changed $309,000 FORTMLS
- 2025-07-14 Price Changed $314,000 FORTMLS
- 2025-06-17 Listed $329,995 FORTMLS
- 2023-07-27 Sold (Public Records) $23,000 Public Records
- 2023-07-10 Pending — FORTMLS
- 2023-07-10 Sold (MLS) $23,000 FORTMLS
- 2023-06-09 Listed $24,988 FORTMLS
- 2023-06-08 Sold (Public Records) $17,500 Public Records
Property tax history
+25.7%/yrLatest (2025): $865 · +93.8% YoY. Source: county tax records.
Cash-flow waterfall
monthlySold comps — $/sqft
last 12 mo · ≤1 miLoading sold comps…