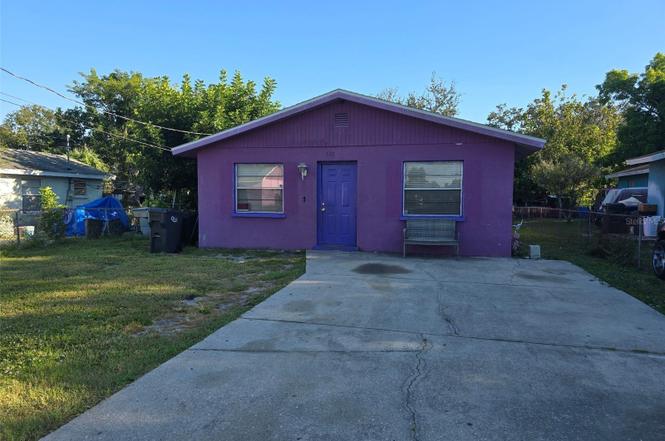
503 25th St E · Memphis, FL
Flood risk 1/10 · Minimal
- FEMA flood zone
- X (unshaded)
- Chance of flooding over 30 yrs
- 0.0%
- Est. flood insurance / yr
- $507 – $1,088
Fire risk 1/10 · Minimal
- Est. fire insurance / yr
- $947 – $1,759
Heat risk 10/10 · Severe
- Hot days now (above 107°F)
- 7 days/yr
- Hot days in 30 yrs
- 30 days/yr
Wind risk 10/10 · Severe
- Chance of severe wind over 30 yrs
- 99.0%
Air-quality risk 3/10 · Minor
- Unhealthy air days now
- 2 days/yr
- Unhealthy air days in 30 yrs
- 2 days/yr
Risk factors via First Street. Map © Google.
Why this score? — see what drove the C grade
The composite is a weighted blend of 9 inputs, each scored 0–100. Each bar is that input's sub-score; the figure is the points it added to the 100-point composite (weight × sub-score).
- Cash flow +19.1/30.0
- ARV discount +15.0/15.0
- DSCR +6.0/10.0
- 1% rule +4.6/10.0
- Schools +4.4/10.0
- Livability +3.2/5.0
- Condition / age +2.5/5.0
- Rent growth +1.8/5.0
- Appreciation +0.0/10.0
$198,000
🖨 Deal sheet (PDF) 📄 Offer letter ✓ Due diligence
Listing remarks
Calling all investors and renovators! This 2-bedroom, 1-bathroom property is the perfect opportunity to add value with your personal touch. Whether you're looking to flip, rent, or create your next income producing asset, this home offers great bones and solid potential. Situated in a growing area, the property features a functional layout and a sizable lot ideal for future upgrades or expansion. With some TLC, this fixer-upper could easily be transformed into a charming residence or profitable rental. Don't miss out on this affordable investment opportunity, properties with this much potential are hard to come
Key facts
- Functional layout
- Sizable lot
- 5,184 sq ft lot
Tags
Property features AI
Finance
- Other: Lot approximately 0.12 acres (48 x 108, paved road); Living/building area reported as 950 square feet
- Financial info: No additional financial details reported
- HOA & community: No HOA reported
Exterior
- Parking: No parking details reported
- Security: No security features reported
- Utilities: Public water; Public sewer; Electricity available and connected; Water available and connected
- Home design: Single-family residence; One story; Wests-facing
- Construction: Brick construction; Shingle roof; Block foundation; Built on one level
- Exterior features: Other exterior features
Interior
- Kitchen: No appliances reported
- Bedrooms: 2 bedrooms
- Flooring: Tile flooring
- Bathrooms: 1 full bathroom
- Heating & cooling: Central heating; Central air conditioning
- Interior features: No notable built-in interior features reported
- Laundry & utility: Laundry room
Neighborhood map
What this means for you Summary
Snapshot
- This is a 2-bed/1.0-bath single-family listed at $198k.
Deal economics
- At list price, monthly cash flow is $211 ($3k/yr) — positive.
- The deal already cash-flows at list — no discount required.
- To meet the 1% rule (rent ≥ 1% of price), the offer needs to be $190k (3.8% below list).
- Recommended offer: $174k (12.0% below list) — sets the bar for market timing.
- Cap rate 7.6% vs local median 4.5% in Memphis — top-decile yield for the area; either an underpriced asset or a hidden risk that comps aren't pricing in. Stress-test before assuming the spread holds.
Location & tenants
- Location reads 63/100 on livability (#745 in FL) — a middle-class / working-renter tenant base. Strengths: cost of living A+, housing A+; Watch: employment D+, schools F, amenities F.
- Manatee (suburban): math 54% / reading 50% proficiency, ranked #26 of 73 in FL (top 36%) — acceptable for families but not a draw, mixed tenant base, ~2y average lease.
- Market conditions: Rents soft (-3.0%/yr); 1160 active listings in the ZIP; 16 comparable units currently listed for rent nearby; rentals at typical pace (median 25d on market — plan ~3-4 weeks tenant-placement turnaround); solid renter incomes; 7,472 units permitted in Manatee County in 2024 (1,782 in 5+ unit buildings).
Forward outlook
- Local home prices are declining (-3.0%/yr); year-one equity from $1k of loan paydown is wiped out by about $6k of value loss. Plan a longer hold.
- Manatee County population projected at +43% by 2050 — long-run rental-demand tailwind backs the buy-and-hold thesis.
Negotiation context
- It's been on market 266 days — a 12% lower offer ($174k) is reasonable based on typical stale-listing flexibility.
- Current owner paid $10k; list at $198k implies a 1880% gain — meaningful room to come down on a strong offer.
Risks & watch-outs
- Climate carrying-cost: severe wind risk, 99% chance of damaging wind over 30y; extreme-heat days projected 7→30/yr by 2055 (HVAC capex compounding) — expect insurance premiums to compound above CPI over the hold.
Questions for the listing agent
- It's been on market 266 days. Have you received any prior offers? Is the seller open to a 12% concession, seller financing, or rate buy-down credit?
- Why hasn't it sold? Are there any deal-killer items the seller is aware of (foundation, flood, title, zoning, code violations)?
- Is there a deadline driving the sale (1031 exchange, divorce, estate, relocation)? That informs how much negotiation room exists.
- Schools are F-rated, which usually means shorter tenancies and higher turnover. Who's the typical renter profile here, and what's been the actual vacancy rate?
- What's the average days-on-market for RENTAL listings here right now (not sales)? A rising rental-DOM trend means longer vacancies and softer asking-rent achievability than the comps imply.
- What's the recent tenant-quality profile in this submarket — average credit score on applications, eviction rate, late-payment / NSF rate, and stable-employment percentage? A property-management company in the area should have these aggregated.
- How much new for-sale + rental construction is in the pipeline within 1–3 miles? Heavy new supply typically softens prices + rents 12–24 months out; constrained supply supports both.
Investment metrics
- 1% rule
- 0.96% ✗
- Cap rate
- 7.57%
- Cash-on-cash
- 4.56%
- DSCR
- 1.20
- GRM
- 8.7
CMA / ARV
- ARV (on-the-fly)
- $260,300
- Comps found
- 7
Show comp detail 7 sales within ~0.75 mi
| Address | Dist | Beds/Ba | Sqft | Sold | Price | $/sf | Match |
|---|---|---|---|---|---|---|---|
| 820 32nd St E | 0.56mi | 3/1.0 (+1) | 984 (+4%) | 14mo | $269,900 | $274 | 51 |
| 1108 26th Street Ct E | 0.42mi | 3/1.0 (+1) | 840 (-12%) | 14mo | $237,500 | $283 | 45 |
| 1111 26th Street Ct E | 0.42mi | 3/1.0 (+1) | 1,084 (+14%) | 14mo | $215,000 | $198 | 40 |
| 448 Kaiser Dr | 0.68mi | 2/1.0 | 1,018 (+7%) | 21mo | $107,500 | $106 | 39 |
| 2612 8th Ave E | 0.23mi | 3/2.0 (+1) | 1,085 (+14%) | 23mo | $360,000 | $332 | 38 |
| 2308 12th Ave E | 0.47mi | 3/2.0 (+1) | 1,053 (+11%) | 24mo | $288,000 | $274 | 31 |
| 311 Peace Mnr | 0.74mi | 2/2.0 | 1,056 (+11%) | 22mo | $88,000 | $83 | 25 |
Match score weights: distance 35% · size 25% · config 20% · recency 20%. Top-matched comps best support the ARV.
Projected returns pro-forma
-3.0% appreciation · 0.0% rent growth · sell at horizon
- IRR
- -12.5%
- Equity multiple
- 0.56×
- Total profit
- $-24,265
- Equity at exit
- $29,522
- IRR
- -8.5%
- Equity multiple
- 0.54×
- Total profit
- $-25,486
- Equity at exit
- $17,119
Cash invested: $55,440 (down + closing). Projections, not guarantees.
Landlord ↔ Tenant lean methodology
- Overall (STATE)
- 87 Strongly Landlord-Friendly
- State Florida
- 87 Strongly Landlord-Friendly · R+3
- County
- — inherits STATE
- City
- — inherits STATE
ZIP-level market 34221
- Rents YoY
- -3.0%
- Active inventory
- 1160
- Price-to-rent
- 8.7×
Monthly cashflow live
- Estimated rent
- $1,904 high interval (Pro) →
- Mortgage (P&I)
- −$1,038
- Tax from tax record
- −$173 /mo · $2,072/yr
- Insurance
- −$82
- HOA
- −$0
- Vacancy / Maint / Mgmt
- −$400
- Net cashflow
- $211
Break-even live
Sensitivity live
| Price | -10% $323 | -5% $267 | +0% $211 | +5% $155 | +10% $99 |
|---|---|---|---|---|---|
| Rent | -10% $60 | -5% $135 | +0% $211 | +5% $286 | +10% $361 |
| Rate | -1.0pp $310 | -0.5pp $261 | base $211 | +0.5pp $159 | +1.0pp $107 |
UW: 25.0% down · 7.5% · 30yr · 1.5% tax · 5.0% vac · 8.0% maint · 8.0% mgmt
Financing live
Cash to close
- Down payment
- $49,500
- Closing costs
- $5,940
- Reserves months
- —
- Total cash needed
- —
Loan-product check · same deal, 3 products live
Conventional
25% down · 7.5% · 30yr
- Down + closing
- —
- Monthly P&I
- —
- Monthly cashflow
- —
- DSCR
- —
- Eligible?
- —
Personal DTI + credit; lowest rate.
DSCR
20% down · 8.5% · 30yr
- Down + closing
- —
- Monthly P&I
- —
- Monthly cashflow
- —
- DSCR
- —
- Eligible?
- —
No personal income docs; deal must DSCR.
Hard money
10% down · 12.0% · 12mo
- Down + closing
- —
- Monthly P&I
- —
- Monthly cashflow
- —
- DSCR
- —
- Eligible?
- —
Short-term bridge; refi at stabilization.
Rent comps 16 comps
| Address | Beds | Baths | Sqft | Rent | $/sqft | DOM | Units | Dist |
|---|---|---|---|---|---|---|---|---|
| 307 27th St E Palmetto, FL | 2.0 | 2.0 | 980 | $2,000 | $2.04 | 24d | 1 | 0.13mi |
| 719 23rd St E Palmetto, FL | 3.0 | 2.0 | 1060 | $1,800 | $1.70 | 11d | 1 | 0.25mi |
| 900 21st St E Palmetto, FL | 2.0–3.0 | 1.0 | 800 | $1,495 | $1.87 | 24d | 1 | 0.33mi |
| 1809 5th Ave W Palmetto, FL | 3.0 | 1.0 | 962 | $1,895 | $1.97 | 24d | 1 | 0.63mi |
| 1607 18th St E Palmetto, FL | 3.0 | 1.0 | 916 | $1,950 | $2.13 | 24d | 1 | 0.89mi |
| 516 12th St W Unit A Palmetto, FL | 2.0 | 1.0 | 612 | $1,350 | $2.21 | 17d | 1 | 1.03mi |
| 518 12th St W Palmetto, FL | 2.0 | 1.0 | 612 | $1,350 | $2.21 | 17d | 1 | 1.03mi |
| 501 11th St W Palmetto, FL | 2.0 | 1.0 | 850 | $1,340 | $1.58 | 3d | 1 | 1.12mi |
| 709 45th St E Palmetto, FL | 2.0 | 2.0 | 1000 | $1,550 | $1.55 | 3d | 1 | 1.16mi |
| 515 45th St E Palmetto, FL | 2.0 | 2.0 | 900 | $2,100 | $2.33 | 24d | 1 | 1.20mi |
| 900 9th Ave E Unit 180 Palmetto, FL | 2.0 | 2.0 | 1000 | $1,650 | $1.65 | 17d | 1 | 1.32mi |
| 1229 11th Ave W Palmetto, FL | 3.0 | 1.0 | 1072 | $1,800 | $1.68 | 3d | 1 | 1.32mi |
| 1213 15th St W Palmetto, FL | 2.0 | 1.0 | 1000 | $1,800 | $1.80 | 24d | 1 | 1.33mi |
| 2225 14th Ave W Palmetto, FL | 2.0 | 2.0 | 1120 | $1,895 | $1.69 | 24d | 1 | 1.33mi |
| 2225 14th Ave W Unit 204 Palmetto, FL | 2.0 | 2.0 | 1120 | $1,795 | $1.60 | 24d | 1 | 1.33mi |
| 2320 Terra Ceia Bay Blvd #211 Palmetto, FL | 2.0 | 2.0 | 978 | $2,500 | $2.56 | 24d | 1 | 1.37mi |
Listing history 16 events
-
2026-06-18days on market $198,000 Active 266 DOM
-
2026-06-17days on market $198,000 Active 265 DOM
-
2026-06-16days on market $198,000 Active 264 DOM
-
2026-06-15days on market $198,000 Active 263 DOM
-
2026-06-13days on market $198,000 Active 261 DOM
-
2026-06-13days on market $198,000 Active 260 DOM
-
2026-06-10days on market $198,000 Active 258 DOM
-
2026-06-09days on market $198,000 Active 257 DOM
-
2026-06-08days on market $198,000 Active 256 DOM
-
2026-06-08days on market $198,000 Active 255 DOM
-
2026-06-03days on market $198,000 Active 251 DOM
-
2026-06-02days on market $198,000 Active 250 DOM
-
2026-06-01days on market $198,000 Active 249 DOM
-
2026-05-31days on market $198,000 Active 248 DOM
-
2025-09-25$198,000 Active
-
1995-09-06soldstatus $10,000
ⓘ Source: listings_history table (triggers on properties + properties_extension) + one-shot
backfill from property_details.listing_events for pre-trigger history.
Tax reassessment forecast FL · Resets to sale price
- Current annual tax
- $2,072 · $173/mo
- Projected year-2 tax
- $2,072 · $173/mo
- Expected delta
- $0/yr ($0/mo · 0.0%)
ⓘ Screening estimate from a state-policy table — verify with the county assessor before closing.
Climate risk First Street
- Flood 1/10 Low FEMA zone X (unshaded) · 0% chance over 30 yrs
- Wildfire 1/10 Low
- Heat 10/10 Extreme 7 d/yr ≥107°F today · 30 d/yr by 30 yrs out
- Wind 10/10 Extreme 99% chance of damaging wind over 30 yrs
- Air quality 3/10 Moderate 2 unhealthy d/yr today · 2 by 30 yrs out
Nearby sold comps map
Loading sold comps map…
Walkable amenities ~0.75 mi
Loading nearby amenities…
Taxation est. · year 1
- Rental income
- $22,847
- − Mortgage interest
- −$11,091
- − Property taxes
- −$2,072
- − Insurance
- −$990
- − Repairs & maintenance
- −$1,828
- − Management
- −$1,828
- − Depreciation
- −$5,760
- Taxable loss
- −$721
- Est. tax savings @ 24.0%
- +$173
- After-tax cash flow
- $2,701/yr
For passive investors: Depreciation is non-cash, so a rental often shows a tax loss while cash-flowing — sheltering income. Rental losses are passive: they offset passive income freely, and up to $25,000/yr can offset ordinary (W-2) income if you actively participate and your MAGI is under $100k (phasing out to $0 by $150k); unused losses carry forward. On sale, claimed depreciation is recaptured at up to 25%, and gains may owe capital-gains tax (a 1031 exchange can defer both). Figures are a year-1 estimate at your 24.0% rate — not tax advice; consult a CPA.
Schools (NCES district)
- District
- Manatee
- NCES district ID
- 1201230
- Math proficiency
- 54% ▼ -6.00%
- Reading proficiency
- 50% ▼ -2.00%
- Median HH income
- $49,607
- Composite
- 44.43/100
- National rank
- #2806
- State rank
- #26 of 73 in FL
Livability — Memphis
- Score
- 63/100
- State rank
- #745
- US rank
- #16072
Category grades
Schools grade is shown separately in the Schools card above.
Census & demographics
- Census place
- Memphis, FL
- County
- Manatee County · 416,364 people
- Metro
- North Port-Sarasota-Bradenton, FL
- Population (ZIP)
- 56,208
- Household income
- $77,712
- Rent vs Own
- Severe rent burden
- 1193.0
Population outlook (Manatee County) Hauer SSP2
- Today (2025)
- 447,342 people
- By 2030
- 488,911 · +9.3%
- By 2040
- 567,934 · +27.0%
- By 2050
- 637,995 · +42.6%
- By 2075
- 781,970 · +74.8%
- By 2100
- 848,272 · +89.6%
Race, ethnicity, and origin ACS 2023
- Neighborhood character
- Diverse neighborhood (Simpson 0.58)
- Race & ethnicity
- White 59% Hispanic / Latino 22% Black 14% Two or more races 11%
- Hispanic origin (detail)
- Mexican 14% Puerto Rican 3%
- Common ancestry
- Romanian 2% Lithuanian 2% Italian 2%
- Foreign-born
- 10% · Canada, Dominican Republic, Jamaica
- Languages at home
- 81% English-only · Spanish 16% Other Indo-European 1%
Political lean MEDSL · Manatee
- 2024 margin
- Strong R (+23.5) · D 37.9% · R 61.4%
- 2008→2024 swing
- -16.5pp toward R · 2008: -7.0pp · 2024: -23.5pp
- All cycles
- 2024: R+23.5 2020: R+16.1 2016: R+17.1 2012: R+12.5 2008: R+7.0
Not yet ingested
- Civics
- —
Market trends
- HPI YoY
- ▼ -383.53%
- Current HPI
- 302.1458
- Rent YoY
- ▼ -2.98%
- Metro
- North Port-Sarasota-Bradenton, FL
- State GDP YoY
- ▲ 3.28%
- F500 in state
- 36
Industry mix (Fortune 500 HQ in FL)
| Industry | F500 HQs | Revenue |
|---|---|---|
| Industrial Technology | 2 | $29B |
|
||
| Insurance | 2 | $17B |
|
||
| Retail | 1 | $60B |
|
||
| Technology Distribution | 1 | $58B |
|
||
| Homebuilding | 1 | $35B |
|
||
| Technology Manufacturing | 1 | $35B |
|
||
Price history
+1880.0% since first listed2 events — show timeline
- 2025-09-25 Listed $198,000 Stellar MLS as Distributed by MLS Grid
- 1995-09-06 Sold (Public Records) $10,000 Public Records
Property tax history
+11.6%/yrLatest (2025): $2,072 · +224.2% YoY. Source: county tax records.
Cash-flow waterfall
monthlySold comps — $/sqft
last 12 mo · ≤1 miLoading sold comps…