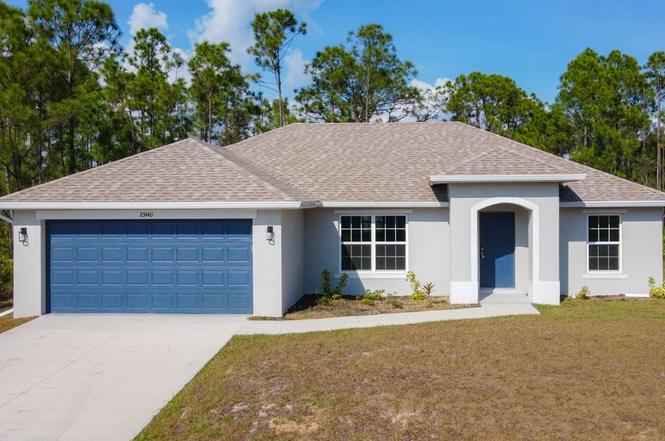
23440 Corinne Ave · Port Charlotte, FL
Flood risk 8/10 · Major
- FEMA flood zone
- X (shaded)
- Chance of flooding over 30 yrs
- 0.98%
- Est. flood insurance / yr
- $507 – $1,088
Fire risk 1/10 · Minimal
- Est. fire insurance / yr
- $947 – $1,759
Heat risk 10/10 · Severe
- Hot days now (above 107°F)
- 5 days/yr
- Hot days in 30 yrs
- 19 days/yr
Wind risk 10/10 · Severe
- Chance of severe wind over 30 yrs
- 99.0%
Air-quality risk 3/10 · Minor
- Unhealthy air days now
- 2 days/yr
- Unhealthy air days in 30 yrs
- 2 days/yr
Risk factors via First Street. Map © Google.
Why this score? — see what drove the F grade
The composite is a weighted blend of 9 inputs, each scored 0–100. Each bar is that input's sub-score; the figure is the points it added to the 100-point composite (weight × sub-score).
- ARV discount +7.5/15.0
- Cash flow +7.1/30.0
- Schools +4.6/10.0
- Livability +3.2/5.0
- Condition / age +2.5/5.0
- 1% rule +1.9/10.0
- Rent growth +1.5/5.0
- DSCR +1.3/10.0
- Appreciation +0.0/10.0
$289,900
🖨 Deal sheet (PDF) 📄 Offer letter ✓ Due diligence
Listing remarks
MOTIVATED SELLER!. .Quick move in home in great location, near Kings Hwy and Tamiami Trail for a quick drive over the Peace River to the waterfront and downtown amenities of Punta Gorda! Nice open floor plan with 3 bedrooms, 2 bathrooms, a 2-car garage, a large great room with vaulted ceilings, a master suite with a large walk-in closet, and a private bath with a glass-enclosed luxury tile shower. This home has an open kitchen with a center island that features granite countertops and plenty of cabinetry. The kitchen has 36-inch staggered Shaker-style upper cabinets with soft-close wood cabinetry, a stainless steel appliance package with a double-door refrigerator included. Features also in
Key facts
- Master suite
- Open floor plan
- Walk-in closet
Tags
Property features AI
Exterior
- Home design: House
- Exterior features: Lot approximately 9,999 (unit not specified)
Neighborhood map
What this means for you Summary
Snapshot
- This is a 3-bed/2.0-bath land listed at $290k.
Deal economics
- At list price, monthly cash flow is $-479 ($-6k/yr) — negative.
- To cash-flow at today's rent, offer at most $221k (23.9% below list).
- To meet the 1% rule (rent ≥ 1% of price), the offer needs to be $201k (30.5% below list).
- Recommended offer: $201k (30.5% below list) — sets the bar for 1% rule.
Location & tenants
- Location reads 65/100 on livability (#655 in FL) — a middle-class / working-renter tenant base. Strengths: cost of living A+, housing A+; Watch: employment D, amenities F, commute F.
- Charlotte (suburban): math 54% / reading 54% proficiency, ranked #22 of 73 in FL (top 30%) — acceptable for families but not a draw, mixed tenant base, ~2y average lease.
- Zoned schools: Peace River Elementary School (math 56% / reading 54%, grade C, #872 of 2,144 statewide, top 42%, 581 students, 64% FRL); Port Charlotte Middle School (math 59% / reading 50%, grade B-, #183 of 571 statewide, top 34%, 877 students, 55% FRL); Charlotte High School (math 44% / reading 46%, grade D-, #228 of 667 statewide, top 35%, 1,994 students, 41% FRL) — zoned schools at 53% FRL track the district average.
- Market conditions: Rents falling (-4.0%/yr); 603 active listings in the ZIP; 29 comparable units currently listed for rent nearby; rentals at typical pace (median 23d on market — plan ~3-4 weeks tenant-placement turnaround); 4,585 units permitted in Charlotte County in 2024 (703 in 5+ unit buildings).
- This rent runs 38% of the median local income ($64k/yr) — at the standard rent-burdened threshold; future hikes will face affordability resistance.
Forward outlook
- Local home prices are declining (-3.0%/yr); year-one equity from $2k of loan paydown is wiped out by about $9k of value loss. Plan a longer hold.
- Charlotte County population projected at +24% by 2050 — long-run rental-demand tailwind backs the buy-and-hold thesis.
Negotiation context
- It's been on market 163 days — a 12% lower offer ($255k) is reasonable based on typical stale-listing flexibility.
- 13 sale attempts since 18y ago with the ask held roughly flat each time — persistent listings suggest the price (not the market) is what's stuck; bring a comps-based counter.
Risks & watch-outs
- Watch-outs: flood insurance adds $66/mo.
- Climate carrying-cost: severe flood risk; severe wind risk, 99% chance of damaging wind over 30y; extreme-heat days projected 5→19/yr by 2055 (HVAC capex compounding) — expect insurance premiums to compound above CPI over the hold.
Questions for the listing agent
- What do current leases actually rent for vs. the listed asking? Can we see a recent rent roll and the last 12 months of T-12 income?
- It's been on market 163 days. Have you received any prior offers? Is the seller open to a 31% concession, seller financing, or rate buy-down credit?
- What's the actual annual flood-insurance premium (NFIP or private), and is the property in a SFHA with mandatory coverage?
- Why hasn't it sold? Are there any deal-killer items the seller is aware of (foundation, flood, title, zoning, code violations)?
- Is there a deadline driving the sale (1031 exchange, divorce, estate, relocation)? That informs how much negotiation room exists.
- Schools are D-rated, which usually means shorter tenancies and higher turnover. Who's the typical renter profile here, and what's been the actual vacancy rate?
- The area grade is low — what's the realistic commute time and amenity access for the typical tenant pool here? Any planned neighborhood developments (good or bad) we should know about?
- What's the average days-on-market for RENTAL listings here right now (not sales)? A rising rental-DOM trend means longer vacancies and softer asking-rent achievability than the comps imply.
- What's the recent tenant-quality profile in this submarket — average credit score on applications, eviction rate, late-payment / NSF rate, and stable-employment percentage? A property-management company in the area should have these aggregated.
- How much new for-sale + rental construction is in the pipeline within 1–3 miles? Heavy new supply typically softens prices + rents 12–24 months out; constrained supply supports both.
Investment metrics
- 1% rule
- 0.69% ✗
- Cap rate
- 4.59%
- Cash-on-cash
- -6.09%
- DSCR
- 0.73
- GRM
- 12.0
CMA / ARV
No comps found within radius.
Projected returns pro-forma
-3.0% appreciation · 0.0% rent growth · sell at horizon
- IRR
- -32.1%
- Equity multiple
- -0.03×
- Total profit
- $-83,290
- Equity at exit
- $43,225
- IRR
- -59.3%
- Equity multiple
- -0.65×
- Total profit
- $-134,301
- Equity at exit
- $25,065
Cash invested: $81,172 (down + closing). Projections, not guarantees.
Landlord ↔ Tenant lean methodology
- Overall (STATE)
- 87 Strongly Landlord-Friendly
- State Florida
- 87 Strongly Landlord-Friendly · R+3
- County
- — inherits STATE
- City
- — inherits STATE
ZIP-level market 33980
- Home prices YoY
- -5.0%
- Rents YoY
- -4.0%
- Active inventory
- 603
- Price-to-rent
- 12.0×
Monthly cashflow live
- Estimated rent
- $2,014 high interval (Pro) →
- Mortgage (P&I)
- −$1,520
- Tax est. 1.5%
- −$362 /mo · $4,348/yr
- Insurance
- −$121
- Flood insurance flood zone
- −$66 /mo · $798/yr
- HOA
- −$0
- Vacancy / Maint / Mgmt
- −$423
- Net cashflow
- $-479
Break-even live
Sensitivity live
| Price | -10% $-278 | -5% $-378 | +0% $-479 | +5% $-579 | +10% $-679 |
|---|---|---|---|---|---|
| Rent | -10% $-638 | -5% $-558 | +0% $-479 | +5% $-399 | +10% $-319 |
| Rate | -1.0pp $-333 | -0.5pp $-405 | base $-479 | +0.5pp $-554 | +1.0pp $-630 |
UW: 25.0% down · 7.5% · 30yr · 1.5% tax · 5.0% vac · 8.0% maint · 8.0% mgmt
Financing live
Cash to close
- Down payment
- $72,475
- Closing costs
- $8,697
- Reserves months
- —
- Total cash needed
- —
Loan-product check · same deal, 3 products live
Conventional
25% down · 7.5% · 30yr
- Down + closing
- —
- Monthly P&I
- —
- Monthly cashflow
- —
- DSCR
- —
- Eligible?
- —
Personal DTI + credit; lowest rate.
DSCR
20% down · 8.5% · 30yr
- Down + closing
- —
- Monthly P&I
- —
- Monthly cashflow
- —
- DSCR
- —
- Eligible?
- —
No personal income docs; deal must DSCR.
Hard money
10% down · 12.0% · 12mo
- Down + closing
- —
- Monthly P&I
- —
- Monthly cashflow
- —
- DSCR
- —
- Eligible?
- —
Short-term bridge; refi at stabilization.
Rent comps 29 comps
| Address | Beds | Baths | Sqft | Rent | $/sqft | DOM | Units | Dist |
|---|---|---|---|---|---|---|---|---|
| 24055 Peaceful Brook Loop Punta Gorda, FL | 3.0–5.0 | 2.0–3.0 | 2138 | $2,183 | $1.02 | 15d | 4 | 0.25mi |
| 24145 Green Heron Dr Port Charlotte, FL | 2.0 | 2.0 | 1512 | $1,900 | $1.26 | 23d | 1 | 0.42mi |
| 23067 Elmira Blvd Punta Gorda, FL | 2.0 | 2.0 | 1052 | $1,750 | $1.66 | 23d | 1 | 0.69mi |
| 23367 Mayville Ave Punta Gorda, FL | 4.0 | 2.0 | 1532 | $2,300 | $1.50 | 23d | 1 | 0.72mi |
| 3185 Clifford St Port Charlotte, FL | 3.0 | 2.0 | 1776 | $2,400 | $1.35 | 15d | 1 | 0.75mi |
| 4024 Oakview Dr Unit I3 Punta Gorda, FL | 2.0 | 2.0 | 893 | $1,900 | $2.13 | 23d | 1 | 0.80mi |
| 4016 Oakview Dr Unit J9 Punta Gorda, FL | 2.0 | 2.0 | 893 | $2,400 | $2.69 | 23d | 1 | 0.82mi |
| 4056 Oakview Dr Unit E7 Punta Gorda, FL | 2.0 | 2.0 | 892 | $3,000 | $3.36 | 23d | 1 | 0.86mi |
| 22497 Glen Ave Punta Gorda, FL | 3.0 | 2.0 | 1628 | $1,875 | $1.15 | 23d | 1 | 0.92mi |
| 23465 Harborview Rd Port Charlotte, FL | 2.0 | 2.0 | 1480 | $1,975 | $1.33 | 23d | 2 | 0.96mi |
| 22481 Westchester Blvd Unit B48 Punta Gorda, FL | 2.0 | 2.0 | 1046 | $1,150 | $1.10 | 23d | 1 | 1.01mi |
| 22481 Westchester Blvd Unit B40 Punta Gorda, FL | 2.0 | 2.0 | 1046 | $1,225 | $1.17 | 15d | 1 | 1.03mi |
| 22481 Westchester Blvd Unit B35 Punta Gorda, FL | 2.0 | 2.0 | 1046 | $1,275 | $1.22 | 23d | 1 | 1.04mi |
| 22481 Westchester Blvd Unit B36 Port Charlotte, FL | 2.0 | 2.0 | 1046 | $1,180 | $1.13 | 15d | 1 | 1.05mi |
| 4022 Beaver Ln Port Charlotte, FL | 2.0 | 2.0 | 960 | $1,300 | $1.35 | 23d | 2 | 1.10mi |
| 22441 Westchester Blvd Unit 1500G Punta Gorda, FL | 2.0 | 2.0 | 960 | $1,200 | $1.25 | 15d | 1 | 1.10mi |
| 23491 Harper Ave Punta Gorda, FL | 3.0 | 2.0 | 1382 | $1,450 | $1.05 | 23d | 1 | 1.11mi |
| 24717 Snook Ave Unit 11 D Punta Gorda, FL | 3.0 | 2.0 | 1500 | $2,000 | $1.33 | 23d | 1 | 1.15mi |
| 22328 Yonkers Ave Port Charlotte, FL | 2.0 | 2.0 | 1342 | $1,575 | $1.17 | 23d | 1 | 1.20mi |
| 2421 Ivanhoe St Port Charlotte, FL | 2.0 | 2.0 | 1396 | $3,300 | $2.36 | 15d | 1 | 1.21mi |
| 4158 Tamiami Trl Unit M4 Port Charlotte, FL | 2.0 | 2.0 | 919 | $1,500 | $1.63 | 23d | 1 | 1.29mi |
| 2451 Aquilos Ct Port Charlotte, FL | 2.0 | 2.0 | 1307 | $2,000 | $1.53 | 15d | 1 | 1.31mi |
| 25038 Harborview Rd Unit B Punta Gorda, FL | 2.0 | 2.0 | 1188 | $1,600 | $1.35 | 23d | 1 | 1.34mi |
| 22291 Westchester Blvd Port Charlotte, FL | 2.0 | 2.0 | 960 | $1,425 | $1.48 | 23d | 2 | 1.34mi |
| 22291 Westchester Blvd Port Charlotte, FL | 2.0 | 2.0 | 960 | $1,400 | $1.46 | 15d | 3 | 1.34mi |
| 4359 Sibley Bay St Unit b Port Charlotte, FL | 2.0 | 2.0 | 887 | $1,300 | $1.47 | 23d | 1 | 1.37mi |
| 25068 Harbor View Rd Punta Gorda, FL | 2.0 | 2.0 | 956 | $1,500 | $1.57 | 23d | 1 | 1.38mi |
| 5125 Melbourne St Unit E201 Punta Gorda, FL | 3.0 | 2.5 | 1831 | $1,750 | $0.96 | 15d | 1 | 1.49mi |
| 5125 Melbourne St Unit E201 Punta Gorda, FL | 3.0 | 2.5 | 1831 | $1,750 | $0.96 | 23d | 1 | 1.49mi |
Listing history 50 events
-
2026-06-22days on market $289,900 Active 163 DOM
-
2026-06-18days on market $289,900 Active 160 DOM
-
2026-06-17days on market $289,900 Active 159 DOM
-
2026-06-16days on market $289,900 Active 158 DOM
-
2026-06-15days on market $289,900 Active 157 DOM
-
2026-06-14days on market $289,900 Active 155 DOM
-
2026-06-13days on market $289,900 Active 154 DOM
-
2026-06-10days on market $289,900 Active 152 DOM
-
2026-06-09days on market $289,900 Active 151 DOM
-
2026-06-08days on market $289,900 Active 150 DOM
-
2026-06-05days on market $289,900 Active 146 DOM
-
2026-06-02days on market $289,900 Active 144 DOM
-
2026-06-01days on market $289,900 Active 143 DOM
-
2026-05-31days on market $289,900 Active 142 DOM
-
2026-05-30days on market $289,900 Active 141 DOM
-
2026-05-01soldstatus $277,000
-
2026-03-28historical
-
2026-02-05price $279,900
-
2026-01-09$289,900 Active
-
2026-01-07price $289,900
-
2025-12-31historical
-
2025-12-31historical
-
2025-12-21price $299,900
-
2025-12-21price $299,900
-
2025-12-21price $299,900
-
2025-12-12price $309,900
-
2025-12-09$309,000 Active
-
2025-12-05historical
-
2025-11-24price $309,900
-
2025-11-19price $299,900
-
2025-11-19price $299,900
-
2025-10-30price $309,000
-
2025-10-05$319,000 Active
-
2025-09-30$319,900 Active
-
2025-09-23$319,900 Active
-
2025-09-07historical
-
2025-09-02$319,900 Active
-
2025-09-02historical
-
2025-08-22historical
-
2025-08-12price $319,900
-
2025-08-11price $319,900
-
2025-08-11historical
-
2025-07-21price $329,900
-
2025-07-21status Active
-
2025-06-30$329,900 Active
-
2025-06-26historical
-
2025-06-23$329,900 Active
-
2025-05-30$330,000 Active
-
2024-10-29soldstatus $641,900
-
2021-04-14status Pending
ⓘ Source: listings_history table (triggers on properties + properties_extension) + one-shot
backfill from property_details.listing_events for pre-trigger history.
Climate risk First Street
- Flood 8/10 Severe FEMA zone X (shaded) · 98% chance over 30 yrs
- Wildfire 1/10 Low
- Heat 10/10 Extreme 5 d/yr ≥107°F today · 19 d/yr by 30 yrs out
- Wind 10/10 Extreme 99% chance of damaging wind over 30 yrs
- Air quality 3/10 Moderate 2 unhealthy d/yr today · 2 by 30 yrs out
Nearby sold comps map
Loading sold comps map…
Walkable amenities ~0.75 mi
Loading nearby amenities…
Taxation est. · year 1
- Rental income
- $24,172
- − Mortgage interest
- −$16,239
- − Property taxes
- −$4,348
- − Insurance
- −$2,247
- − Repairs & maintenance
- −$1,934
- − Management
- −$1,934
- − Depreciation
- −$8,433
- Taxable loss
- −$10,964
- Est. tax savings @ 24.0%
- +$2,631
- After-tax cash flow
- $-3,112/yr
For passive investors: Depreciation is non-cash, so a rental often shows a tax loss while cash-flowing — sheltering income. Rental losses are passive: they offset passive income freely, and up to $25,000/yr can offset ordinary (W-2) income if you actively participate and your MAGI is under $100k (phasing out to $0 by $150k); unused losses carry forward. On sale, claimed depreciation is recaptured at up to 25%, and gains may owe capital-gains tax (a 1031 exchange can defer both). Figures are a year-1 estimate at your 24.0% rate — not tax advice; consult a CPA.
Schools (NCES district)
- District
- Charlotte
- NCES district ID
- 1200240
- Math proficiency
- 54% ▼ -6.00%
- Reading proficiency
- 54% ▼ -1.00%
- Median HH income
- $44,864
- Composite
- 45.62/100
- National rank
- #2586
- State rank
- #22 of 73 in FL
Livability — Port Charlotte
- Score
- 65/100
- State rank
- #655
- US rank
- #13081
Category grades
Schools grade is shown separately in the Schools card above.
Census & demographics
- Census place
- Port Charlotte, FL
- County
- Charlotte County · 196,994 people
- City population
- 102,180
- Metro
- Punta Gorda, FL
- Population (ZIP)
- 13,120
- Household income
- $63,591
- Rent vs Own
- Severe rent burden
- 612.0
Population outlook (Charlotte County) Hauer SSP2
- Today (2025)
- 198,646 people
- By 2030
- 210,507 · +6.0%
- By 2040
- 230,857 · +16.2%
- By 2050
- 247,148 · +24.4%
- By 2075
- 281,777 · +41.8%
- By 2100
- 293,609 · +47.8%
Race, ethnicity, and origin ACS 2023
- Neighborhood character
- Predominantly White (75%)
- Race & ethnicity
- White 75% Hispanic / Latino 10% Two or more races 10% Black 9%
- Hispanic origin (detail)
- Puerto Rican 3% Cuban 2% Dominican 2%
- Common ancestry
- Romanian 5% Hispanic 4% Slovak 3%
- Foreign-born
- 16% · Canada, Jamaica
- Languages at home
- 85% English-only · Spanish 8% French/Haitian/Cajun 5% German/W. Germanic 1%
Political lean MEDSL · Charlotte
- 2024 margin
- Solid R (+34.0) · D 32.7% · R 66.7%
- 2008→2024 swing
- -26.7pp toward R · 2008: -7.2pp · 2024: -34.0pp
- All cycles
- 2024: R+34.0 2020: R+26.6 2016: R+27.8 2012: R+14.3 2008: R+7.2
Not yet ingested
- Civics
- —
Market trends
- HPI YoY
- ▼ -16.02%
- Current HPI
- 306.3331
- Rent YoY
- ▼ -4.04%
- Metro
- Punta Gorda, FL
- State GDP YoY
- ▲ 3.28%
- F500 in state
- 36
Industry mix (Fortune 500 HQ in FL)
| Industry | F500 HQs | Revenue |
|---|---|---|
| Industrial Technology | 2 | $29B |
|
||
| Insurance | 2 | $17B |
|
||
| Retail | 1 | $60B |
|
||
| Technology Distribution | 1 | $58B |
|
||
| Homebuilding | 1 | $35B |
|
||
| Technology Manufacturing | 1 | $35B |
|
||
Price history
+2698.0% since first listed43 events — show timeline
- 2026-05-01 Sold (Public Records) $277,000 Public Records
- 2026-03-28 Listing Removed — Stellar MLS as Distributed by MLS Grid
- 2026-02-05 Price Changed $279,900 Stellar MLS as Distributed by MLS Grid
- 2026-01-09 Listed $289,900 ForSaleByOwner.com
- 2026-01-07 Price Changed $289,900 Stellar MLS as Distributed by MLS Grid
- 2025-12-31 Listing Removed — SCMLS
- 2025-12-31 Listing Removed — MARMLS
- 2025-12-21 Price Changed $299,900 Stellar MLS as Distributed by MLS Grid
- 2025-12-21 Price Changed $299,900 MARMLS
- 2025-12-21 Price Changed $299,900 SCMLS
- 2025-12-12 Price Changed $309,900 SCMLS
- 2025-12-09 Listed $309,000 Stellar MLS as Distributed by MLS Grid
- 2025-12-05 Listing Removed — Stellar MLS as Distributed by MLS Grid
- 2025-11-24 Price Changed $309,900 MARMLS
- 2025-11-19 Price Changed $299,900 SCMLS
- 2025-11-19 Price Changed $299,900 Stellar MLS as Distributed by MLS Grid
- 2025-10-30 Price Changed $309,000 Stellar MLS as Distributed by MLS Grid
- 2025-10-05 Listed $319,000 Stellar MLS as Distributed by MLS Grid
- 2025-09-30 Listed $319,900 SCMLS
- 2025-09-23 Listed $319,900 MARMLS
- 2025-09-07 Listing Removed — Stellar MLS as Distributed by MLS Grid
- 2025-09-02 Listing Removed — SCMLS
- 2025-09-02 Listed $319,900 Stellar MLS as Distributed by MLS Grid
- 2025-08-22 Listing Removed — Stellar MLS as Distributed by MLS Grid
- 2025-08-12 Price Changed $319,900 Stellar MLS as Distributed by MLS Grid
- 2025-08-11 Price Changed $319,900 SCMLS
- 2025-08-11 Listing Removed — Stellar MLS as Distributed by MLS Grid
- 2025-07-21 Price Changed $329,900 Stellar MLS as Distributed by MLS Grid
- 2025-07-21 Relisted — Stellar MLS as Distributed by MLS Grid
- 2025-06-30 Listed $329,900 Stellar MLS as Distributed by MLS Grid
- 2025-06-26 Listing Removed — Stellar MLS as Distributed by MLS Grid
- 2025-06-23 Listed $329,900 SCMLS
- 2025-05-30 Listed $330,000 Stellar MLS as Distributed by MLS Grid
- 2024-10-29 Sold (Public Records) $641,900 Public Records
- 2021-04-14 Pending — Stellar MLS as Distributed by MLS Grid
- 2021-04-14 Listing Removed — Stellar MLS as Distributed by MLS Grid
- 2021-04-01 Listed $249,900 Stellar MLS as Distributed by MLS Grid
- 2021-03-24 Sold (Public Records) $10,000 Public Records
- 2021-03-24 Sold (MLS) $10,000 Stellar MLS as Distributed by MLS Grid
- 2021-03-23 Pending — Stellar MLS as Distributed by MLS Grid
- 2021-02-12 Pending — Stellar MLS as Distributed by MLS Grid
- 2021-01-08 Listed $10,000 Stellar MLS as Distributed by MLS Grid
- 2008-03-26 Listed $9,900 Stellar MLS as Distributed by MLS Grid
Property tax history
+4.8%/yrLatest (2025): $550 · +3.3% YoY. Source: county tax records.
Cash-flow waterfall
monthlySold comps — $/sqft
last 12 mo · ≤1 miLoading sold comps…