464 Lou Gray Dr · Tri-City, OR
Flood risk 1/10 · Minimal
- FEMA flood zone
- X (unshaded)
- Chance of flooding over 30 yrs
- 0.0%
- Est. flood insurance / yr
- $507 – $1,088
Fire risk 5/10 · Moderate
- Est. fire insurance / yr
- $498 – $926
Heat risk 5/10 · Moderate
- Hot days now (above 95°F)
- 7 days/yr
- Hot days in 30 yrs
- 14 days/yr
Wind risk 1/10 · Minimal
- Chance of severe wind over 30 yrs
- —
Air-quality risk 9/10 · Severe
- Unhealthy air days now
- 13 days/yr
- Unhealthy air days in 30 yrs
- 14 days/yr
Risk factors via First Street. Map © Google.
Why this score? — see what drove the D+ grade
The composite is a weighted blend of 9 inputs, each scored 0–100. Each bar is that input's sub-score; the figure is the points it added to the 100-point composite (weight × sub-score).
- Cash flow +20.6/30.0
- ARV discount +7.5/15.0
- DSCR +6.5/10.0
- 1% rule +4.2/10.0
- Rent growth +2.5/5.0
- Livability +2.5/5.0
- Condition / age +2.5/5.0
- Schools +2.3/10.0
- Appreciation +0.0/10.0
$125,000
🖨 Deal sheet (PDF) 📄 Offer letter ✓ Due diligence
Listing remarks MLS
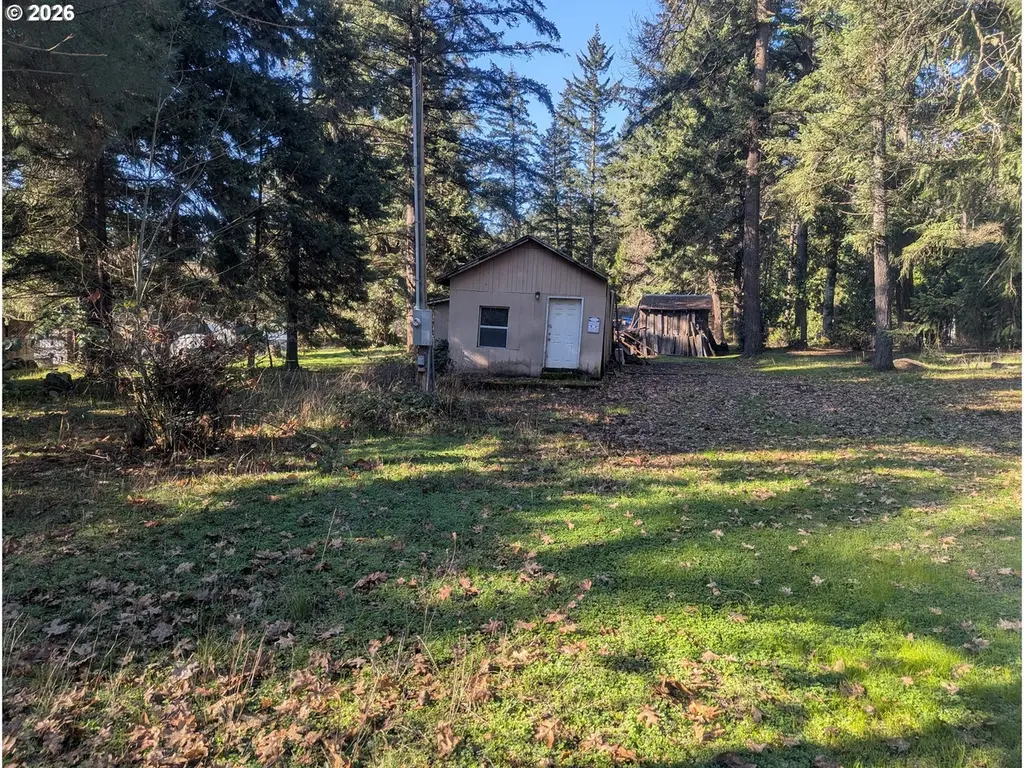
Great piece of property with a lot of potential. Homesite surrounded by mature trees. Easy access to I-5 and surrounding businesses like 7 Feather Resort and Casino. Great proximity for fishing and outdoor sports.
Key facts
- Outdoor sports
- Easy access to i-5
- Near great fishing
Tags
Neighborhood map
What this means for you Summary
Snapshot
- This is a 2-bed/1.0-bath other listed at $125k.
Deal economics
- At list price, monthly cash flow is $167 ($2k/yr) — positive.
- The deal already cash-flows at list — no discount required.
- To meet the 1% rule (rent ≥ 1% of price), the offer needs to be $115k (7.9% below list).
- Recommended offer: $110k (12.0% below list) — sets the bar for market timing.
- Cap rate 7.9% vs local median 3.3% in Tri-City — top-decile yield for the area; either an underpriced asset or a hidden risk that comps aren't pricing in. Stress-test before assuming the spread holds.
Location & tenants
- Location reads: area grade D — affects rentability + tenant quality, not the cash-flow math above.
- South Umpqua SD 19 (town): math 21% / reading 34% proficiency, ranked #51 of 58 in OR (top 88%) — low school quality limits family demand, transient renter base, plan for 1-2y turnover; 61% free/reduced lunch — lower-income household profile, screen leases tightly.
- Market conditions: 125 active listings in the ZIP; 190 units permitted in Douglas County in 2024 (0 in 5+ unit buildings).
Forward outlook
- Local home prices are declining (-3.0%/yr); year-one equity from $864 of loan paydown is wiped out by about $4k of value loss. Plan a longer hold.
- Douglas County population projected at -13% by 2050 — secular population decline; favor cash flow + early exit over multi-decade hold.
Negotiation context
- It's been on market 136 days — a 12% lower offer ($110k) is reasonable based on typical stale-listing flexibility.
Risks & watch-outs
- Watch-outs: built in 1956 — expect roof / HVAC / electrical / plumbing capex.
- Climate carrying-cost: moderate wildfire risk; extreme-heat days projected 7→14/yr by 2055 (HVAC capex compounding) — expect insurance premiums to compound above CPI over the hold.
Questions for the listing agent
- It's been on market 136 days. Have you received any prior offers? Is the seller open to a 12% concession, seller financing, or rate buy-down credit?
- Built in 1956 — when were the roof, HVAC, electrical panel, plumbing, and water heater last replaced?
- Why hasn't it sold? Are there any deal-killer items the seller is aware of (foundation, flood, title, zoning, code violations)?
- Is there a deadline driving the sale (1031 exchange, divorce, estate, relocation)? That informs how much negotiation room exists.
- The area grade is low — what's the realistic commute time and amenity access for the typical tenant pool here? Any planned neighborhood developments (good or bad) we should know about?
- What's the average days-on-market for RENTAL listings here right now (not sales)? A rising rental-DOM trend means longer vacancies and softer asking-rent achievability than the comps imply.
- What's the recent tenant-quality profile in this submarket — average credit score on applications, eviction rate, late-payment / NSF rate, and stable-employment percentage? A property-management company in the area should have these aggregated.
- How much new for-sale + rental construction is in the pipeline within 1–3 miles? Heavy new supply typically softens prices + rents 12–24 months out; constrained supply supports both.
Investment metrics
- 1% rule
- 0.92% ✗
- Cap rate
- 7.90%
- Cash-on-cash
- 5.73%
- DSCR
- 1.25
- GRM
- 9.1
CMA / ARV
- ARV (median comp)
- $286,591
- List price
- $125,000
- Delta
- -56.38%
- Verdict
- UNDERPRICED
- Comps
- 1 within 2.0 mi
Projected returns pro-forma
-3.0% appreciation · 3.0% rent growth · sell at horizon
- IRR
- -7.5%
- Equity multiple
- 0.72×
- Total profit
- $-9,677
- Equity at exit
- $18,638
- IRR
- 2.0%
- Equity multiple
- 1.14×
- Total profit
- $5,036
- Equity at exit
- $10,808
Cash invested: $35,000 (down + closing). Projections, not guarantees.
Landlord ↔ Tenant lean methodology
- Overall (STATE)
- 28 Tenant-Leaning
- State Oregon
- 28 Tenant-Leaning · D+6
- County
- — inherits STATE
- City
- — inherits STATE
ZIP-level market 97457
- Home prices YoY
- -18.1%
- Active inventory
- 125
- Price-to-rent
- 9.1×
Monthly cashflow live
- Estimated rent
- $1,151 medium interval (Pro) →
- Mortgage (P&I)
- −$656
- Tax from tax record
- −$35 /mo · $414/yr
- Insurance
- −$52
- HOA
- −$0
- Vacancy / Maint / Mgmt
- −$242
- Net cashflow
- $167
Break-even live
Sensitivity live
| Price | -10% $238 | -5% $202 | +0% $167 | +5% $132 | +10% $96 |
|---|---|---|---|---|---|
| Rent | -10% $76 | -5% $122 | +0% $167 | +5% $212 | +10% $258 |
| Rate | -1.0pp $230 | -0.5pp $199 | base $167 | +0.5pp $135 | +1.0pp $102 |
UW: 25.0% down · 7.5% · 30yr · 1.5% tax · 5.0% vac · 8.0% maint · 8.0% mgmt
Financing live
Cash to close
- Down payment
- $31,250
- Closing costs
- $3,750
- Reserves months
- —
- Total cash needed
- —
Loan-product check · same deal, 3 products live
Conventional
25% down · 7.5% · 30yr
- Down + closing
- —
- Monthly P&I
- —
- Monthly cashflow
- —
- DSCR
- —
- Eligible?
- —
Personal DTI + credit; lowest rate.
DSCR
20% down · 8.5% · 30yr
- Down + closing
- —
- Monthly P&I
- —
- Monthly cashflow
- —
- DSCR
- —
- Eligible?
- —
No personal income docs; deal must DSCR.
Hard money
10% down · 12.0% · 12mo
- Down + closing
- —
- Monthly P&I
- —
- Monthly cashflow
- —
- DSCR
- —
- Eligible?
- —
Short-term bridge; refi at stabilization.
Listing history 17 events
-
2026-06-21days on market $125,000 Active 136 DOM
-
2026-06-19days on market $125,000 Active 134 DOM
-
2026-06-18days on market $125,000 Active 133 DOM
-
2026-06-17days on market $125,000 Active 132 DOM
-
2026-06-16days on market $125,000 Active 131 DOM
-
2026-06-15days on market $125,000 Active 130 DOM
-
2026-06-14days on market $125,000 Active 128 DOM
-
2026-06-12days on market $125,000 Active 127 DOM
-
2026-06-09days on market $125,000 Active 124 DOM
-
2026-06-08days on market $125,000 Active 123 DOM
-
2026-06-07days on market $125,000 Active 122 DOM
-
2026-06-05days on market $125,000 Active 119 DOM
-
2026-06-02days on market $125,000 Active 117 DOM
-
2026-06-01days on market $125,000 Active 116 DOM
-
2026-05-31days on market $125,000 Active 115 DOM
-
2026-05-30days on market $125,000 Active 114 DOM
-
2026-02-05$125,000 Active 216-char remark
Show marketing remark (216 chars)
Great piece of property with a lot of potential. Homesite surrounded by mature trees. Easy access to I-5 and surrounding businesses like 7 Feather Resort and Casino. Great proximity for fishing and outdoor sports.
ⓘ Source: listings_history table (triggers on properties + properties_extension) + one-shot
backfill from property_details.listing_events for pre-trigger history.
Tax reassessment forecast OR · Resets to sale price
- Current annual tax
- $414 · $35/mo
- Projected year-2 tax
- $1,212 · $101/mo
- Expected delta
- +$798/yr (+$67/mo · 192.7%)
ⓘ Screening estimate from a state-policy table — verify with the county assessor before closing.
Climate risk First Street
- Flood 1/10 Low FEMA zone X (unshaded) · 0% chance over 30 yrs
- Wildfire 5/10 Major
- Heat 5/10 Major 7 d/yr ≥95°F today · 14 d/yr by 30 yrs out
- Wind 1/10 Low
- Air quality 9/10 Extreme 13 unhealthy d/yr today · 14 by 30 yrs out
Nearby sold comps map
Loading sold comps map…
Walkable amenities ~0.75 mi
Loading nearby amenities…
Taxation est. · year 1
- Rental income
- $13,809
- − Mortgage interest
- −$7,002
- − Property taxes
- −$414
- − Insurance
- −$625
- − Repairs & maintenance
- −$1,105
- − Management
- −$1,105
- − Depreciation
- −$3,636
- Taxable loss
- −$78
- Est. tax savings @ 24.0%
- +$19
- After-tax cash flow
- $2,023/yr
For passive investors: Depreciation is non-cash, so a rental often shows a tax loss while cash-flowing — sheltering income. Rental losses are passive: they offset passive income freely, and up to $25,000/yr can offset ordinary (W-2) income if you actively participate and your MAGI is under $100k (phasing out to $0 by $150k); unused losses carry forward. On sale, claimed depreciation is recaptured at up to 25%, and gains may owe capital-gains tax (a 1031 exchange can defer both). Figures are a year-1 estimate at your 24.0% rate — not tax advice; consult a CPA.
Schools (NCES district)
- District
- South Umpqua SD 19
- NCES district ID
- 4111610
- Math proficiency
- 21% ▼ -5.00%
- Reading proficiency
- 34% ▼ -12.00%
- Median HH income
- $38,796
- Composite
- 23.01/100
- National rank
- #7976
- State rank
- #51 of 58 in OR
Livability — Tri-City
No livability data for this city. (Only ~50 U.S. cities are tracked.)
Census & demographics
- Population (ZIP)
- 10,158
Population outlook (Douglas County) Hauer SSP2
- Today (2025)
- 105,191 people
- By 2030
- 102,664 · -2.4%
- By 2040
- 96,668 · -8.1%
- By 2050
- 91,279 · -13.2%
- By 2075
- 79,395 · -24.5%
- By 2100
- 66,107 · -37.2%
Race, ethnicity, and origin ACS 2023
- Neighborhood character
- Predominantly White (87%)
- Race & ethnicity
- White 87% Two or more races 8% Hispanic / Latino 6% Native American 1%
- Hispanic origin (detail)
- Mexican 4%
- Common ancestry
- Portuguese 4% Lithuanian 3% Slovak 3%
- Foreign-born
- 2% · Canada
- Languages at home
- 97% English-only · Spanish 1%
Political lean MEDSL · Douglas
- 2024 margin
- Solid R (+37.7) · D 29.9% · R 67.6% · Other 2.5%
- 2008→2024 swing
- -17.6pp toward R · 2008: -20.1pp · 2024: -37.7pp
- All cycles
- 2024: R+37.7 2020: R+37.5 2016: R+39.4 2012: R+27.6 2008: R+20.1
Not yet ingested
- Civics
- —
Market trends
- HPI YoY
- ▼ -76.88%
- Current HPI
- 348.9631
- Rent YoY
- —
- Metro
- —
- State GDP YoY
- ▲ 2.05%
- F500 in state
- 2
Industry mix (Fortune 500 HQ in OR)
| Industry | F500 HQs | Revenue |
|---|---|---|
| Consumer Goods | 1 | $51B |
|
||
Price history
1 event — show timeline
- 2026-02-05 Listed $125,000 RMLS
Property tax history
+2.3%/yrLatest (2025): $414 · +5.4% YoY. Source: county tax records.
Cash-flow waterfall
monthlySold comps — $/sqft
last 12 mo · ≤1 miLoading sold comps…