808 Dudley Ct #808 Marshall Court · Ventnor City, NJ
Flood risk No data
- FEMA flood zone
- —
- Chance of flooding over 30 yrs
- —
- Est. flood insurance / yr
- —
Fire risk No data
- Est. fire insurance / yr
- —
Heat risk No data
- Hot days now (above threshold)
- —
- Hot days in 30 yrs
- —
Wind risk No data
- Chance of severe wind over 30 yrs
- —
Air-quality risk No data
- Unhealthy air days now
- —
- Unhealthy air days in 30 yrs
- —
Risk factors via First Street. Map © Google.
Why this score? — see what drove the C+ grade
The composite is a weighted blend of 9 inputs, each scored 0–100. Each bar is that input's sub-score; the figure is the points it added to the 100-point composite (weight × sub-score).
- Cash flow +22.4/30.0
- 1% rule +7.7/10.0
- ARV discount +7.5/15.0
- DSCR +7.2/10.0
- Rent growth +5.0/5.0
- Condition / age +4.0/5.0
- Livability +3.6/5.0
- Schools +3.3/10.0
- Appreciation +0.0/10.0
$499,000
🖨 Deal sheet (PDF) 📄 Offer letter ✓ Due diligence
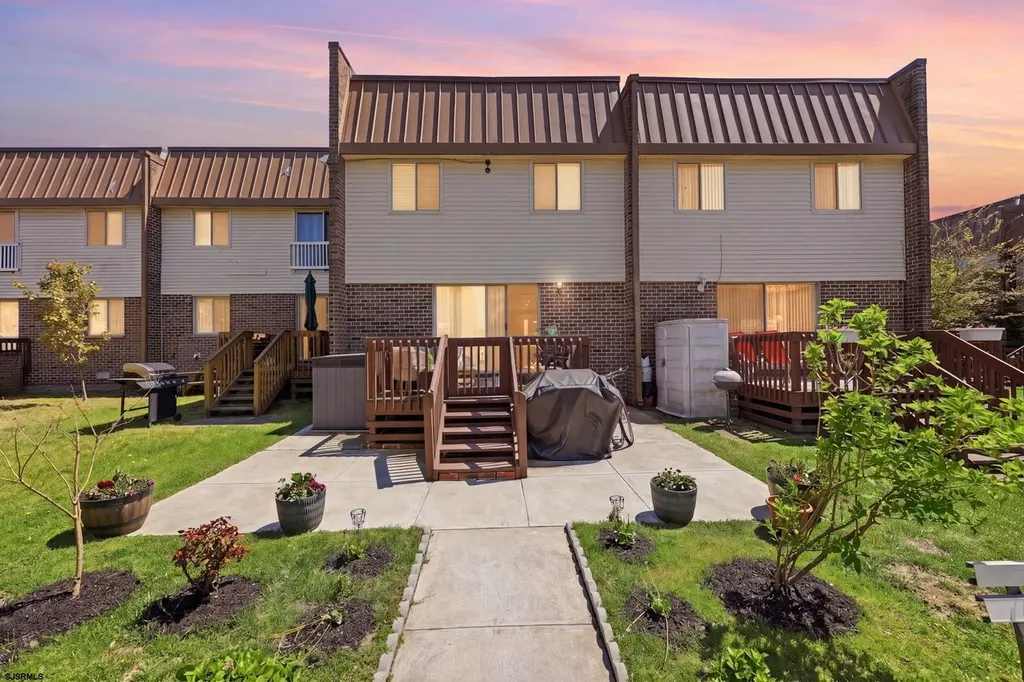
Listing remarks
Check out this beautifully updated, spacious townhome in Ventnor with top of the line finishes. As soon as you step inside, this home resonates quality, functionality, and comfort. You first notice the pristine hardwood floors and spacious kitchen, dining area, and living room. The kitchen amenities include white shaker cabinets, quartz countertops, white subway tile backsplash, stainless steel appliances, center island with seating for four, wine cooler, and microwave oven under center island. The first floor is an open concept with plenty of room. There is a deck off of the living room for fresh air or your morning coffee. There is a custom tiled half bath on the first floor for your conv
Key facts
- $730 HOA
- Community pool
- Listed 46 days
Property features AI
Finance
- HOA & community: Monthly association fee of $730; Association-managed; Association fees cover insurance, maintenance, management, sewer, trash, water, gas, hot water, air conditioning, heat, and pool
Exterior
- Parking: Exterior parking (see remarks); No garage
- Utilities: Public water; Public sewer; Gas water heater
- Home design: Condo unit (Waterview); 2-story unit; Property for sale; Pets allowed with restrictions
- Construction: 25+ years old
- Exterior features: Brick and vinyl exterior; Pool (common area)
Interior
- Kitchen: Kitchen island; Dishwasher; Gas stove; Microwave; Self-cleaning oven; Refrigerator; Disposal
- Bedrooms: Unit has 2 levels
- Flooring: Hardwood floors
- Bathrooms: 2 full bathrooms; 1 half bathroom
- Heating & cooling: Central air conditioning; Natural gas heating
- Interior features: Disposal; Dishwasher; Dryer; Gas stove; Microwave; Refrigerator; Self-cleaning oven; Washer; Hardwood floors; Kitchen center island; Master bath
- Laundry & utility: Washer and dryer included
Neighborhood map
What this means for you Summary
Snapshot
- This is a 3-bed/2.5-bath townhouse listed at $499k. Condition is rated good.
Deal economics
- At list price, monthly cash flow is $832 ($10k/yr) — positive.
- The deal already cash-flows at list — no discount required.
- Meets the 1% rule at list price ($6k rent vs $499k).
- Recommended offer: $484k (3.0% below list) — sets the bar for market timing.
- Cap rate 8.3% vs local median 4.1% in Ventnor City — top-decile yield for the area; either an underpriced asset or a hidden risk that comps aren't pricing in. Stress-test before assuming the spread holds.
Location & tenants
- Location reads 72/100 on livability (#202 in NJ) — a middle-class / working-renter tenant base. Strengths: health & safety A+, commute A-, crime B+; Watch: amenities F, cost of living F.
- Ventnor City School District (suburban): math 27% / reading 49% proficiency, ranked #266 of 472 in NJ (top 56%) — families likely to look elsewhere, expect single-tenant / working-renter base with shorter leases.
- Zoned schools: Ventnor Elementary School (math 27% / reading 42%, grade F, #582 of 1,303 statewide, top 49%, 304 students, 47% FRL); Ventnor Middle School (math 28% / reading 52%, grade F, #197 of 431 statewide, top 46%, 204 students, 62% FRL) — zoned schools at 54% FRL track the district average.
- Market conditions: Rents rising fast (+57.3%/yr); 161 active listings in the ZIP; 15 comparable units currently listed for rent nearby; rentals at typical pace (median 24d on market — plan ~3-4 weeks tenant-placement turnaround); 672 units permitted in Atlantic County in 2024 (258 in 5+ unit buildings).
- At $6,343/mo this rent would consume 110% of the median local household income ($69k/yr) (locally 329% of renters already pay >50% of income on rent) — very limited rent-growth headroom before tenants either downsize or default.
Forward outlook
- Local home prices are declining (-3.0%/yr); year-one equity from $3k of loan paydown is wiped out by about $15k of value loss. Plan a longer hold.
- Atlantic County population projected at -12% by 2050 — secular population decline; favor cash flow + early exit over multi-decade hold.
- At projected returns (-3.0% appreciation + 8.0% rent growth), your $140k cash investment doubles in ~8 years — after that, you're playing with house money.
Negotiation context
- It's been on market 46 days — a 3% lower offer ($484k) is reasonable based on typical stale-listing flexibility.
Questions for the listing agent
- It's been on market 46 days. Have you received any prior offers? Is the seller open to a 3% concession, seller financing, or rate buy-down credit?
- What does the HOA fee cover, when was the last increase, and are there any pending special assessments or reserve-fund shortfalls?
- Is there a deadline driving the sale (1031 exchange, divorce, estate, relocation)? That informs how much negotiation room exists.
- What's the average days-on-market for RENTAL listings here right now (not sales)? A rising rental-DOM trend means longer vacancies and softer asking-rent achievability than the comps imply.
- What's the recent tenant-quality profile in this submarket — average credit score on applications, eviction rate, late-payment / NSF rate, and stable-employment percentage? A property-management company in the area should have these aggregated.
- How much new for-sale + rental construction is in the pipeline within 1–3 miles? Heavy new supply typically softens prices + rents 12–24 months out; constrained supply supports both.
Investment metrics
- 1% rule
- 1.27% ✓
- Cap rate
- 8.29%
- Cash-on-cash
- 7.15%
- DSCR
- 1.32
- GRM
- 6.6
CMA / ARV
- ARV (median comp)
- $328,523
- List price
- $499,000
- Delta
- 51.89%
- Verdict
- OVERPRICED
- Comps
- 20 within 1.0 mi
Show comp detail 1 sale within ~0.75 mi
| Address | Dist | Beds/Ba | Sqft | Sold | Price | $/sf | Match |
|---|---|---|---|---|---|---|---|
| 829 N Dorset Ave #829 | 0.03mi | 3/2.5 | 1,680 (-7%) | 14mo | $294,900 | $176 | 76 |
Match score weights: distance 35% · size 25% · config 20% · recency 20%. Top-matched comps best support the ARV.
Projected returns pro-forma
-3.0% appreciation · 8.0% rent growth · sell at horizon
- IRR
- 1.1%
- Equity multiple
- 1.04×
- Total profit
- $6,228
- Equity at exit
- $74,403
- IRR
- 15.8%
- Equity multiple
- 2.64×
- Total profit
- $228,477
- Equity at exit
- $43,144
Cash invested: $139,720 (down + closing). Projections, not guarantees.
Landlord ↔ Tenant lean methodology
- Overall (STATE)
- 21 Tenant-Leaning
- State New Jersey
- 21 Tenant-Leaning · D+6
- County
- — inherits STATE
- City
- — inherits STATE
ZIP-level market 08406
- Home prices YoY
- -33.3%
- Rents YoY
- 57.3%
- Active inventory
- 161
- Price-to-rent
- 6.6×
Monthly cashflow live
- Estimated rent
- $6,343 high interval (Pro) →
- Mortgage (P&I)
- −$2,617
- Tax est. 1.5%
- −$624 /mo · $7,485/yr
- Insurance
- −$208
- HOA
- −$730
- Lot rent
- −$0
- Vacancy / Maint / Mgmt
- −$1,332
- Net cashflow
- $832
Break-even live
Sensitivity live
| Price | -10% $1,177 | -5% $1,005 | +0% $832 | +5% $660 | +10% $488 |
|---|---|---|---|---|---|
| Rent | -10% $331 | -5% $582 | +0% $832 | +5% $1,083 | +10% $1,334 |
| Rate | -1.0pp $1,084 | -0.5pp $959 | base $832 | +0.5pp $703 | +1.0pp $572 |
UW: 25.0% down · 7.5% · 30yr · 1.5% tax · 5.0% vac · 8.0% maint · 8.0% mgmt
Financing live
Cash to close
- Down payment
- $124,750
- Closing costs
- $14,970
- Reserves months
- —
- Total cash needed
- —
Loan-product check · same deal, 3 products live
Conventional
25% down · 7.5% · 30yr
- Down + closing
- —
- Monthly P&I
- —
- Monthly cashflow
- —
- DSCR
- —
- Eligible?
- —
Personal DTI + credit; lowest rate.
DSCR
20% down · 8.5% · 30yr
- Down + closing
- —
- Monthly P&I
- —
- Monthly cashflow
- —
- DSCR
- —
- Eligible?
- —
No personal income docs; deal must DSCR.
Hard money
10% down · 12.0% · 12mo
- Down + closing
- —
- Monthly P&I
- —
- Monthly cashflow
- —
- DSCR
- —
- Eligible?
- —
Short-term bridge; refi at stabilization.
Rent comps 15 comps
| Address | Beds | Baths | Sqft | Rent | $/sqft | DOM | Units | Dist |
|---|---|---|---|---|---|---|---|---|
| 610A N Victoria Ave Ventnor City, NJ | 3.0 | 2.5 | 1800 | $2,550 | $1.42 | 23d | 1 | 0.28mi |
| 406 N Dorset Ave Ventnor City, NJ | 4.0 | 1.5 | 1568 | $13,000 | $8.29 | 16d | 1 | 0.44mi |
| 109 N Wissahickon Ave Unit B Ventnor City, NJ | 4.0 | 3.5 | 2000 | $25,000 | $12.50 | 23d | 1 | 1.00mi |
| 24 N Baton Rouge Ave Ventnor City, NJ | 3.0 | 2.0 | 1350 | $18,000 | $13.33 | 16d | 1 | 1.02mi |
| 1 N Austin Ave Unit 1308998P Ventnor City, NJ | 3.0 | 3.0 | 2195 | $7,184 | $3.27 | 23d | 1 | 1.03mi |
| 7 S Richards Ave Ventnor City, NJ | 4.0 | 2.0 | 1600 | $25,000 | $15.62 | 16d | 1 | 1.10mi |
| 7103 Ventnor Ave Ventnor City, NJ | 4.0 | 3.0 | 2288 | $5,500 | $2.40 | 16d | 1 | 1.21mi |
| 6 N Melbourne Ave Ventnor City, NJ | 4.0 | 3.5 | 2028 | $3,000 | $1.48 | 46d | 1 | 1.21mi |
| 5000 Boardwalk #1009 Ventnor City, NJ | 2.0 | 2.5 | 1893 | $17,000 | $8.98 | 23d | 1 | 1.22mi |
| 119 N Belmont Ave Unit June 2026 Margate City, NJ | 4.0 | 2.5 | 2044 | $10,000 | $4.89 | 16d | 1 | 1.26mi |
| 100 S Berkley Sq Unit 4H Atlantic City, NJ | 2.0 | 2.0 | 1520 | $3,200 | $2.11 | 23d | 1 | 1.35mi |
| 307 N Essex Ave Margate City, NJ | 4.0 | 2.0 | 1561 | $1,800 | $1.15 | 46d | 1 | 1.41mi |
| 3914 South Blvd Atlantic City, NJ | 2.0 | 2.5 | 1700 | $3,400 | $2.00 | 23d | 1 | 1.42mi |
| 36 Chelsea Ct Atlantic City, NJ | 3.0 | 2.5 | 2100 | $3,300 | $1.57 | 16d | 1 | 1.44mi |
| 200 N Essex Ave Margate City, NJ | 4.0 | 3.0 | 1570 | $15,000 | $9.55 | 46d | 1 | 1.47mi |
HOA detail
- Monthly dues
- $730 · $8,760/yr
Listing history 19 events
-
2026-06-23days on market $499,000 Under Contract 46 DOM
-
2026-06-21days on market $499,000 Under Contract 45 DOM
-
2026-06-19days on market $499,000 Under Contract 43 DOM
-
2026-06-18days on market $499,000 Under Contract 42 DOM
-
2026-06-17days on market $499,000 Under Contract 41 DOM
-
2026-06-16days on market $499,000 Under Contract 40 DOM
-
2026-06-15days on market $499,000 Under Contract 39 DOM
-
2026-06-14days on market $499,000 Under Contract 37 DOM
-
2026-06-13days on market $499,000 Under Contract 36 DOM
-
2026-06-10days on market $499,000 Under Contract 34 DOM
-
2026-06-09days on market $499,000 Under Contract 33 DOM
-
2026-06-08days on market $499,000 Under Contract 32 DOM
-
2026-06-07days on market $499,000 Under Contract 31 DOM
-
2026-06-03days on market $499,000 Under Contract 27 DOM
-
2026-06-02days on market $499,000 Under Contract 26 DOM
-
2026-06-01days on market $499,000 Under Contract 25 DOM
-
2026-05-31days on market $499,000 Under Contract 24 DOM
-
2026-05-30days on market $499,000 Under Contract 23 DOM
-
2026-05-04$499,000 Active 1431-char remark
ⓘ Source: listings_history table (triggers on properties + properties_extension) + one-shot
backfill from property_details.listing_events for pre-trigger history.
Nearby sold comps map
Loading sold comps map…
Walkable amenities ~0.75 mi
Loading nearby amenities…
Taxation est. · year 1
- Rental income
- $76,116
- − Mortgage interest
- −$27,952
- − Property taxes
- −$7,485
- − Insurance
- −$2,495
- − Repairs & maintenance
- −$6,089
- − Management
- −$6,089
- − HOA
- −$8,760
- − Depreciation
- −$14,516
- Taxable income
- $2,729
- Est. tax owed @ 24.0%
- −$655
- After-tax cash flow
- $9,335/yr
For passive investors: Depreciation is non-cash, so a rental often shows a tax loss while cash-flowing — sheltering income. Rental losses are passive: they offset passive income freely, and up to $25,000/yr can offset ordinary (W-2) income if you actively participate and your MAGI is under $100k (phasing out to $0 by $150k); unused losses carry forward. On sale, claimed depreciation is recaptured at up to 25%, and gains may owe capital-gains tax (a 1031 exchange can defer both). Figures are a year-1 estimate at your 24.0% rate — not tax advice; consult a CPA.
Condition & rehab AI · 7 photos
This beautifully updated townhouse in Ventnor City is in excellent condition with top-of-the-line finishes and a spacious layout. It offers a well-maintained exterior, hardwood floors, and a modern kitchen with quartz countertops and stainless steel appliances. The property is move-in ready and would benefit from some minor exterior updates to enhance its curb appeal and value.
Value-add opportunities
- Both Paint exterior siding — Fresh paint can enhance curb appeal and property value.
- Both Replace outdoor lighting — Upgrading outdoor lighting can improve safety and curb appeal.
- Both Install smart home devices — Smart home devices can increase convenience and property value.
- Both Add a smart thermostat — A smart thermostat can improve energy efficiency and comfort, enhancing both resale and rental value.
- Both Install a smart lock — A smart lock can improve security and convenience, enhancing both resale and rental value.
Renovation cost estimate screening
Value-add ROI direction
- Both Paint exterior siding — Fresh paint can enhance curb appeal and property value. ↑
- Both Replace outdoor lighting — Upgrading outdoor lighting can improve safety and curb appeal. ↑
- Both Install smart home devices — Smart home devices can increase convenience and property value. ↑
- Both Add a smart thermostat — A smart thermostat can improve energy efficiency and comfort, enhancing both resale and rental value. ↑
- Both Install a smart lock — A smart lock can improve security and convenience, enhancing both resale and rental value. ↑
ⓘ Cost ranges are severity-bucket heuristics (US national rule-of-thumb). Get contractor quotes + a written scope before underwriting a rehab budget.
Schools (NCES district)
- District
- Ventnor City School District
- NCES district ID
- 3416680
- Math proficiency
- 27% ▼ -18.00%
- Reading proficiency
- 49% ▼ -7.00%
- Median HH income
- $52,220
- Composite
- 32.96/100
- National rank
- #5588
- State rank
- #266 of 472 in NJ
Livability — Ventnor City
- Score
- 72/100
- State rank
- #202
- US rank
- #5716
Category grades
Schools grade is shown separately in the Schools card above.
Census & demographics
- Census place
- Ventnor City, NJ
- County
- Atlantic County · 143,611 people
- City population
- 8,972
- Metro
- Atlantic City-Hammonton, NJ
- Population (ZIP)
- 8,972
- Household income
- $69,099
- Rent vs Own
- Severe rent burden
- 329.0
Population outlook (Atlantic County) Hauer SSP2
- Today (2025)
- 268,948 people
- By 2030
- 264,497 · -1.7%
- By 2040
- 252,261 · -6.2%
- By 2050
- 237,846 · -11.6%
- By 2075
- 210,650 · -21.7%
- By 2100
- 180,234 · -33.0%
Race, ethnicity, and origin ACS 2023
- Neighborhood character
- Predominantly White (70%)
- Race & ethnicity
- White 70% Hispanic / Latino 15% Asian 9% Two or more races 9% Black 2%
- Hispanic origin (detail)
- Mexican 3% Puerto Rican 4% Dominican 1%
- Common ancestry
- Romanian 4% Scotch-Irish 3% Iranian 2%
- Foreign-born
- 21% · Canada, Jamaica, Vietnam
- Languages at home
- 76% English-only · Spanish 10% Other Indo-European 5% Vietnamese 3%
Political lean MEDSL · Atlantic
- 2024 margin
- Toss-up / Even · D 47.7% · R 50.7% · Other 1.6%
- 2008→2024 swing
- -18.1pp toward R · 2008: 15.1pp · 2024: -3.0pp
- All cycles
- 2024: R+3.0 2020: D+6.7 2016: D+6.2 2012: D+17.2 2008: D+15.1
Not yet ingested
- Civics
- —
Market trends
- HPI YoY
- ▼ -223.99%
- Current HPI
- 449.3494
- Rent YoY
- ▲ 57.28%
- Metro
- Atlantic City-Hammonton, NJ
- State GDP YoY
- ▲ 2.05%
- F500 in state
- 34
Industry mix (Fortune 500 HQ in NJ)
| Industry | F500 HQs | Revenue |
|---|---|---|
| Consumer Goods | 3 | $31B |
|
||
| Pharmaceuticals | 2 | $153B |
|
||
| Technology | 2 | $21B |
|
||
| Insurance | 2 | $20B |
|
||
| Healthcare | 2 | $19B |
|
||
| Financial Services | 1 | $70B |
|
||
Price history
2 events — show timeline
- 2026-05-25 Contingent — SJSRMLS
- 2026-05-04 Listed $499,000 SJSRMLS
Cash-flow waterfall
monthlySold comps — $/sqft
last 12 mo · ≤1 miLoading sold comps…