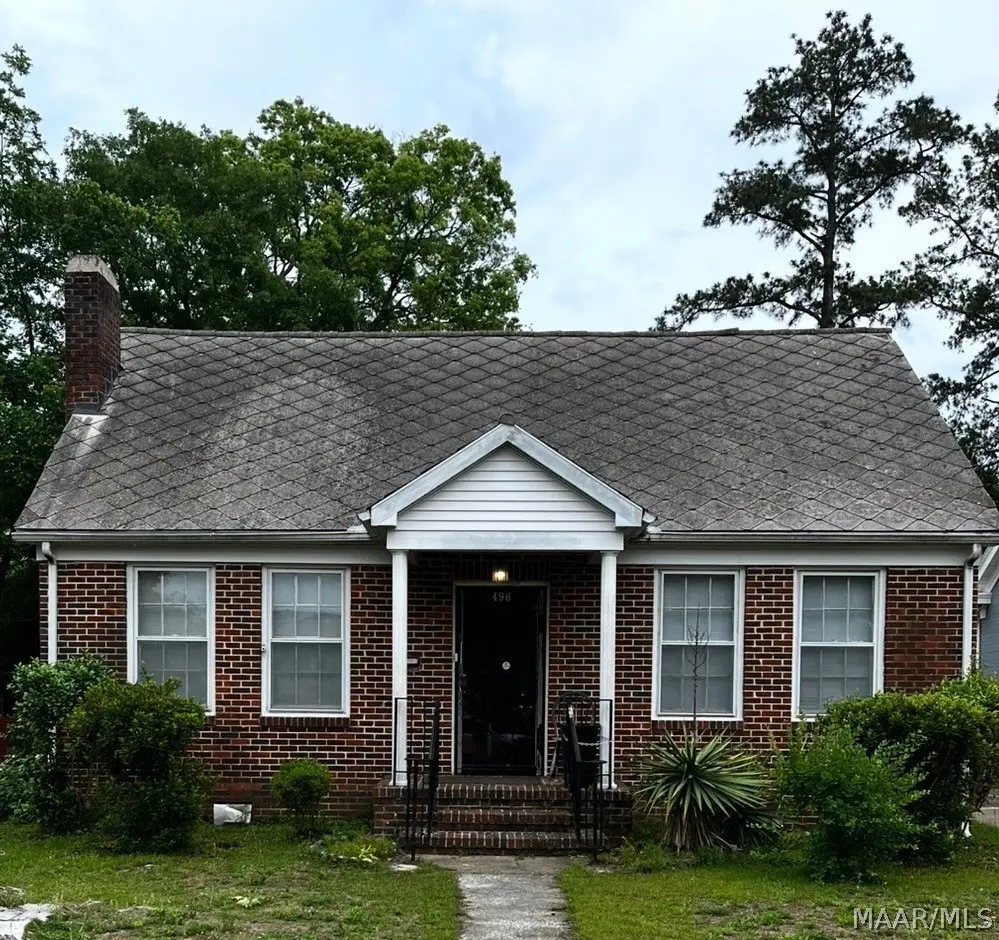
496 King St · Selma, AL
Flood risk 1/10 · Minimal
- FEMA flood zone
- X (unshaded)
- Chance of flooding over 30 yrs
- 0.0%
- Est. flood insurance / yr
- $507 – $1,088
Fire risk 3/10 · Minor
- Est. fire insurance / yr
- $916 – $1,700
Heat risk 7/10 · Major
- Hot days now (above 108°F)
- 7 days/yr
- Hot days in 30 yrs
- 19 days/yr
Wind risk 8/10 · Major
- Chance of severe wind over 30 yrs
- 80.0%
Air-quality risk 2/10 · Minimal
- Unhealthy air days now
- 0 days/yr
- Unhealthy air days in 30 yrs
- 1 days/yr
Risk factors via First Street. Map © Google.
Why this score? — see what drove the C- grade
The composite is a weighted blend of 9 inputs, each scored 0–100. Each bar is that input's sub-score; the figure is the points it added to the 100-point composite (weight × sub-score).
- Cash flow +23.1/30.0
- ARV discount +7.5/15.0
- DSCR +7.4/10.0
- 1% rule +6.0/10.0
- Livability +2.8/5.0
- Rent growth +2.5/5.0
- Condition / age +2.5/5.0
- Schools +0.9/10.0
- Appreciation +0.0/10.0
$98,400
🖨 Deal sheet 📄 Offer letter ✓ Due diligence
Listing remarks
Step into a perfect blend of historic charm and stylish modern living. Nestled in Old Town Selma area, this beautifully, maintained 3-bedroom, 1.5-bathroom brick home offers a spacious, roomy layout designed for both comfort and functionality. APPOINTMENT REQUIRED. HOME IS OCCUPIED BY ELDERLY RESIDENT. PLEASE PROVIDE AMPLE NOTICE AND CALL LISTING AGENT PRIOR TO SHOWING. THANK YOU
Key facts
- 8,712 sq ft lot
- Garage
- Built 1945
Property features AI
Exterior
- Parking: Detached garage; Driveway
- Utilities: Public water; Public sewer; Electricity available
- Home design: One-story; Brick construction; Year built per public records
- Construction: Brick exterior
- Exterior features: Partial fence; Covered, screened porch; Storage shed; City lot
Interior
- Kitchen: Eat-in kitchen
- Bedrooms: Main bedroom (first level); Bedroom (second level); Bedroom (third level)
- Flooring: Laminate
- Bathrooms: 1 full bathroom; 1 half bathroom
- Heating & cooling: Central heating (electric); Central air conditioning (electric)
- Interior features: Sunroom; Kitchen/Dining combo
- Laundry & utility: Laundry room; Electric water heater
Neighborhood map
What this means for you Summary
Snapshot
- This is a 3-bed/1.0-bath single-family listed at $98k.
Deal economics
- At list price, monthly cash flow is $176 ($2k/yr) — positive.
- The deal already cash-flows at list — no discount required.
- Meets the 1% rule at list price ($1k rent vs $98k).
- Recommended offer: $97k (1.5% below list) — sets the bar for market timing.
Location & tenants
- Location reads 56/100 on livability (#407 in AL) — a working-class tenant base; expect higher turnover. Strengths: cost of living A+, housing B; Watch: schools F, crime F, amenities F.
- Selma City (town): math 2% / reading 23% proficiency, ranked #118 of 129 in AL (top 92%) — low school quality limits family demand, transient renter base, plan for 1-2y turnover; 84% free/reduced lunch — lower-income household profile, screen leases tightly.
- Market conditions: 104 active listings in the ZIP; 7 units permitted in Dallas County in 2024 (0 in 5+ unit buildings).
Forward outlook
- Local home prices are declining (-3.0%/yr); year-one equity from $680 of loan paydown is wiped out by about $3k of value loss. Plan a longer hold.
- Dallas County population projected at -36% by 2050 — secular population decline; favor cash flow + early exit over multi-decade hold.
Negotiation context
- It's been on market 27 days — a 2% lower offer ($97k) is reasonable based on typical stale-listing flexibility.
Risks & watch-outs
- Watch-outs: built in 1945 — expect roof / HVAC / electrical / plumbing capex.
- Climate carrying-cost: severe wind risk, 80% chance of damaging wind over 30y; extreme-heat days projected 7→19/yr by 2055 (HVAC capex compounding) — expect insurance premiums to compound above CPI over the hold.
Questions for the listing agent
- Built in 1945 — when were the roof, HVAC, electrical panel, plumbing, and water heater last replaced?
- Is there a deadline driving the sale (1031 exchange, divorce, estate, relocation)? That informs how much negotiation room exists.
- Schools are F-rated, which usually means shorter tenancies and higher turnover. Who's the typical renter profile here, and what's been the actual vacancy rate?
- Crime grade is F in this area — have there been break-ins, vandalism, or insurance claims at this property in the last 3 years? What carrier currently insures it and at what premium?
- What's the average days-on-market for RENTAL listings here right now (not sales)? A rising rental-DOM trend means longer vacancies and softer asking-rent achievability than the comps imply.
- What's the recent tenant-quality profile in this submarket — average credit score on applications, eviction rate, late-payment / NSF rate, and stable-employment percentage? A property-management company in the area should have these aggregated.
- How much new for-sale + rental construction is in the pipeline within 1–3 miles? Heavy new supply typically softens prices + rents 12–24 months out; constrained supply supports both.
Investment metrics
- 1% rule
- 1.10% ✓
- Cap rate
- 8.44%
- Cash-on-cash
- 7.66%
- DSCR
- 1.34
- GRM
- 7.6
CMA / ARV
- ARV (on-the-fly)
- $37,548
- Comps found
- 5
Show comp detail 5 sales within ~0.75 mi
| Address | Dist | Beds/Ba | Sqft | Sold | Price | $/sf | Match |
|---|---|---|---|---|---|---|---|
| 715 Arsenal Pl | 0.55mi | 3/2.0 | 1,832 (+2%) | 2mo | $55,000 | $30 | 64 |
| 510 Selma Ave | 0.32mi | 2/1.0 (-1) | 1,580 (-12%) | 1mo | $12,500 | $8 | 60 |
| 712 Young St | 0.21mi | 3/1.0 | 1,920 (+7%) | 22mo | $40,000 | $21 | 60 |
| 414 Tremont St | 0.41mi | 3/1.0 | 1,614 (-10%) | 13mo | $62,000 | $38 | 53 |
| 128 Alabama Ave | 0.40mi | 3/2.0 | 2,054 (+15%) | 14mo | $15,000 | $7 | 42 |
Match score weights: distance 35% · size 25% · config 20% · recency 20%. Top-matched comps best support the ARV.
Projected returns pro-forma
-3.0% appreciation · 3.0% rent growth · sell at horizon
- IRR
- -4.6%
- Equity multiple
- 0.83×
- Total profit
- $-4,724
- Equity at exit
- $14,672
- IRR
- 5.1%
- Equity multiple
- 1.38×
- Total profit
- $10,380
- Equity at exit
- $8,508
Cash invested: $27,552 (down + closing). Projections, not guarantees.
Landlord ↔ Tenant lean methodology
- Overall (STATE)
- 90 Strongly Landlord-Friendly
- State Alabama
- 90 Strongly Landlord-Friendly · R+15
- County
- — inherits STATE
- City
- — inherits STATE
ZIP-level market 36701
- Home prices YoY
- -6.3%
- Active inventory
- 104
- Price-to-rent
- 7.6×
Monthly cashflow live
- Estimated rent
- $1,083 medium interval (Pro) →
- Mortgage (P&I)
- −$516
- Tax est. 1.5%
- −$123 /mo · $1,476/yr
- Insurance
- −$41
- HOA
- −$0
- Vacancy / Maint / Mgmt
- −$228
- Net cashflow
- $176
Break-even live
UW: 25.0% down · 7.5% · 30yr · 1.5% tax · 5.0% vac · 8.0% maint · 8.0% mgmt
Financing live
Cash to close
- Down payment
- $24,600
- Closing costs
- $2,952
- Reserves months
- —
- Total cash needed
- —
Loan-product check · same deal, 3 products live
Conventional
25% down · 7.5% · 30yr
- Down + closing
- —
- Monthly P&I
- —
- Monthly cashflow
- —
- DSCR
- —
- Eligible?
- —
Personal DTI + credit; lowest rate.
DSCR
20% down · 8.5% · 30yr
- Down + closing
- —
- Monthly P&I
- —
- Monthly cashflow
- —
- DSCR
- —
- Eligible?
- —
No personal income docs; deal must DSCR.
Hard money
10% down · 12.0% · 12mo
- Down + closing
- —
- Monthly P&I
- —
- Monthly cashflow
- —
- DSCR
- —
- Eligible?
- —
Short-term bridge; refi at stabilization.
Listing history 17 events
-
2026-06-19days on market $98,400 Active 27 DOM
-
2026-06-18days on market $98,400 Active 26 DOM
-
2026-06-17days on market $98,400 Active 25 DOM
-
2026-06-16days on market $98,400 Active 24 DOM
-
2026-06-15days on market $98,400 Active 23 DOM
-
2026-06-14days on market $98,400 Active 21 DOM
-
2026-06-12days on market $98,400 Active 20 DOM
-
2026-06-09days on market $98,400 Active 17 DOM
-
2026-06-08days on market $98,400 Active 16 DOM
-
2026-06-07days on market $98,400 Active 15 DOM
-
2026-06-07days on market $98,400 Active 14 DOM
-
2026-06-04days on market $98,400 Active 11 DOM
-
2026-06-02days on market $98,400 Active 10 DOM
-
2026-06-01days on market $98,400 Active 9 DOM
-
2026-05-31days on market $98,400 Active 8 DOM
-
2026-05-31days on market $98,400 Active 7 DOM
-
2026-05-18$98,400 Active
ⓘ Source: listings_history table (triggers on properties + properties_extension) + one-shot
backfill from property_details.listing_events for pre-trigger history.
Climate risk First Street
- Flood 1/10 Low FEMA zone X (unshaded) · 0% chance over 30 yrs
- Wildfire 3/10 Moderate
- Heat 7/10 Severe 7 d/yr ≥108°F today · 19 d/yr by 30 yrs out
- Wind 8/10 Severe 80% chance of damaging wind over 30 yrs
- Air quality 2/10 Low 0 unhealthy d/yr today · 1 by 30 yrs out
Nearby sold comps map
Loading sold comps map…
Walkable amenities ~0.75 mi
Loading nearby amenities…
Taxation est. · year 1
- Rental income
- $13,002
- − Mortgage interest
- −$5,512
- − Property taxes
- −$1,476
- − Insurance
- −$492
- − Repairs & maintenance
- −$1,040
- − Management
- −$1,040
- − Depreciation
- −$2,863
- Taxable income
- $579
- Est. tax owed @ 24.0%
- −$139
- After-tax cash flow
- $1,972/yr
For passive investors: Depreciation is non-cash, so a rental often shows a tax loss while cash-flowing — sheltering income. Rental losses are passive: they offset passive income freely, and up to $25,000/yr can offset ordinary (W-2) income if you actively participate and your MAGI is under $100k (phasing out to $0 by $150k); unused losses carry forward. On sale, claimed depreciation is recaptured at up to 25%, and gains may owe capital-gains tax (a 1031 exchange can defer both). Figures are a year-1 estimate at your 24.0% rate — not tax advice; consult a CPA.
Schools (NCES district)
- District
- Selma City
- NCES district ID
- 0102970
- Math proficiency
- 2% ▼ -24.00%
- Reading proficiency
- 23% ▼ -2.00%
- Median HH income
- $23,380
- Composite
- 9.07/100
- National rank
- #9870
- State rank
- #118 of 129 in AL
Livability — Selma
- Score
- 56/100
- State rank
- #407
- US rank
- #22550
Category grades
Schools grade is shown separately in the Schools card above.
Census & demographics
- Census place
- Selma, AL
- Population (ZIP)
- 22,358
Population outlook (Dallas County) Hauer SSP2
- Today (2025)
- 35,464 people
- By 2030
- 32,631 · -8.0%
- By 2040
- 27,246 · -23.2%
- By 2050
- 22,691 · -36.0%
- By 2075
- 14,867 · -58.1%
- By 2100
- 10,285 · -71.0%
Race, ethnicity, and origin ACS 2023
- Neighborhood character
- Predominantly Black (69%)
- Race & ethnicity
- Black 69% White 28% Hispanic / Latino 2%
- Common ancestry
- Serbian 1% Lithuanian 1% Slovak 1%
- Foreign-born
- 2% · Canada
- Languages at home
- 98% English-only · Spanish 1%
Political lean MEDSL · Dallas
- 2024 margin
- Solid D (+32.5) · D 65.9% · R 33.4%
- 2008→2024 swing
- -2.0pp toward R · 2008: 34.5pp · 2024: 32.5pp
- All cycles
- 2024: D+32.5 2020: D+37.5 2016: D+37.6 2012: D+39.7 2008: D+34.5
Not yet ingested
- Civics
- —
Market trends
- HPI YoY
- ▼ -11.98%
- Current HPI
- 176.6034
- Rent YoY
- —
- Metro
- —
- State GDP YoY
- ▲ 2.94%
- F500 in state
- 4
Industry mix (Fortune 500 HQ in AL)
| Industry | F500 HQs | Revenue |
|---|---|---|
| Financial Services | 1 | $8B |
|
||
| Healthcare | 1 | $5B |
|
||
Price history
1 event — show timeline
- 2026-05-18 Listed $98,400 MAAR
Cash-flow waterfall
monthlySold comps — $/sqft
last 12 mo · ≤1 miLoading sold comps…